Search behavior in higher education is changing fast. With Google’s Search Generative Experience (SGE), prospective students and parents are no longer just scanning lists of links; they’re receiving direct, AI-generated answers at the top of the page. These summaries pull from multiple sources to deliver concise, conversational responses to complex questions about programs, costs, outcomes, and campus life.
For schools, the implication is clear: your content must be structured, authoritative, and context-rich to be surfaced by AI. If it isn’t, your institution may be invisible, regardless of how strong your traditional SEO once was.
This article explores Google SGE in education, explains what Google SGE means for higher education marketing, and how schools can adapt. We’ll cover why AI search matters, how generative AI changes content discovery, and the practical steps institutions can take, from content optimization to local SEO and reputation management, to remain visible in this new search landscape.
Need help refining your school search optimization strategy?
Discover how our specialized services can help you connect with and enroll more students.

What Is Google’s AI Search (SGE) and Why Does It Matter for Schools?
Google’s Search Generative Experience, now commonly surfaced as AI Overviews, represents a major shift in how search results are delivered. Instead of presenting users with a list of links, Google increasingly provides synthesized, AI-generated answers that pull information from multiple sources and present it as a concise, conversational summary.
Google SGE in education functions like an advanced featured snippet. For example, when a parent searches “best engineering programs in Ontario,” Google’s AI may generate a short comparison of several institutions, highlighting locations, strengths, and differentiators without requiring the user to click through to individual websites. This fundamentally changes how prospective students and families discover schools.
For institutions, the stakes are high. AI Overviews often answer questions about programs, admissions, outcomes, and comparisons directly in the search results. If your school is not referenced in that response, you may miss visibility at an important early decision-making moment. Visibility in AI-generated answers is quickly becoming as important as first-page rankings once were in traditional SEO.
There is also an opportunity. Early third-party studies suggest that Google’s AI Overviews may cite content beyond the top organic rankings, particularly when pages clearly and directly answer a user’s question. Well-structured, authoritative content that clearly answers a specific question can be surfaced even if it does not rank first in classic search. This creates room for smaller or lesser-known institutions to compete based on content quality and relevance rather than brand dominance alone.
SGE also changes user behavior. Search becomes conversational, with follow-up questions that refine intent and narrow comparisons. Schools must be prepared to show up for detailed, context-driven queries, supported by accurate content and complete institutional data across Google platforms.
Google’s AI search prioritizes clarity, authority, and usefulness. Schools that adapt to this shift gain visibility at critical moments. Those who do not risk being bypassed entirely.
How Can My School Improve Its Visibility in AI-Powered Search?
Achieving visibility in AI-driven search results requires a blend of traditional SEO best practices and newer approaches often referred to as Generative Engine Optimization. This means maintaining a strong SEO foundation so Google understands and trusts your site, while also optimizing your content and digital presence for how AI retrieves, synthesizes, and presents information.
Below are the key strategies schools should focus on to improve their chances of being featured in AI-powered search results.
1. Maintain a Strong SEO Foundation
First and foremost, SEO is not dead. It is the foundation on which AI search visibility is built. Google’s AI Overviews continue to rely on reliable, well-structured, and authoritative content, often drawing from pages that already follow SEO best practices.
Google has made it clear that content aligned with its established guidelines, including experience, expertise, authoritativeness, and trustworthiness, performs well in AI-driven results. Schools should continue to invest in core SEO fundamentals, including the following.
Keyword Optimization and Metadata
Use clear, relevant keywords in page titles, headings, and meta descriptions so both traditional search algorithms and AI systems can quickly understand your content. A program page titled “MBA Program in Data Analytics | XYZ University” clearly communicates relevance and improves discoverability.
Logical Site Structure
Organize your site navigation and URLs logically so search engines can easily crawl and contextualize content. A clean hierarchy helps AI retrieve specific details such as tuition, admissions requirements, or program outcomes by following your site’s structure.
Mobile-Friendly, Fast-Loading Pages
Most prospective students search on mobile devices. Google prioritizes mobile usability and fast load times regardless of AI. A strong user experience encourages engagement and signals content quality to Google’s systems.
Example: University of Arkansas at Little Rock (UA Little Rock): Launched a redesigned website in 2025 that prioritized technical SEO fundamentals. The web team conducted a full content audit to streamline site architecture, consolidating and rewriting content for clarity and removing outdated information to improve crawlability and usability. This resulted in a leaner, more crawlable site aligned with best practices.
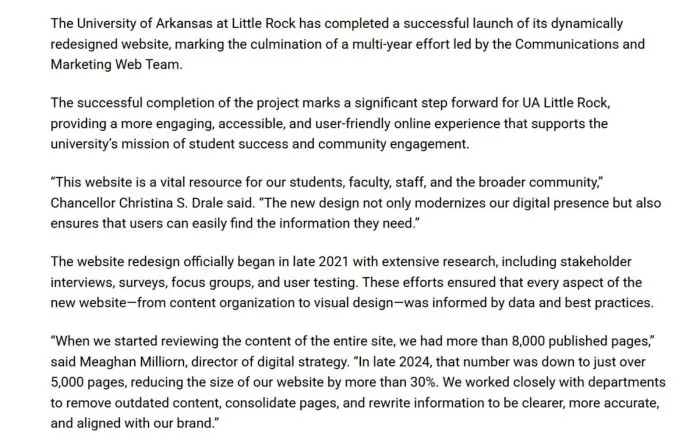
Source: University of Arkansas at Little Rock
Quality Content and User Engagement
Continue publishing in-depth, high-quality content. This attracts backlinks, increases time on site, and positions your pages as authoritative sources that AI systems are more likely to reference.
Think of traditional SEO as the bedrock. If your site is not technically sound and rich in valuable content, AI-focused tactics will not compensate. A strong foundation amplifies everything that follows.
2. Create High-Quality, AI-Friendly Content (Answer the Questions)
With the basics in place, the next step is tailoring content for conversational, answer-focused search behavior. AI-powered search excels at interpreting natural-language questions, especially longer and more specific queries.
To improve visibility, your content should directly address the questions prospective students and parents are asking, using clear structure and plain language.
Incorporate Long-Tail, Question-Based Keywords
Shift part of your keyword strategy toward detailed, conversational queries. Instead of focusing only on broad terms like “MBA Canada,” develop content around questions such as “best MBA programs in Canada for working professionals” or “how to get a scholarship for an MBA.” AI systems are more likely to surface content that closely matches how users phrase their questions.
Use Q&A and FAQ Formats
Question-and-answer formats are particularly effective for AI extraction. Admissions, financial aid, and program pages benefit from clearly labeled questions followed by concise, factual answers. This structure improves usability for readers and makes it easier for AI to identify relevant information.
Example: University of Illinois Urbana-Champaign: Incorporates “Answer Engine Optimization (AEO)” into its content guidelines for web writers. The University’s brand training recommends structuring content in a Q&A format: start with a question in a heading (e.g. *“How do I apply to Illinois?”), Immediately answer it in a brief, concise paragraph before expanding with additional detail. This approach, coupled with applying FAQ schema markup, is designed to make Illinois’s content the direct answer in featured snippets or AI summary boxes. By focusing on full questions and concise answers, Illinois ensures its high-value content is AI-friendly and voice-search ready.
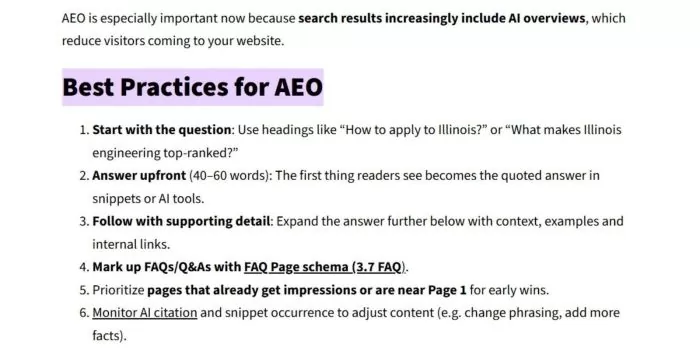
Source: University of Illinois Urbana-Champaign
Emphasize Authoritative, In-Depth Content
AI systems favor content that demonstrates expertise and depth. Schools can leverage faculty insight, research, and real-world outcomes to establish authority. Long-form guides, career pathway articles, and program explainers grounded in institutional expertise are strong candidates for AI-generated answers.
Structured Headings and Clear Writing
Organize content using descriptive headings and subheadings. Avoid burying key information in long paragraphs. Specific headings aligned with search intent help AI match your content to relevant queries. Lists and step-by-step explanations are especially useful, as AI often presents answers in list form.
Evergreen Content and Regular Updates
Keep content current. Evergreen content still requires periodic updates to remain accurate and competitive. AI systems favor up-to-date information, particularly for admissions policies, program offerings, and career outcomes.
By focusing on high-quality, question-oriented content, schools make it easier for AI to identify, trust, and reuse their information.
3. Leverage Local SEO and Google Business Profiles
For institutions with physical campuses, local SEO is a critical component of AI visibility. Many education-related searches carry local intent, and Google’s AI frequently integrates local data into its answers.
Claim and Optimize Your Google Business Profile
Ensure your Google Business Profile is claimed, complete, and accurate. Fill out all fields, including locations, contact information, categories, and descriptions. This data is often pulled directly into AI-generated results.
Example: University of Minnesota: Manages a centralized Google Business Profile (GBP) for its campuses to maximize local search visibility. The University’s marketing team keeps each campus’s GBP listing complete and up-to-date with addresses, hours, phone numbers, and descriptive text. They also utilize GBP features like posts and photos to highlight campus events and attributes. Following Google’s best practices, Minnesota fills out “as much location information as possible,” keeps listings current (e.g., holiday hours), and uses relevant keywords in descriptions and local posts to improve local search ranking. This ensures the University’s locations appear prominently on Google Search/Maps for relevant queries.
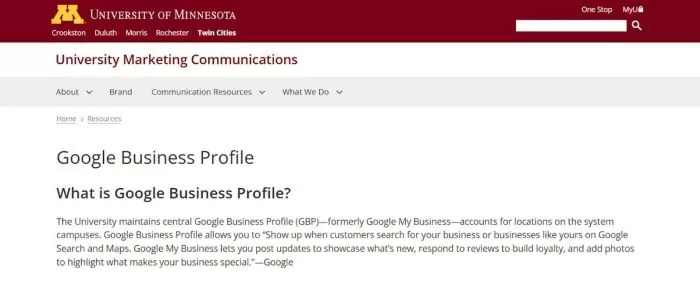
Source: University of Minnesota
Keep Photos and Media Up to Date
AI-generated listings frequently include logos and photos. Upload high-quality, current images of your campus, facilities, and branding. Visuals influence perception and can strengthen your presence in AI results.
Incorporate Local Keywords on Your Site
Mention your city, region, and community naturally within site content. Blog posts, news updates, and program pages that reference local partnerships or opportunities help AI associate your institution with specific locations.
Maintain Consistent Local Citations
Ensure your institution’s name, address, and phone number are consistent across directories, education portals, and social platforms. Consistency reinforces credibility for AI systems aggregating information.
Use Google Business Features Strategically
Google Posts, Q&A sections, and program listings provide additional structured data that AI can reference. Schools that actively manage these features offer clearer signals to Google’s systems.
Strong local SEO increases the likelihood that your institution appears in AI-generated responses to geographically relevant searches.
4. Embrace Online Reviews and Social Proof
Why are online reviews important for AI search results? Online reviews provide fresh, user-generated content that signals credibility and relevance to AI systems. Positive, detailed reviews can help your institution appear in AI-generated answers by reinforcing trust, boosting visibility, and enriching the data AI uses to evaluate and summarize schools in search results.
Online reviews now influence both human decision-making and AI-generated search results. Google’s AI Overviews often incorporate ratings and review themes directly into responses.
Maintain Strong Ratings
In competitive searches, AI systems tend to highlight institutions with strong review profiles, as ratings and review sentiment are commonly incorporated into AI-generated summaries. Strong ratings are increasingly a prerequisite for visibility, not just a reputation metric.
Monitor Review Content
AI systems analyze recurring themes within reviews. Frequently mentioned strengths or concerns can appear in AI-generated summaries. Active monitoring helps ensure accuracy and context.
Encourage Positive Reviews
Develop a structured approach to requesting reviews from satisfied students, alumni, and parents. Reviews that mention specific programs, facilities, or experiences provide richer signals for AI.
Example: Midwestern Career College: Encourages its community to engage on Google’s review platform for each campus location. On its official website, MCC provides step-by-step instructions for students to leave a Google review – from clicking the campus’s Google My Business link to hitting the “Write a review” button. This call-to-action shows MCC actively seeks public feedback. By driving satisfied students to post reviews, the college strengthens its online reputation and local search rankings. The steady flow of positive Google reviews serves as social proof to prospective students scanning the web for authentic feedback.
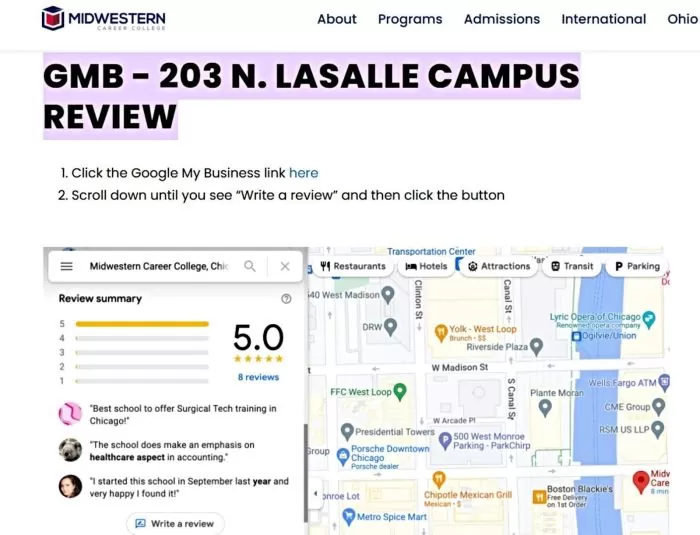
Source: Midwestern Career College
Diversify Review Sources
While Google reviews are most influential, other education-focused platforms and social feedback also contribute to the broader information ecosystem AI systems draw from.
Showcase Testimonials on Your Site
Highlight authentic testimonials and success stories on your website. When properly structured, these can reinforce credibility for both users and AI-driven search systems.
Online reviews have become direct inputs into how AI describes institutions. Active review management strengthens both reputation and search visibility.
AI-powered search rewards clarity, authority, and usefulness. Schools that invest in strong SEO foundations, question-driven content, local optimization, and reputation management are far more likely to appear when prospective students turn to AI for answers.
In an AI-first search environment, visibility belongs to institutions that make it easy for both people and machines to understand their value.
5. Optimize Visual and Multimedia Content
AI search results are no longer limited to text. They increasingly include images and videos to help users evaluate options more quickly. A search about campus life may trigger a photo carousel, while a branded university query could surface a campus tour video alongside the AI-generated answer. If your visual assets are weak, outdated, or poorly optimized, you risk losing attention even when your institution is referenced.
To compete effectively, schools must treat multimedia as a core part of search optimization, not a design afterthought.
Image Optimization
Images should be handled with the same rigor as written content. Start by using descriptive file names that clearly indicate what the image represents. Replace default camera names with specific, readable names such as school-name-library.jpg or university-science-lab.jpg.
Alt text is equally important. It should accurately describe the image in plain language and, where appropriate, align with the page topic. For example, an image of a new facility might use alt text such as “State-of-the-art science lab at [School Name].” Avoid keyword stuffing or vague descriptions.
Page performance matters. Large, uncompressed images slow load times, which negatively affects SEO and user experience. Since AI systems often surface images closely tied to page content, it is also important to place your strongest visuals on pages where the surrounding text is directly relevant. If a user asks what your campus looks like, Google can only surface your images if they are indexable, contextualized, and optimized.
Example: Fort Lewis College: Ensures that images and videos on its site are optimized for both user experience and search visibility. Fort Lewis’s Web Style Guide instructs editors to compress and properly size images for fast loading, and to always include descriptive alt text for accessibility and SEO. For multimedia content, the college provides captions or transcripts for videos, knowing that search engines (and users) can’t index what isn’t in text form. By adding text transcripts to videos and alt tags to images (with relevant keywords where appropriate), Fort Lewis makes its visual content discoverable by AI and voice search tools while also improving page load times.
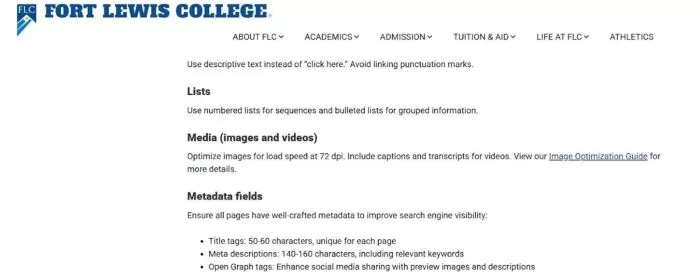
Source: Fort Lewis College
Infographics and Charts
Custom graphics can strengthen authority, especially when they communicate outcomes, rankings, or program pathways. When using infographics or charts, include them on relevant pages with concise captions that explain what the visual shows. Captions help users and clarify context for search systems.
Do not place critical information exclusively inside images. If a chart highlights graduate employment rates or admissions statistics, repeat the key points in HTML text. This improves accessibility and ensures AI systems can accurately interpret and reference the information.
Video Content (YouTube and Beyond)
Video is often the first impression prospective students have of an institution. Google regularly surfaces YouTube videos in search results, including AI-enhanced answers. A query like “tour of [School Name] campus” may show a playable video immediately, making video optimization essential.
Focus on video content that addresses high-intent questions, such as campus tours, residence life walkthroughs, student testimonials, program overviews, and admissions explainers. Titles and descriptions should be clear, descriptive, and aligned with how users search. For example, “Campus Tour | [School Name] | Student Life and Facilities” is more effective than a generic welcome video title.
On your website, embed key videos on relevant pages and include a transcript or written summary. Video alone provides limited context for AI. Supporting text gives search systems content they can analyze and reference. Engagement signals also matter. Videos with strong watch time and interaction are more likely to surface in search results.
Schema for Videos and Images
Use schema markup where appropriate, particularly VideoObject schema for important videos. Structured data helps search engines understand what a video contains, its duration, and its purpose. While schema does not guarantee AI inclusion, it improves clarity and future-proofs your content as search becomes more structured.
Example: Michigan Technological University: Integrates video SEO into its content strategy to capitalize on the popularity of video content. Michigan Tech advises its departments to treat video content like web text content for optimization: use keyword-rich titles and descriptions on YouTube, and crucially, attach accurate transcripts or captions to each video. Providing a transcript allows Google and other AI-driven search engines to “understand” the video’s content.
Michigan Tech emphasizes the importance of captions and transcripts so search engines can understand video content. More broadly, platforms like Google and YouTube use metadata such as titles, descriptions, and timestamps to better interpret video relevance in search results.These practices ensure the university’s lectures, tutorials, and marketing videos are accessible to search engines and can surface in voice or AI search responses.
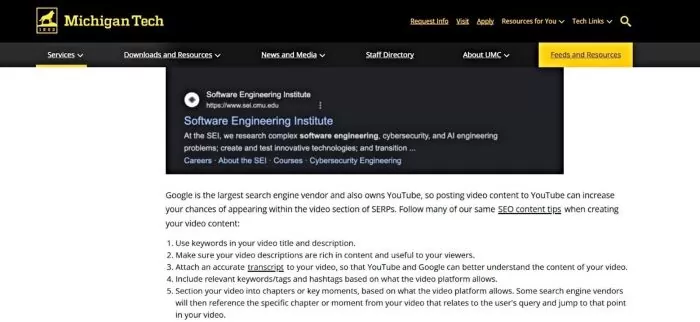
Source: Michigan Technological University
Speakable Content and Voice Search
As AI search integrates more closely with voice assistants, content clarity becomes even more important. While Speakable schema is not widely used in education yet, schools should focus on writing concise, well-structured answers to common questions. Clear summaries on admissions, tuition, and programs prepare your content for both visual and voice-based search experiences.
Multimedia optimization improves both visibility and perception. Strong images and videos help schools appear in AI results and stand out once they do.
6. Use Structured Data and Clean Site Architecture
Structured data and clean site architecture significantly improve how accessible your content is to AI systems. Generative AI for colleges relies on context, and schema markup provides that context explicitly. A logical site structure ensures important information is easy to find and understand.
Education-Specific Schema
Schools should implement schema types relevant to higher education. EducationalOrganization schema supports institutional information. Course schema describes programs and credentials. FAQPage schema is ideal for admissions and financial aid questions, while Event schema works well for open houses and webinars. When the schema aligns with visible page content, it increases Google’s confidence in surfacing that information.
Example: University of Minnesota: Embraces structured data to enhance how its content appears in AI-powered results. In October 2025, U of M’s marketing tech team rolled out new schema features across its Drupal web platform to better label content for search engines. Their official guide explains “that’s the power of structured data” – snippets of code that help search engines and AI understand page details like program offerings, alumni, FAQs, etc., leading to rich search results. Minnesota’s web environment includes a Schema.org metatag module, and they continually update it (e.g., adding support for alternate organization names and parent organizations in 2025) so that university webpages can output a comprehensive JSON-LD schema. This clean, machine-readable markup boosts the visibility of U of M content in rich results and AI summaries.
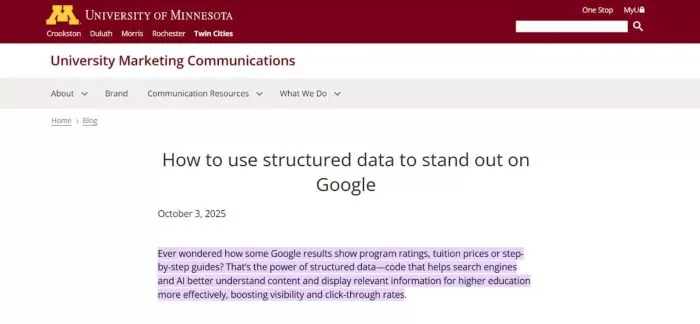
Source: University of Minnesota
FAQ and Q&A Schema
The FAQPage schema is especially valuable for AI-powered search. It clearly signals which text answers specific questions. If a prospective student asks about tuition or application deadlines, schema-marked answers increase the likelihood that AI systems pull accurate snippets directly from your site.
Clean URLs and Logical Hierarchy
Your site structure should be intuitive and reflected in URLs. Paths like /academics/programs/computer-science help both users and crawlers understand content relationships. Important pages should not be buried or scattered across PDFs without internal links. AI systems are more likely to surface well-organized pages than fragmented information.
Internal Linking
Use internal links to connect related content using descriptive anchor text. Admissions pages should link to financial aid details. Program pages should link to career outcomes or internship information. Internal linking helps AI systems follow context across your site and identify authoritative pages.
Technical Hygiene
Keep sitemaps updated, fix broken links, and ensure key pages are indexed. Avoid blocking important content with noindex tags or robots.txt. Do not rely solely on PDFs or images to communicate essential information. Always provide HTML text summaries for critical details.
Data Accuracy and Consistency
Structured data must match on-page content exactly. Inconsistent tuition figures, dates, or requirements can confuse AI systems and undermine trust. Centralizing frequently updated information reduces errors and improves reliability.
Clean structure and accurate schema make your site easier for AI to understand and more likely to be referenced correctly.
7. Stay Current and Adapt
The final requirement for AI-era visibility is continuous adaptation. AI-powered search is evolving quickly, and static strategies will fall behind.
Monitor Performance
Track impressions, click-through rates, and query patterns. Declining clicks may indicate users are getting answers directly from AI results. Identify affected pages and strengthen their value or clarity.
Use AI Evaluation Tools
Emerging tools can highlight gaps, such as missing schema or slow performance. While imperfect, they can help prioritize improvements.
Keep Content Updated
Refresh pages when programs, policies, or deadlines change. Update older content with current data and examples. AI systems favor recent, accurate information, especially for admissions and cost-related queries.
Watch Industry Trends
Follow credible SEO and higher education marketing sources to understand how AI search is evolving. Use early signals to adjust content strategy before visibility declines.
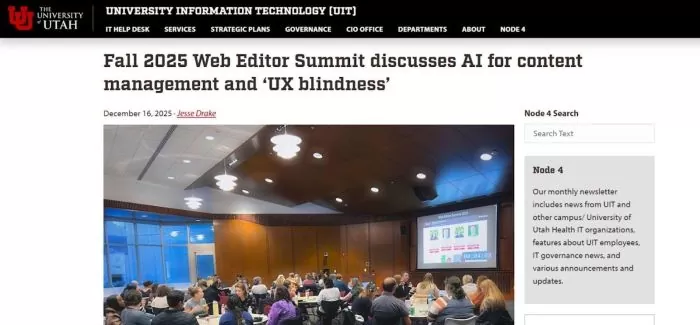
Example: University of Utah: Stays on the cutting edge by rapidly adapting to emerging search technologies and educating its staff. In late 2025, Utah’s Web Support & Usability team hosted a campus Web Editor Summit focused on the latest SEO and AI trends. They urged content editors to adjust strategies for AI-driven search, for example, by optimizing site content even if certain pages are blocked from traditional indexing (since AI models might analyze them regardless). Utah is even preparing for the next wave of AI by securing an enterprise ChatGPT license to integrate advanced AI into its services. By proactively training web editors on tools like custom GPTs and emphasizing new ranking factors, the University of Utah shows a commitment to continuous learning and quick adaptation in the AI era.
Source: University of Utah
Balance Optimization With Human Experience
AI visibility is only the first step. When users click through, your site must guide them clearly toward next actions. Strong user experience, clear calls to action, and authentic messaging remain essential.
Schools that combine technical discipline with ongoing refinement will remain visible as search continues to evolve. Continuous improvement is the most reliable long-term strategy in an AI-driven search environment.
Preparing Your School for AI-Driven Search
AI-powered search is fundamentally changing how prospective students discover, evaluate, and compare institutions. Visibility is no longer determined solely by blue-link rankings but by how clearly and credibly a school’s information can be understood and reused by AI systems. To remain competitive, schools must move beyond isolated SEO tactics and adopt a more holistic approach to search visibility.
This means maintaining strong technical SEO foundations, publishing content that directly answers real student questions, and ensuring visual, video, and structured data assets are optimized and accessible. Clean site architecture, accurate information, and consistent updates all play a role in whether an institution is surfaced or overlooked in AI-generated results. Just as important is a commitment to ongoing adaptation. AI search will continue to evolve, and schools that monitor performance, refine content, and prioritize the student experience will be best positioned to earn trust, attention, and engagement.
Need help refining your school search optimization strategy?
Discover how our specialized services can help you connect with and enroll more students.
FAQs
Question: What is Google’s AI Search (SGE) and why does it matter for schools?
Answer: Google’s Search Generative Experience, now commonly surfaced as AI Overviews, represents a major shift in how search results are delivered. Instead of presenting users with a list of links, Google increasingly provides synthesized, AI-generated answers that pull information from multiple sources and present it as a concise, conversational summary.
Question: How can my school improve its visibility in AI-powered search?
Answer: Achieving visibility in AI-driven search results requires a blend of traditional SEO best practices and newer approaches often referred to as Generative Engine Optimization. This means maintaining a strong SEO foundation so Google understands and trusts your site, while also optimizing your content and digital presence for how AI retrieves, synthesizes, and presents information.
Question: Why are online reviews important for AI search results?
Answer: Online reviews provide fresh, user-generated content that signals credibility and relevance to AI systems. Positive, detailed reviews can help your institution appear in AI-generated answers by reinforcing trust, boosting visibility, and enriching the data AI uses to evaluate and summarize schools in search results.