Does your campus fully utilize its student satisfaction scores at accreditation time? As a reminder, regular assessments of student satisfaction provide data for four key institutional activities:
• Retention/student success • Strategic planning • Recruiting new students • Accreditation documentation
The accreditation process can be time-demanding and stressful for your campus staff and leadership, yet it is essential to complete on the designated cycle. And while the official process is something you address once every decade, regularly gathering data from your students and maintaining proactive processes can make the official requirements go much more smoothly.
My colleague Charles Schroeder likes to say that during self-studies, people on campus begin running around gathering data and shouting, “The accreditors are coming! The accreditors are coming!” To avoid this reaction, our recommendation is don’t just assess student satisfaction as part of your self-study, but assess student satisfaction on a regular cycle, once every two or three years (if not annually).
4 ways to use student satisfaction scores to prepare for accreditors
How can you use data from student satisfaction surveys in your accreditation process? I have four suggestions for you.
1. Match the survey items to your accreditation requirements. As a resource for you, we have mapped the individual items on the Ruffalo Noel Levitz (RNL) Satisfaction-Priorities Surveys (including the Student Satisfaction Inventory, the Adult Student Priorities Survey, and the Priorities Survey for Online Learners) to the individual criteria for all of the regional accreditors across the United States. You can download the relevant mapping document for your survey version and region here. By seeing how the items on each survey are mapped to the regional accrediting agency requirements, you can take the guesswork out of determining how the student feedback lines up with the documentation you need to provide.
2. Respond to student-identified challenge items. The RNL Satisfaction-Priorities Surveys identify areas of high importance and low satisfaction as challenge items. These are priority areas for improvement based on the perceptions of your students. By actively working to improve the student experience in these areas, you can potentially improve overall student satisfaction, which studies have correlated with better individual student retention, higher institutional graduation rates, higher institutional alumni giving, and lower loan default rates. Improvements in these areas are going to look good for your accreditation.
3. Document your student-identified strengths. The RNL Satisfaction-Priorities Surveys also reflect student-identified strengths, which are items of high importance and high satisfaction. These are the areas that your students care about, and where they think you are doing a good job. Mentioning your strengths to your accreditors helps to position you in a positive light and to focus the conversation on where you are meeting or exceeding student expectations. 4. Show improvements over time. As indicated earlier, student satisfaction surveys should not be a “once and done” activity, or even an activity done just once every five to ten years. The institutions we work with which assess student satisfaction systematically every two or three years, and actively work to improve the student experience in the intervening years, are seeing student satisfaction levels increase year over year. This process shows your commitment to your students and to your accreditors, and reflects that continuous quality improvement is valued by your institution.
Ready to learn more?
Are you ready to regularly assess student satisfaction? Are you interested in connecting the results to your accreditation criteria? Do you want to learn more about moving forward with a satisfaction assessment? Contact RNL with any questions you have and we will look forward to assisting you.
Note: This blog was originally published in November 2016 and was updated with new content in May 2025.
How does student satisfaction at HBCUs compare to institutions nationally?
Student satisfaction is a critical component for student success. At RNL, we have observed that satisfaction can vary based on the institution type. Student satisfaction levels at a four-year private may differ from a four-year public. In addition, we have seen that students at schools with a specific identity or mission (such as Christian colleges) may also have different levels of satisfaction. This is why it is helpful for institutions to have an external perspective for comparing their satisfaction scores with institutions that are most like theirs—by type, region of the country, or by the particular population of students they serve.
The value and impact of Historically Black Colleges and Universities (HBCUs) is well known and documented. HBCUs play a crucial role in advancing educational equity, fostering leadership, and preparing students to excel in a global workforce. Despite comprising roughly 3% of U.S. colleges and universities, HBCUs produce nearly a quarter of all Black graduates, with impact extending beyond academic preparation, serving as powerful engines of economic growth, providing supportive learning environments, and culturally affirming communities at critical times in the student development cycle.
HBCUs have experienced a surge in student interest over the past several years, leading many campuses to review and refine recruitment and student success strategies. As a result of the increased prioritization of student satisfaction, over the past three years, RNL has created a national comparison group of four-year private and public HBCUs, offering the best external comparison by which institutions may compare themselves. These data can also inform our understanding of the student experience at HBCUs.
How satisfied are students attending HBCUs?
The RNL Student Satisfaction Inventory (SSI) is a survey instrument that measures student satisfaction and priorities. The assessment informs campuses of satisfaction levels of various aspects of the student experience, including instructional effectiveness, academic advising, and recruitment and financial aid. The assessment then identifies how those satisfaction levels affect student decisions related to persistence. Over the past three academic years (2021-22, 2022-23, and 2023-24), 8,938 students attending 20 HBCUs have completed the SSI, providing an opportunity for us to assess their satisfaction and compare it to students at other four-year public or private institutions.
Why do students choose HBCUs?
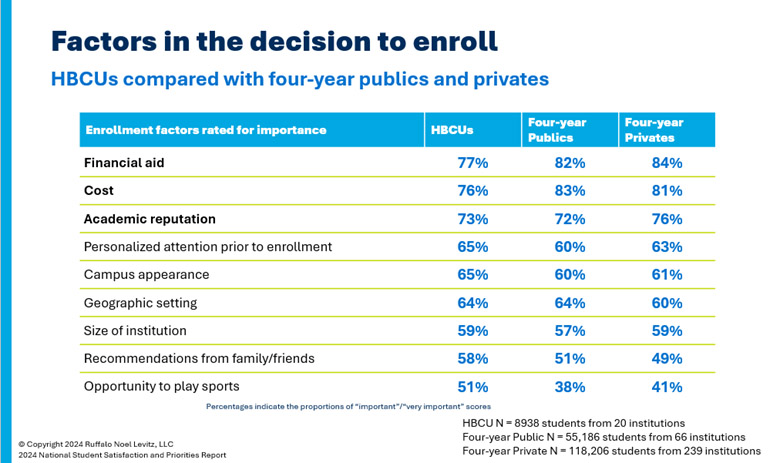
The SSI asks students to rate the importance of factors that influenced their decision to enroll at their college or university. When we explore the results for students at HBCUs compared with students at the other two institution types, we see the following levels of importance placed on each factor:
Note the higher importance levels HBCU students placed on recommendations from family and friends, underscoring the importance of highlighting student and alumni outcomes. These results invite university leaders, including admissions and enrollment officers, institutional advancement/transformation officers, and leadership within alumni affairs, to consider how they are positioning various factors and what messaging they may want to emphasize throughout the recruitment process.
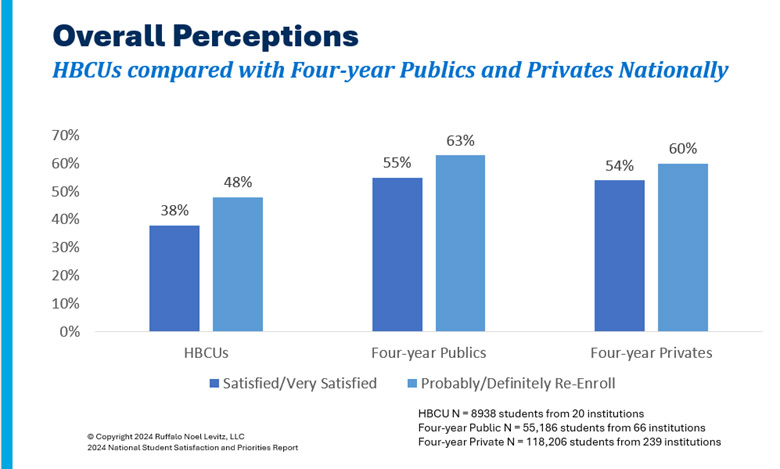
As this chart on overall perceptions indicates, students at HBCUs have lower levels over overall satisfaction and were less likely to say they would re-enroll at their institution if they had to do it all over again compared to four-year institutions nationally. Although several factors may contribute to differences in satisfaction levels, this indicates that there is potential for improvement in serving students at HBCUs and meeting their expectations. Several factors may contribute to the differences in satisfaction levels. The call to action, however, is clear—campuses must create and implement concrete action plans to address high priority concerns.
The Power of Institutional Choice
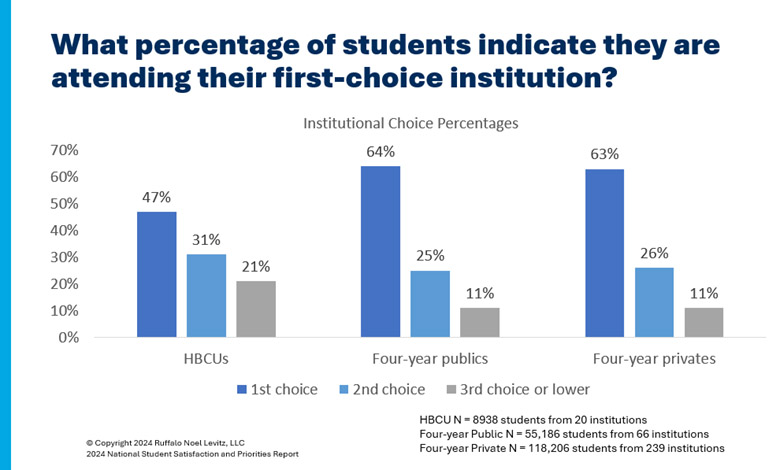
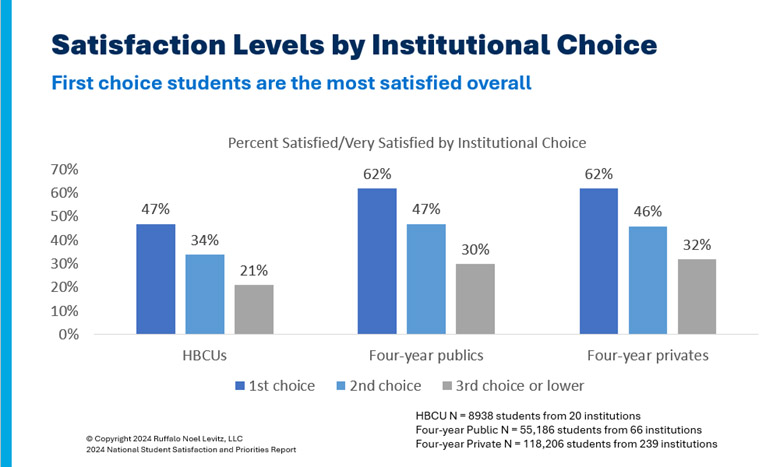
For years, RNL has noted that students attending their first-choice institution tend to have higher satisfaction than students attending their second- or third-choice institution. Ideally, an institution should strive to have the majority population believe the institution is their first choice, to be in the best position for higher satisfaction scores. In this HBCU data set, the impact of institutional choice is clearly seen. As illustrated in the chart below, only 47% of students indicate that the HBCU was their first choice, as compared with 64% of students at four-year public nationally and 63% of students at four-year private institutions.
While these two charts look similar, the second one shows the percentage of students who said they were satisfied or very satisfied with their experience based on whether they thought the school was their first-, second- or third-choice. These percentages decline considerably for students who did not want to attend the institution.
This indicates that HBCUs have an opportunity to better position themselves as a first-choice institution for the population of students they are actively recruiting and to communicate why their college is the best fit and the best option for the student. Larger sample sizes from HBCU campuses could further assist with understanding the impact of institutional choice on satisfaction levels.
Many strengths and a few challenges
The SSI asks students to indicate both a level of importance and a level of satisfaction with a variety of student experiences both inside and outside of the classroom. The combination of these scores lead to the identification of strengths (high importance and high satisfaction) and challenges (high importance and low satisfaction). Strengths and challenges are identified for individual institutions administering the survey instrument and can also be indicated for the national comparison data sets.
When we reviewed the national HBCU group of 8,938 students, more strengths than challenges were identified.
Strengths
My academic advisor is knowledgeable about requirements in my major.
Major requirements are clear and reasonable.
I am able to experience intellectual growth here.
Tutoring services are readily available.
Nearly all of the faculty are knowledgeable in their field.
My academic advisor is approachable.
The content of the courses within my major is valuable.
Library resources and services are adequate.
There is a strong commitment to racial harmony on this campus.
Faculty are usually available after class and during office hours.
There is a commitment to academic excellence on this campus.
Class change (drop/add) policies are reasonable.
Student disciplinary procedures are fair.
The student center is a comfortable place for students to spend their leisure time.
Library staff are helpful and approachable.
Bookstore staff are helpful.
While many of these strengths overlap with what we see in the national four-year private and public data sets, it is still noteworthy to highlight that, despite the generally lower satisfaction scores at HBCUs, there are still many areas to celebrate. Students value the support received by faculty and staff. Students appreciate the availability of academic resources. Students are highly appreciative that their campus communities are accepting and affirming of who they are and support who they are seeking to become.
Challenges
Only five challenges were identified in the national HBCU data set:
I am able to register for classes I need with few conflicts.
Tuition paid is a worthwhile investment.
Security staff respond quickly in emergencies.
This institution shows concern for students as individuals.
Faculty provide timely feedback about student progress in a course.
Again, most of these items overlap with challenges identified at the other institution types, which says that the experience students are having at HBCUs may be more similar than it is different. However, that does not discount the fact that the HBCUs bring something special to the marketplace for students.
Survey your students
While observing national norms is valuable, the greatest value comes when institutions survey their own student populations to determine satisfaction levels and to see specific strengths and challenges that apply to their college or university. Please contact Julie Bryant if you are interested in learning more about assessing student satisfaction on your campus. If you are an HBCU, RNL will provide the additional comparison group of just HBCUs to you at no additional charge.
RNL supports HBCUs through various initiatives aimed at enhancing enrollment, student success, and fundraising efforts. Key contributions include:
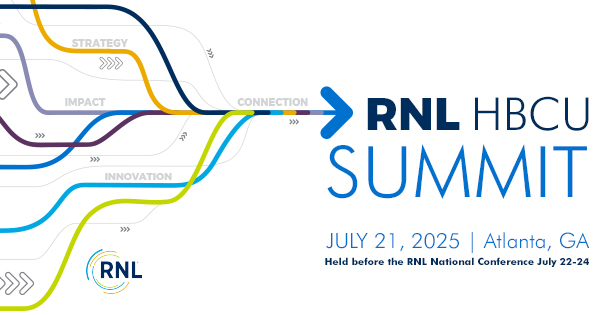
Annual HBCU Summit: RNL organizes a yearly summit tailored for HBCU leaders to network, share data, exchange ideas, and develop actionable plans for immediate campus implementation. This year’s summit will take place July 21 in Atlanta, Georgia, and will focus on marketing, recruitment, student success strategies, the impact of trends and technology on HBCUs and the impact sociopolitical climate shifts will have on operational strategy.
Dedicated team for HBCUs: RNL has an established team of senior-level consultants focused on supporting HBCUs. I lead this team, and we aim to help institutions enhance service to students, meet enrollment and revenue goals, and fulfill their mission.
Through these efforts, RNL demonstrates a commitment to empowering HBCUs with the tools and knowledge necessary to thrive in a competitive educational landscape.
2025 RNL HBCU Summit
July 21, 2025 in Atlanta
Join us for this one-day Summit held before the RNL National Conference. You’ll hear key strategies for meeting your goals for marketing, recruitment, and retention. Registration is complimentary when you also register for the RNL National Conference.
College students have changed greatly in 30 years, but how has student satisfaction changed?
Think back 30 years ago to 1995. What is different for you now? Where were you and what were you doing in the mid 1990s? Perhaps you were still in school and living at home, or not even born yet. Perhaps you were in your early years of working in higher education. Take a moment to reflect on what has (and has not) changed for you in that span of time.
Thirty years ago, I was just starting my position at what was then Noel-Levitz. What stands out for me was that I was about to become a mom for the first time. Now my baby is grown and will be a new mom herself later this year. And I find myself being on one of the “seasoned professionals” in the company, working alongside members of my team who were still in elementary school back in 1995.
Thirty years ago, we were just beginning to utilize email and the internet. Now they have become the primary way we do business, communicate professionally, and discover information. Artificial intelligence (AI) is the new technology that we are learning to embrace to improve our professional and personal lives.
Thirty years ago, students were arriving on our campuses, seeking an education, guidance, growth, belonging, value for their investment and ultimately a better life. That’s still the case today. Plus, students are navigating more technology options, they are more openly seeking mental health support, and they are living in a world full of distractions. Online learning is a reality now and continues to become more accepted as a modality, especially after the experiences of 2020. As the demographic cliff looms, colleges are expanding their focus to include lifelong learners.
Thirty years ago is also when the Student Satisfaction Inventory (SSI) was launched to provide four-year and two-year institutions with a tool to better understand the priorities of their students. (In the early 2000s, we added survey instruments specifically for adult and online populations.) The data identified where the college was performing well and where it mattered for them to do better in order to retain their students to graduation. The concept of looking at satisfaction within the context of the level of importance was new back then, but in the past three decades, it has become the standard for capturing student perceptions. Since 1995, we have worked with thousands of institutions and collected data from millions of individuals, documenting what is important and where students are satisfied or dissatisfied with their experience. As we reach this 30-year milestone for the SSI, I took some time to reflect on what has changed in students’ perceptions and what has stayed the same.
Consistent priorities
What stood out to me as I reviewed the national data sets over the past 30 years is that what matters to students has largely stayed the same. Students continue to care about good advising, quality instruction and getting access to classes. The academic experience is highly valued by students and is the primary reason they are enrolled, now and then.
Another observation is that there are two areas that have been consistent priorities for improvement, especially at four-year private and public institutions:
Tuition paid is a worthwhile investment.
Adequate financial aid is available for most students.
These two items have routinely appeared as national challenges (areas of high importance and low satisfaction) over the decades, which shows that institutions continue to have opportunities to communicate value and address the financial pain points of students to make higher education accessible and affordable.
Campus climate is key
One thing we have learned over the past thirty years is how students feel on campus is key to student success and retention. The research reflects the strongest links between students’ sense of belonging, feeling welcome, and enjoying their campus experience to their overall levels of satisfaction. High levels of satisfaction are linked to individual student retention and institutional graduation rates. Campuses that want to best influence students remaining enrolled are being intentional with efforts to show concern for students individually, building connections between students from day one, and continuing those activities as students progress each year. It is important for institutions to recognize that students have lots of options to receive a quality education, but the environment and the potential student “fit” is more likely to vary from location to location. What happens while a student is at the college they have selected is more impactful on them than which institution they ultimately chose. Creating welcoming environments and supporting students’ sense of belonging in the chosen college is a way for institutions to stand out and succeed in serving students. Colleges often ask, “Why do students leave?” when they could be asking, “Why do students stay?” Building positive campus cultures and expanding the “good stuff” being done for students is a way to critical way to improve student and institutional success.
One sector where the data reflect high satisfaction scores and good consistency, especially in the past five years since the pandemic, is community colleges. Students attending their (often local) two-year institutions want to be there, with high percentages of students indicating the school is their first choice. Community college students nationally indicate areas such as the campus staff being caring/helpful, students being made to feel welcome, and people on the campus respecting each other, as strengths (high importance and high satisfaction). These positive perceptions are also reflected with overall high levels of satisfaction and indications of a likelihood to re-enroll if the student had it to do over again. The data indicate that two-year institutions are doing a nice job of building a sense of community among primarily commuter student populations.
Systemic issues and pockets of improvement
Everyone talks about “kids today,” but in reality, they have been doing that for generations. It can’t be a reason not to change and respond appropriately to the needs of current students. When we consider the priorities for improvement in higher education that have remained at the forefront, we may need to recognize that some of these areas are systemic to higher education, along with recognizing that higher education generally has not done enough to respond. There are certainly pockets of improvement at schools that have prioritized being responsive and, as a result, are seeing positive movement in student satisfaction and student retention, but that is not happening everywhere. Taking action based on student feedback is a powerful way to influence student success. The campuses that have bought into that concept are seeing the results.
This year’s analysis takes a closer look at the national results by demographic subpopulations, primarily by class level, to get a clearer view on how to improve the student experience. Institutions have found that targeting initiatives for particular student populations can be an effective way to have the biggest impact on student satisfaction. Download your free copy today.
Earlier this year, I was interested to read RNL’s Generations of Online Learners report, which was produced by cross-tabbing our national survey of (largely) prospective online students by the three primary student generations. There has been greater awareness in recent years of the influence of generational differences in higher education, and this made me interested to explore the perceptions of students by age within our National Online Learners dataset.
These data reflect the responses to the RNL Priorities Survey for Online Learners (PSOL) over the past three academic years (fall 2021 through spring 2024), which now reflects a fully post-pandemic point of view. The total data represents 101,925 student records from 153 institutions. The PSOL asks students to indicate a level of importance and a level of satisfaction on a variety of experiences associated with their online study.
While the standard age categories used in the PSOL don’t exactly line up with the generational parameters, we can get close with these designations:
Age Indicator
Generational Designation
19-24
Gen Z
25-34
Millennial (One)
35-44
Millennial (Two)
45 -54
GenX
Tuition paid is a worthwhile investment
One of the high priority items on the PSOL is the perception of “Tuition paid is a worthwhile investment.”
Tuition paid is a worthwhile investment.
Gen Z
Millennial (One)
Millennial (Two)
Gen X
Importance*
86%
89%
91%
92%
Satisfaction**
62%
67%
71%
76%
*% of students who indicated the item was important/very important **% of students who indicated they were satisfied/very satisfied with this item
While this item is just 6 percent less important to Gen Z students than it is to Gen Xers, Gen Z students are 14 percent less satisfied than the Gen Xers. The older the student, the more likely they are to be satisfied with their tuition investment. What this says to online programs is you may need to more intentionally build the case for the investment of time and resources when you are recruiting and looking to retain Gen Z students (the primary “traditional age” student cohort) than you may need to be when recruiting (and seeking to retain) either Millennials or Gen X online students.
Items of less importance to Gen Z/more important to Gen X
Three other items stand out as being much less important to Gen Z students than they are to Gen X students:
This institution has a good reputation.
Factor to enroll: Reputation of the institution
Source of information: Catalog (online)
Each of these items saw at least 10 percent less importance among Gen Z online students when compared with Gen X.
This could be considered in the reverse: these items are actually more important to older students than they are younger students. If you are an online program that is specifically looking to recruit online learners who are older, you may want to emphasize your overall reputation and include reliable resources that speak to the quality of the education you are providing.
These Gen X ratings may be (at least in part) due to a lack of exposure that this generation had to online learning options when they were younger; they may need more evidence that online learning is an acceptable way to get a degree. In addition, older online students may be more accustomed to reviewing catalogs and expecting to see a complete catalog as an online resource as they are determining their program and direction for course work.
Conversely, the relative lack of concern that Gen Z students give to issues of reputation (likely as a placeholder for “quality” of the program) is likely an indicator of their comfort with the online modality – which for them does not represent something experimental or new. Particularly after the pandemic (and their exposure to online or remote learning) they may not have loved those experiences, but they did become quite comfortable with them.
Five areas where Gen Z students are much less satisfied than Gen X
There were a number of factors for which Gen Z online students indicated satisfaction levels which are 10 percent or more lower than among Gen X online students.
Faculty provide timely feedback about student progress.
Gen Z
Millennial (One)
Millennial (Two)
Gen X
Satisfaction*
66%
71%
73%
76%
*% of students who indicated they were satisfied/very satisfied with this item
The quality of instruction is excellent.
Gen Z
Millennial (One)
Millennial (Two)
Gen X
Satisfaction*
65%
70%
72%
76%
*% of students who indicated they were satisfied/very satisfied with this item
Adequate financial aid is available.
Gen Z
Millennial (One)
Millennial (Two)
Gen X
Satisfaction*
59%
66%
68%
70%
*% of students who indicated they were satisfied/very satisfied with this item
I receive timely information on the availability of financial aid.
Gen Z
Millennial (One)
Millennial (Two)
Gen X
Satisfaction*
64%
72%
74%
74%
*% of students who indicated they were satisfied/very satisfied with this item
This institution responds quickly when I request information.
Gen Z
Millennial (One)
Millennial (Two)
Gen X
Satisfaction*
68 %
76 %
78 %
80 %
*% of students who indicated they were satisfied/very satisfied with this item
These data make it clear that the youngest online students are clearly less satisfied with their experience than are older generations. Note that all respondents are in fully online programs and are not reflecting any of the “emergency remote learning” that occurred during the pandemic – a period that precedes the data collection window. Having said this, these younger students may be more ready to be critical of fully online learning due to possible pandemic-era remote learning experiences. Alternatively, their lifelong exposure to all things online may just make them have higher expectations of their online programs than older students. As we have documented elsewhere, their expectations may be informed by the many other highly personalized and speedy online interactions they have in other spheres of their lives.
The results reflected here provide an opportunity for online programs to consider the student populations they are targeting for recruitment purposes and how they can best retain them through to completion of the program – and thereby maximize their student success outcomes. Targeted initiatives and communication related to these priority areas for younger students may best serve institutions with achieving their goals, recognizing that students in different age groups have different perceptions and perspectives that they bring with them to the higher education experience.
Survey your students
The most relevant and useful data points that will maximize student success are always specific to each institution. For this reason, it is important that institutions (and in this case online programs) need to survey their own student population to identify areas of importance and satisfaction (and dissatisfaction). Once you have data for your own institution (or online program), you can isolate it by various demographics and then target your activities for subpopulations that may be less satisfied with their experience. The work you do to gather student feedback data, to explore it for insights and to use it to inform actions will have the greatest impact on student success.
The expectations of higher education faculty and staff have changed. Understanding the experiences, opinions, and satisfactions of your faculty and staff is invaluable to creating a healthy culture and work environment. But it’s not just about fostering a positive atmosphere—it’s also critical for retaining your employees, improving the student experience, and reducing the risk of lost institutional knowledge.
To help institutions better understand and support their faculty and staff, RNL is excited to introduce the refreshed College Employee Satisfaction Survey (CESS), designed with enhanced features to delve deeper into employee engagement and satisfaction at colleges and universities. Here are five reasons your institution should consider administering the updated CESS in 2024-2025.
1. Gain a comprehensive view of your employee experience
The updated CESS measures key aspects of faculty and staff morale, including workplace recommendations, overall job satisfaction, and retention rates. With this data, you’ll have a clear picture of your university’s workplace culture, helping you make meaningful improvements driven by faculty and staff input.
2. Identify what matters most to your team
The refreshed CESS explores key aspects of the employee experience including internal communication, prioritization of institutional goals, work-life balance, and satisfaction with compensation. Your employees also highlight institutional strengths and opportunities for improvement, giving you direct feedback on what they value most.
3. Benefit from detailed, actionable reports
With your participation in the CESS, you’ll receive comprehensive reports, including faculty and staff segment analyses, the raw survey data, and the RNL CESS Benchmark National Norms report.* This information empowers you to take targeted action to boost employee morale.
4. Support accreditation and strategic planning
Survey results from the CESS can be a powerful asset in accreditation and strategic planning processes. Demonstrating a commitment to understanding the employee experience helps to demonstrate compliance with key standards and conveys that your institution is proactive about maintaining a thriving educational environment.
5. Take advantage of special pricing and longitudinal analysis
To celebrate the launch of the refreshed survey, RNL is offering a 25% discount on standard administration fees for surveys conducted in 2025. Moreover, institutions engaging in the CESS more than once within a five-year span will receive a complimentary longitudinal comparison report. This report is invaluable for tracking changes and trends over time, providing a deeper understanding of the long-term impact of implemented policies and changes.
The refreshed College Employee Satisfaction Survey from RNL is more than just a survey; it’s a comprehensive tool that empowers higher education institutions to thrive by fostering a healthy campus culture and satisfying work environment. By participating in the CESS, your institution can gain critical insights, enhance strategic planning, and ultimately, elevate the overall campus culture.
*Benchmark reports will be sent to participating institutions once seven institutions of their type like 4-year publics, 2-year publics, or 4-year private conduct the 2024 CESS.
Here is the Job Satisfaction Questionnaire for mba project to give you an idea how to frame your project questionnaire for data analysis and help you to get top grade in your project. You must remember that the questions you are choosing should be unique and should fulfil the objective of the project. The goal should be to find the solution of the problem you are trying to solve.
Questionnaire
Please share the following details:
NAME: ………………………………………….
DESIGNATION: ……………………………….
COMPANY: …………………………………….
I am often stressed out at work.
I you’ve been passed over for promotions multiple times in last two years.
I spend parts of my daydreaming about a superior job.
I find much of my job repetitive and boring.
I am Mentally and emotionally exhausted at the end of a day at work.
I feel that my job has little impact on the achievement of the company.
I have an increasingly awful attitude toward my job, supervisor, and managers .
I am no longer given the working environments I need to successfully do my job.
I am not being used to my full potential of my skills.
I have received no better than unbiased evaluation and impartial evaluations recently.
I feel as though my boss and colleagues have let me down at office time.
I often feel sense of anxiety at workplace.
I live for weekends away from the job.
I find myself negatively comparing my situation to my peers.
I feel my bad days at work outweigh the good ones.
I often experience a sensation of time standing still when I am at work.
I have been told that I am becoming a more cynical person.
I feel as though my company have broken trust and commitment about my future with the workplace.
I have lost my career goals.
I no longer feel appreciated for my work.
Tick the Answer
Strongly Agree
Agree
Neither Agree nor Disagree
Disagree
Strongly Disagree
Conclusion
Here in this content I have tried to solve all the Job Satisfaction Questionnaire For Mba Project related query which student need to prepare for mba project in hr. These are all close end questionnaire which you can prepare the data analysis using statistical tool and find the outcome of the report based on the report. If you need more in-depth Questionnaire feel free to get in touch with our academic writing team to help you prepare your Job Satisfaction Questionnaire as per university guidelines.
Questionnaire to measure job pleasure,u00a0 work atmosphere, remuneration, and personal fulfillment.”}},{“@type”:”Question”,”name”:”What are the 5 keys to job satisfaction?”,”acceptedAnswer”:{“@type”:”Answer”,”text”:”
Respect , Job Security, Recognition, Engagement, Pay and benefits”}},{“@type”:”Question”,”name”:”What are the 5 keys to job satisfaction?”,”acceptedAnswer”:{“@type”:”Answer”,”text”:”
Today’s Genz looks for Respect, Job Security, Recognition, Engagement, Pay and benefits in companies”}},{“@type”:”Question”,”name”:”What is the purpose of job satisfaction survey?”,”acceptedAnswer”:{“@type”:”Answer”,”text”:”
It’s au00a0 Smart Tool that finds employees opinions and experiences in workplace and happiness index.”}}]}