The City Council now requires New York City’s Education Department to report data on school librarians and library access.
The first-ever report of public school library data was released last month, and revealed that across 1,614 public schools, 1,016 have a library. Yet, there were only 273 full-time librarians and 12 part-time librarians.
Research has shown access to school libraries with certified librarians tends to result in better academic performance and higher graduation rates at those schools. One study showed that a loss of librarians is associated with lower reading scores.
City Council passed school librarians data law after years of advocacy from parents and librarians who warned of a drastic loss in librarians across the city. In 2023, Chalkbeat analyzed school budget item lines to find that nearly a third of schools with more than 700 students did not have a librarian listed in their budget, even though state standards require all secondary schools with more than 700 students to have a full-time certified librarian.
This year’s data paints a similarly dire picture, and advocates have concerns about both what the data reveals and the accuracy of the data itself. For one, they are critical of the method the Education Department used to report on the number of schools that have libraries. Also, having a library space without a librarian remains a concern.
“Even if all the numbers are accurate, it still … paints a picture that there’s still so much work that needs to be done,” said Roy Rosewood, a school librarian in Queens who’s been advocating for librarians since 2013.
Rosewood and other advocates are concerned that the Education Department used a school’s operating hours as a proxy for the school’s library hours, according to the data. Advocates and librarians told Chalkbeat that this is not a reliable measurement of a library’s open hours, since libraries can often be shut down for testing, meetings, or other purposes.
“Last year, the library was pretty much closed all of April and May for testing,” said one librarian who is untenured and spoke on the condition of anonymity for fear of retaliation. “A lot of times when they shut down the libraries for testing, they don’t even put the librarian to proctor those tests. So we’re not even in the space that is closed down.”
For those two months, she spent most of her time in the teachers’ cafeteria and periodically, she walked around the school with a cart of books for students to check in or out.
Advocates also pointed out the importance of having a librarian, not just a library.
“A physical space means nothing,” said Jenny Fox, a New York City public school parent and founder of Librarians = Literacy, an advocacy group focused on raising awareness about the city’s library desert. Fox said she spends a lot of time educating people on what librarians do, something that is often misunderstood or overlooked.
“They’re not just checking books in and out. They’re teaching your kids about media literacy, safety online, how to vet an article for truthfulness,” Fox said. Librarians build their own curriculum, help students with research skills, and are one of the only people in the school who interact with every child.
An Education Department spokesperson said the department recognizes that school libraries are “essential,” and noted, “There’s still room to grow, and we will continue expanding these numbers to bring more knowledge, books, and a culture of reading to more students.”
On his fourth day as New York City schools chancellor, Kamar Samuels visited a Brooklyn school, and parents and educators pressed him about the lack of librarians. He agreed that school libraries were “critical,” saying when schools in the districts he worked in got libraries put into their buildings, “you could see the difference in the culture that changes.”
Parts of the City Council’s school library law have yet to be implemented. State law states that students in seventh and eight grades are required to receive at least one period of library and information instruction per week. Only about 20% of K-8 schools and junior high schools have a full-time librarian, according to a data analysis from Librarians = Literacy, suggesting the law’s requirements aren’t being met. The anonymous librarian said she is only teaching four library classes, but there are about 60 classes of seventh and eighth graders at her school.
The data on the number of students in those grades who receive library instruction is set to be released on June 1. Next year’s data will also include information such as the number of non-licensed school librarians that are assigned to help fill the librarian gap, the number of hours per day licensed librarians are assigned to do school library work, and more.
Chalkbeat is a nonprofit news site covering educational change in public schools. This story was originally published by Chalkbeat. Sign up for their newsletters at ckbe.at/newsletters.
Did you use this article in your work?
We’d love to hear how The 74’s reporting is helping educators, researchers, and policymakers. Tell us how
Search behavior in higher education is changing fast. With Google’s Search Generative Experience (SGE), prospective students and parents are no longer just scanning lists of links; they’re receiving direct, AI-generated answers at the top of the page. These summaries pull from multiple sources to deliver concise, conversational responses to complex questions about programs, costs, outcomes, and campus life.
For schools, the implication is clear: your content must be structured, authoritative, and context-rich to be surfaced by AI. If it isn’t, your institution may be invisible, regardless of how strong your traditional SEO once was.
This article explores Google SGE in education, explains what Google SGE means for higher education marketing, and how schools can adapt. We’ll cover why AI search matters, how generative AI changes content discovery, and the practical steps institutions can take, from content optimization to local SEO and reputation management, to remain visible in this new search landscape.
Need help refining your school search optimization strategy?
Discover how our specialized services can help you connect with and enroll more students.
What Is Google’s AI Search (SGE) and Why Does It Matter for Schools?
Google’s Search Generative Experience, now commonly surfaced as AI Overviews, represents a major shift in how search results are delivered. Instead of presenting users with a list of links, Google increasingly provides synthesized, AI-generated answers that pull information from multiple sources and present it as a concise, conversational summary.
Google SGE in education functions like an advanced featured snippet. For example, when a parent searches “best engineering programs in Ontario,” Google’s AI may generate a short comparison of several institutions, highlighting locations, strengths, and differentiators without requiring the user to click through to individual websites. This fundamentally changes how prospective students and families discover schools.
For institutions, the stakes are high. AI Overviews often answer questions about programs, admissions, outcomes, and comparisons directly in the search results. If your school is not referenced in that response, you may miss visibility at an important early decision-making moment. Visibility in AI-generated answers is quickly becoming as important as first-page rankings once were in traditional SEO.
There is also an opportunity. Early third-party studies suggest that Google’s AI Overviews may cite content beyond the top organic rankings, particularly when pages clearly and directly answer a user’s question. Well-structured, authoritative content that clearly answers a specific question can be surfaced even if it does not rank first in classic search. This creates room for smaller or lesser-known institutions to compete based on content quality and relevance rather than brand dominance alone.
SGE also changes user behavior. Search becomes conversational, with follow-up questions that refine intent and narrow comparisons. Schools must be prepared to show up for detailed, context-driven queries, supported by accurate content and complete institutional data across Google platforms.
Google’s AI search prioritizes clarity, authority, and usefulness. Schools that adapt to this shift gain visibility at critical moments. Those who do not risk being bypassed entirely.
How Can My School Improve Its Visibility in AI-Powered Search?
Achieving visibility in AI-driven search results requires a blend of traditional SEO best practices and newer approaches often referred to as Generative Engine Optimization. This means maintaining a strong SEO foundation so Google understands and trusts your site, while also optimizing your content and digital presence for how AI retrieves, synthesizes, and presents information.
Below are the key strategies schools should focus on to improve their chances of being featured in AI-powered search results.
1. Maintain a Strong SEO Foundation
First and foremost, SEO is not dead. It is the foundation on which AI search visibility is built. Google’s AI Overviews continue to rely on reliable, well-structured, and authoritative content, often drawing from pages that already follow SEO best practices.
Google has made it clear that content aligned with its established guidelines, including experience, expertise, authoritativeness, and trustworthiness, performs well in AI-driven results. Schools should continue to invest in core SEO fundamentals, including the following.
Keyword Optimization and Metadata Use clear, relevant keywords in page titles, headings, and meta descriptions so both traditional search algorithms and AI systems can quickly understand your content. A program page titled “MBA Program in Data Analytics | XYZ University” clearly communicates relevance and improves discoverability.
Logical Site Structure Organize your site navigation and URLs logically so search engines can easily crawl and contextualize content. A clean hierarchy helps AI retrieve specific details such as tuition, admissions requirements, or program outcomes by following your site’s structure.
Mobile-Friendly, Fast-Loading Pages Most prospective students search on mobile devices. Google prioritizes mobile usability and fast load times regardless of AI. A strong user experience encourages engagement and signals content quality to Google’s systems.
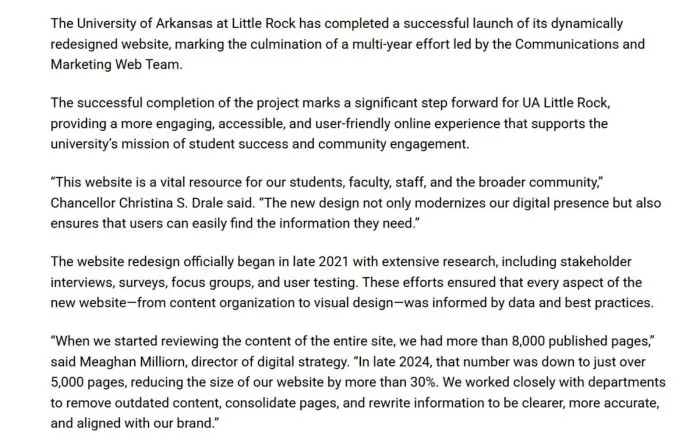
Example: University of Arkansas at Little Rock (UA Little Rock): Launched a redesigned website in 2025 that prioritized technical SEO fundamentals. The web team conducted a full content audit to streamline site architecture, consolidating and rewriting content for clarity and removing outdated information to improve crawlability and usability. This resulted in a leaner, more crawlable site aligned with best practices.
Quality Content and User Engagement Continue publishing in-depth, high-quality content. This attracts backlinks, increases time on site, and positions your pages as authoritative sources that AI systems are more likely to reference.
Think of traditional SEO as the bedrock. If your site is not technically sound and rich in valuable content, AI-focused tactics will not compensate. A strong foundation amplifies everything that follows.
2. Create High-Quality, AI-Friendly Content (Answer the Questions)
With the basics in place, the next step is tailoring content for conversational, answer-focused search behavior. AI-powered search excels at interpreting natural-language questions, especially longer and more specific queries.
To improve visibility, your content should directly address the questions prospective students and parents are asking, using clear structure and plain language.
Incorporate Long-Tail, Question-Based Keywords Shift part of your keyword strategy toward detailed, conversational queries. Instead of focusing only on broad terms like “MBA Canada,” develop content around questions such as “best MBA programs in Canada for working professionals” or “how to get a scholarship for an MBA.” AI systems are more likely to surface content that closely matches how users phrase their questions.
Use Q&A and FAQ Formats Question-and-answer formats are particularly effective for AI extraction. Admissions, financial aid, and program pages benefit from clearly labeled questions followed by concise, factual answers. This structure improves usability for readers and makes it easier for AI to identify relevant information.
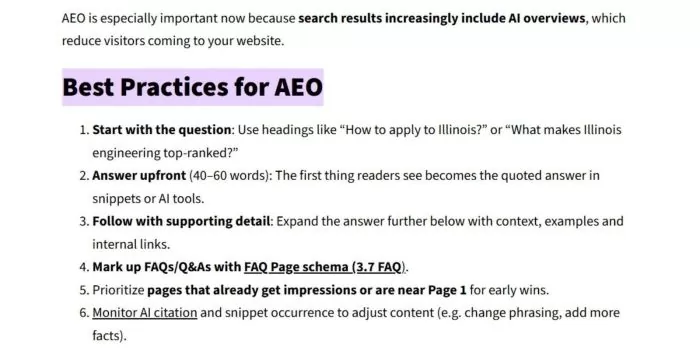
Example: University of Illinois Urbana-Champaign: Incorporates “Answer Engine Optimization (AEO)” into its content guidelines for web writers. The University’s brand training recommends structuring content in a Q&A format: start with a question in a heading (e.g. *“How do I apply to Illinois?”), Immediately answer it in a brief, concise paragraph before expanding with additional detail. This approach, coupled with applying FAQ schema markup, is designed to make Illinois’s content the direct answer in featured snippets or AI summary boxes. By focusing on full questions and concise answers, Illinois ensures its high-value content is AI-friendly and voice-search ready.
Emphasize Authoritative, In-Depth Content AI systems favor content that demonstrates expertise and depth. Schools can leverage faculty insight, research, and real-world outcomes to establish authority. Long-form guides, career pathway articles, and program explainers grounded in institutional expertise are strong candidates for AI-generated answers.
Structured Headings and Clear Writing Organize content using descriptive headings and subheadings. Avoid burying key information in long paragraphs. Specific headings aligned with search intent help AI match your content to relevant queries. Lists and step-by-step explanations are especially useful, as AI often presents answers in list form.
Evergreen Content and Regular Updates Keep content current. Evergreen content still requires periodic updates to remain accurate and competitive. AI systems favor up-to-date information, particularly for admissions policies, program offerings, and career outcomes.
By focusing on high-quality, question-oriented content, schools make it easier for AI to identify, trust, and reuse their information.
3. Leverage Local SEO and Google Business Profiles
For institutions with physical campuses, local SEO is a critical component of AI visibility. Many education-related searches carry local intent, and Google’s AI frequently integrates local data into its answers.
Claim and Optimize Your Google Business Profile Ensure your Google Business Profile is claimed, complete, and accurate. Fill out all fields, including locations, contact information, categories, and descriptions. This data is often pulled directly into AI-generated results.
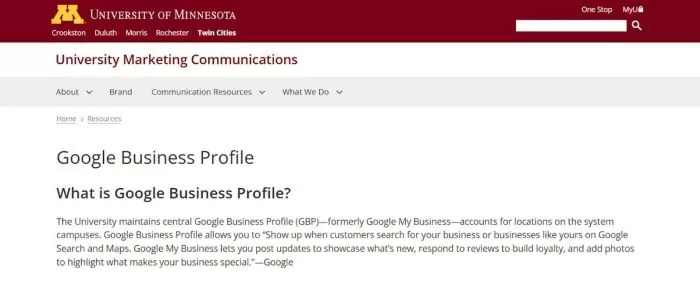
Example: University of Minnesota: Manages a centralized Google Business Profile (GBP) for its campuses to maximize local search visibility. The University’s marketing team keeps each campus’s GBP listing complete and up-to-date with addresses, hours, phone numbers, and descriptive text. They also utilize GBP features like posts and photos to highlight campus events and attributes. Following Google’s best practices, Minnesota fills out “as much location information as possible,” keeps listings current (e.g., holiday hours), and uses relevant keywords in descriptions and local posts to improve local search ranking. This ensures the University’s locations appear prominently on Google Search/Maps for relevant queries.
Keep Photos and Media Up to Date AI-generated listings frequently include logos and photos. Upload high-quality, current images of your campus, facilities, and branding. Visuals influence perception and can strengthen your presence in AI results.
Incorporate Local Keywords on Your Site Mention your city, region, and community naturally within site content. Blog posts, news updates, and program pages that reference local partnerships or opportunities help AI associate your institution with specific locations.
Maintain Consistent Local Citations Ensure your institution’s name, address, and phone number are consistent across directories, education portals, and social platforms. Consistency reinforces credibility for AI systems aggregating information.
Use Google Business Features Strategically Google Posts, Q&A sections, and program listings provide additional structured data that AI can reference. Schools that actively manage these features offer clearer signals to Google’s systems.
Strong local SEO increases the likelihood that your institution appears in AI-generated responses to geographically relevant searches.
4. Embrace Online Reviews and Social Proof
Why are online reviews important for AI search results? Online reviews provide fresh, user-generated content that signals credibility and relevance to AI systems. Positive, detailed reviews can help your institution appear in AI-generated answers by reinforcing trust, boosting visibility, and enriching the data AI uses to evaluate and summarize schools in search results.
Online reviews now influence both human decision-making and AI-generated search results. Google’s AI Overviews often incorporate ratings and review themes directly into responses.
Maintain Strong Ratings In competitive searches, AI systems tend to highlight institutions with strong review profiles, as ratings and review sentiment are commonly incorporated into AI-generated summaries. Strong ratings are increasingly a prerequisite for visibility, not just a reputation metric.
Monitor Review Content AI systems analyze recurring themes within reviews. Frequently mentioned strengths or concerns can appear in AI-generated summaries. Active monitoring helps ensure accuracy and context.
Encourage Positive Reviews Develop a structured approach to requesting reviews from satisfied students, alumni, and parents. Reviews that mention specific programs, facilities, or experiences provide richer signals for AI.
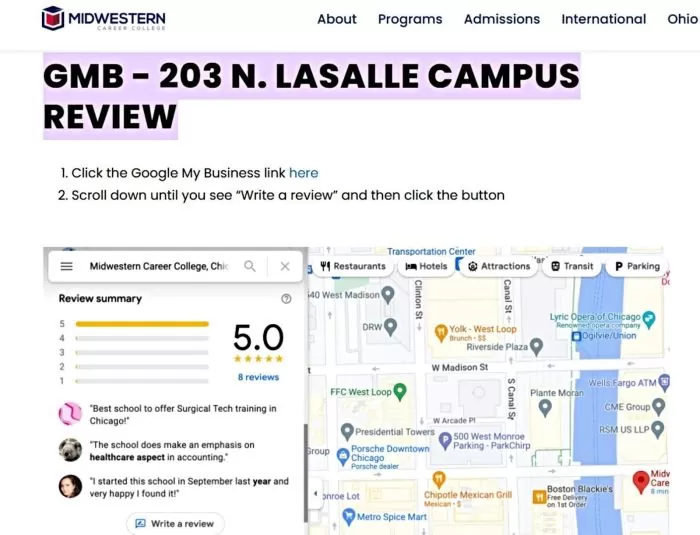
Example: Midwestern Career College: Encourages its community to engage on Google’s review platform for each campus location. On its official website, MCC provides step-by-step instructions for students to leave a Google review – from clicking the campus’s Google My Business link to hitting the “Write a review” button. This call-to-action shows MCC actively seeks public feedback. By driving satisfied students to post reviews, the college strengthens its online reputation and local search rankings. The steady flow of positive Google reviews serves as social proof to prospective students scanning the web for authentic feedback.
Diversify Review Sources While Google reviews are most influential, other education-focused platforms and social feedback also contribute to the broader information ecosystem AI systems draw from.
Showcase Testimonials on Your Site Highlight authentic testimonials and success stories on your website. When properly structured, these can reinforce credibility for both users and AI-driven search systems.
Online reviews have become direct inputs into how AI describes institutions. Active review management strengthens both reputation and search visibility.
AI-powered search rewards clarity, authority, and usefulness. Schools that invest in strong SEO foundations, question-driven content, local optimization, and reputation management are far more likely to appear when prospective students turn to AI for answers.
In an AI-first search environment, visibility belongs to institutions that make it easy for both people and machines to understand their value.
5. Optimize Visual and Multimedia Content
AI search results are no longer limited to text. They increasingly include images and videos to help users evaluate options more quickly. A search about campus life may trigger a photo carousel, while a branded university query could surface a campus tour video alongside the AI-generated answer. If your visual assets are weak, outdated, or poorly optimized, you risk losing attention even when your institution is referenced.
To compete effectively, schools must treat multimedia as a core part of search optimization, not a design afterthought.
Image Optimization Images should be handled with the same rigor as written content. Start by using descriptive file names that clearly indicate what the image represents. Replace default camera names with specific, readable names such as school-name-library.jpg or university-science-lab.jpg.
Alt text is equally important. It should accurately describe the image in plain language and, where appropriate, align with the page topic. For example, an image of a new facility might use alt text such as “State-of-the-art science lab at [School Name].” Avoid keyword stuffing or vague descriptions.
Page performance matters. Large, uncompressed images slow load times, which negatively affects SEO and user experience. Since AI systems often surface images closely tied to page content, it is also important to place your strongest visuals on pages where the surrounding text is directly relevant. If a user asks what your campus looks like, Google can only surface your images if they are indexable, contextualized, and optimized.
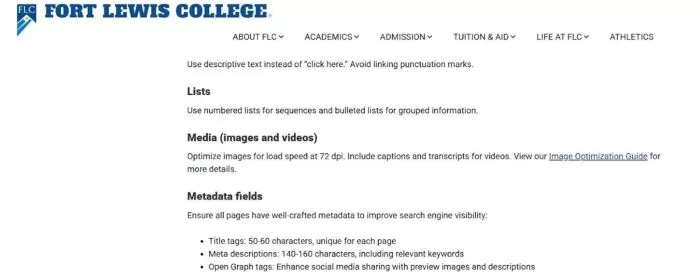
Example: Fort Lewis College: Ensures that images and videos on its site are optimized for both user experience and search visibility. Fort Lewis’s Web Style Guide instructs editors to compress and properly size images for fast loading, and to always include descriptive alt text for accessibility and SEO. For multimedia content, the college provides captions or transcripts for videos, knowing that search engines (and users) can’t index what isn’t in text form. By adding text transcripts to videos and alt tags to images (with relevant keywords where appropriate), Fort Lewis makes its visual content discoverable by AI and voice search tools while also improving page load times.
Infographics and Charts Custom graphics can strengthen authority, especially when they communicate outcomes, rankings, or program pathways. When using infographics or charts, include them on relevant pages with concise captions that explain what the visual shows. Captions help users and clarify context for search systems.
Do not place critical information exclusively inside images. If a chart highlights graduate employment rates or admissions statistics, repeat the key points in HTML text. This improves accessibility and ensures AI systems can accurately interpret and reference the information.
Video Content (YouTube and Beyond) Video is often the first impression prospective students have of an institution. Google regularly surfaces YouTube videos in search results, including AI-enhanced answers. A query like “tour of [School Name] campus” may show a playable video immediately, making video optimization essential.
Focus on video content that addresses high-intent questions, such as campus tours, residence life walkthroughs, student testimonials, program overviews, and admissions explainers. Titles and descriptions should be clear, descriptive, and aligned with how users search. For example, “Campus Tour | [School Name] | Student Life and Facilities” is more effective than a generic welcome video title.
On your website, embed key videos on relevant pages and include a transcript or written summary. Video alone provides limited context for AI. Supporting text gives search systems content they can analyze and reference. Engagement signals also matter. Videos with strong watch time and interaction are more likely to surface in search results.
Schema for Videos and Images Use schema markup where appropriate, particularly VideoObject schema for important videos. Structured data helps search engines understand what a video contains, its duration, and its purpose. While schema does not guarantee AI inclusion, it improves clarity and future-proofs your content as search becomes more structured.
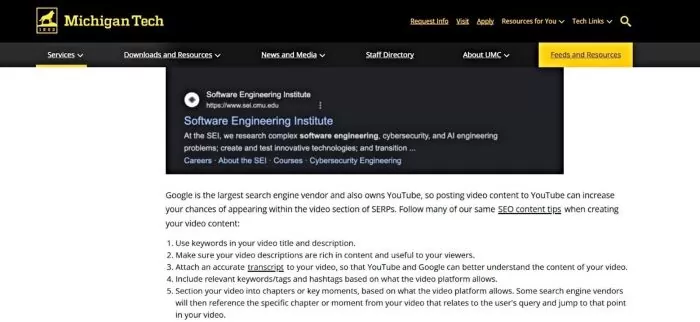
Example: Michigan Technological University: Integrates video SEO into its content strategy to capitalize on the popularity of video content. Michigan Tech advises its departments to treat video content like web text content for optimization: use keyword-rich titles and descriptions on YouTube, and crucially, attach accurate transcripts or captions to each video. Providing a transcript allows Google and other AI-driven search engines to “understand” the video’s content.
Michigan Tech emphasizes the importance of captions and transcripts so search engines can understand video content. More broadly, platforms like Google and YouTube use metadata such as titles, descriptions, and timestamps to better interpret video relevance in search results.These practices ensure the university’s lectures, tutorials, and marketing videos are accessible to search engines and can surface in voice or AI search responses.
Speakable Content and Voice Search As AI search integrates more closely with voice assistants, content clarity becomes even more important. While Speakable schema is not widely used in education yet, schools should focus on writing concise, well-structured answers to common questions. Clear summaries on admissions, tuition, and programs prepare your content for both visual and voice-based search experiences.
Multimedia optimization improves both visibility and perception. Strong images and videos help schools appear in AI results and stand out once they do.
6. Use Structured Data and Clean Site Architecture
Structured data and clean site architecture significantly improve how accessible your content is to AI systems. Generative AI for colleges relies on context, and schema markup provides that context explicitly. A logical site structure ensures important information is easy to find and understand.
Education-Specific Schema Schools should implement schema types relevant to higher education. EducationalOrganization schema supports institutional information. Course schema describes programs and credentials. FAQPage schema is ideal for admissions and financial aid questions, while Event schema works well for open houses and webinars. When the schema aligns with visible page content, it increases Google’s confidence in surfacing that information.
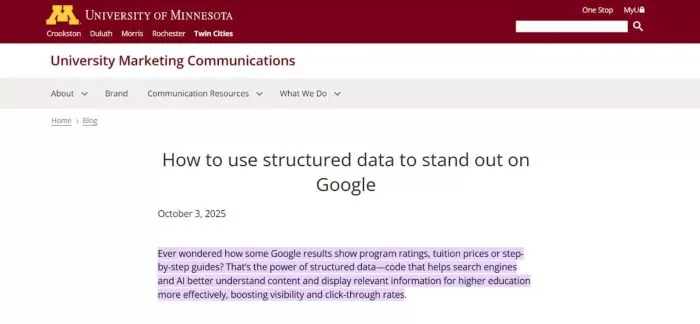
Example: University of Minnesota: Embraces structured data to enhance how its content appears in AI-powered results. In October 2025, U of M’s marketing tech team rolled out new schema features across its Drupal web platform to better label content for search engines. Their official guide explains “that’s the power of structured data” – snippets of code that help search engines and AI understand page details like program offerings, alumni, FAQs, etc., leading to rich search results. Minnesota’s web environment includes a Schema.org metatag module, and they continually update it (e.g., adding support for alternate organization names and parent organizations in 2025) so that university webpages can output a comprehensive JSON-LD schema. This clean, machine-readable markup boosts the visibility of U of M content in rich results and AI summaries.
FAQ and Q&A Schema The FAQPage schema is especially valuable for AI-powered search. It clearly signals which text answers specific questions. If a prospective student asks about tuition or application deadlines, schema-marked answers increase the likelihood that AI systems pull accurate snippets directly from your site.
Clean URLs and Logical Hierarchy Your site structure should be intuitive and reflected in URLs. Paths like /academics/programs/computer-science help both users and crawlers understand content relationships. Important pages should not be buried or scattered across PDFs without internal links. AI systems are more likely to surface well-organized pages than fragmented information.
Internal Linking Use internal links to connect related content using descriptive anchor text. Admissions pages should link to financial aid details. Program pages should link to career outcomes or internship information. Internal linking helps AI systems follow context across your site and identify authoritative pages.
Technical Hygiene Keep sitemaps updated, fix broken links, and ensure key pages are indexed. Avoid blocking important content with noindex tags or robots.txt. Do not rely solely on PDFs or images to communicate essential information. Always provide HTML text summaries for critical details.
Data Accuracy and Consistency Structured data must match on-page content exactly. Inconsistent tuition figures, dates, or requirements can confuse AI systems and undermine trust. Centralizing frequently updated information reduces errors and improves reliability.
Clean structure and accurate schema make your site easier for AI to understand and more likely to be referenced correctly.
7. Stay Current and Adapt
The final requirement for AI-era visibility is continuous adaptation. AI-powered search is evolving quickly, and static strategies will fall behind.
Monitor Performance Track impressions, click-through rates, and query patterns. Declining clicks may indicate users are getting answers directly from AI results. Identify affected pages and strengthen their value or clarity.
Use AI Evaluation Tools Emerging tools can highlight gaps, such as missing schema or slow performance. While imperfect, they can help prioritize improvements.
Keep Content Updated Refresh pages when programs, policies, or deadlines change. Update older content with current data and examples. AI systems favor recent, accurate information, especially for admissions and cost-related queries.
Watch Industry Trends Follow credible SEO and higher education marketing sources to understand how AI search is evolving. Use early signals to adjust content strategy before visibility declines.
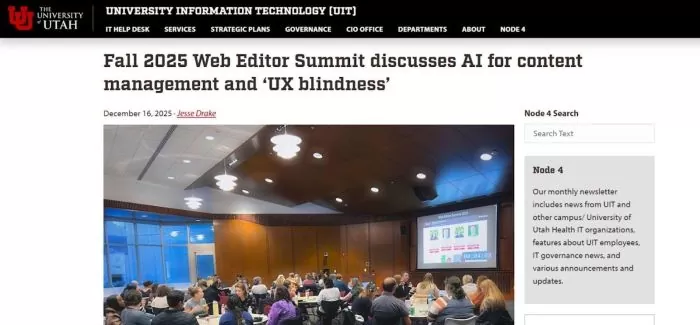
Example: University of Utah: Stays on the cutting edge by rapidly adapting to emerging search technologies and educating its staff. In late 2025, Utah’s Web Support & Usability team hosted a campus Web Editor Summit focused on the latest SEO and AI trends. They urged content editors to adjust strategies for AI-driven search, for example, by optimizing site content even if certain pages are blocked from traditional indexing (since AI models might analyze them regardless). Utah is even preparing for the next wave of AI by securing an enterprise ChatGPT license to integrate advanced AI into its services. By proactively training web editors on tools like custom GPTs and emphasizing new ranking factors, the University of Utah shows a commitment to continuous learning and quick adaptation in the AI era.
Balance Optimization With Human Experience AI visibility is only the first step. When users click through, your site must guide them clearly toward next actions. Strong user experience, clear calls to action, and authentic messaging remain essential.
Schools that combine technical discipline with ongoing refinement will remain visible as search continues to evolve. Continuous improvement is the most reliable long-term strategy in an AI-driven search environment.
Preparing Your School for AI-Driven Search
AI-powered search is fundamentally changing how prospective students discover, evaluate, and compare institutions. Visibility is no longer determined solely by blue-link rankings but by how clearly and credibly a school’s information can be understood and reused by AI systems. To remain competitive, schools must move beyond isolated SEO tactics and adopt a more holistic approach to search visibility.
This means maintaining strong technical SEO foundations, publishing content that directly answers real student questions, and ensuring visual, video, and structured data assets are optimized and accessible. Clean site architecture, accurate information, and consistent updates all play a role in whether an institution is surfaced or overlooked in AI-generated results. Just as important is a commitment to ongoing adaptation. AI search will continue to evolve, and schools that monitor performance, refine content, and prioritize the student experience will be best positioned to earn trust, attention, and engagement.
Need help refining your school search optimization strategy?
Discover how our specialized services can help you connect with and enroll more students.
FAQs
Question:What is Google’s AI Search (SGE) and why does it matter for schools?
Answer: Google’s Search Generative Experience, now commonly surfaced as AI Overviews, represents a major shift in how search results are delivered. Instead of presenting users with a list of links, Google increasingly provides synthesized, AI-generated answers that pull information from multiple sources and present it as a concise, conversational summary.
Question: How can my school improve its visibility in AI-powered search?
Answer: Achieving visibility in AI-driven search results requires a blend of traditional SEO best practices and newer approaches often referred to as Generative Engine Optimization. This means maintaining a strong SEO foundation so Google understands and trusts your site, while also optimizing your content and digital presence for how AI retrieves, synthesizes, and presents information.
Question: Why are online reviews important for AI search results?
Answer: Online reviews provide fresh, user-generated content that signals credibility and relevance to AI systems. Positive, detailed reviews can help your institution appear in AI-generated answers by reinforcing trust, boosting visibility, and enriching the data AI uses to evaluate and summarize schools in search results.
The months since Charlie Kirk’s murder on Utah Valley University’s campus in September have seen a deluge of firings and suspensions of teachers, faculty, and staff across the country for celebrating the assassination, or just for being insufficiently mournful. As the dust settles and court cases proceed, more details are emerging about the political pressures universities faced to punish protected political expression.
In Iowa, lawmakers were so incensed by one Iowa State University staff member’s speech about the shooting that they outright dismissed the possibility of a lawsuit. Public records obtained by FIRE through a Freedom of Information Act request show state lawmakers exchanging messages inviting the possibility of First Amendment lawsuits for the sake of punishing speech they found offensive. “It’s worth the risk of lawsuits,” one lawmaker texted.
In other words, censorship is worth lawsuits. Iowa taxpayers: that’s your free speech rights — and your money — they’re putting at risk.
On Sept. 23, less than two weeks after the shooting, Iowa State University fired Caitlyn Spencer, a financial aid advisor at the university. Spencer had posted that she believed Kirk “got what was coming” to him and wrote that she was “happy he’s rotting in hell now.” The prominent X account Libs of TikTok picked up Spencer’s post, prompting social media outrage.
That outrage did not stay confined to the internet. Behind the scenes, Iowa lawmakers urged university officials to take action. The records obtained by FIRE show text messages from state lawmakers to Board of Regents State Relations Officer Jillian Carlson. State Rep. Carter Nordman sent Carlson a screenshot of Spencer’s post, asking, “Will she be put on leave today?” Rep. Taylor Collins added that Spencer “better be” put on leave.
After Carlson responded that the university was investigating all complaints they were receiving about social media activity, Collins responded, “There’s no way this is allowed under the Univeristy [sic] code of conduct.” He added: “It is worth the risk of lawsuits.”
Nordman then expressed frustration at a potential lawsuit, writing, “I am so sick of us scurrying around a law suit. Let them sue.” He added that he and two other individuals were “just fine with [Carlson] telling [ISU] President Wintersteen that’s coming from the House Higher Ed & Budget Chairman’s [sic].”
It’s bad enough that lawmakers publicly called for punishment of faculty and staff for their speech about Kirk, including Collins, who was both publicly pushing punishments and sending messages behind the scenes. But Nordman’s mention of the Iowa House Higher Education Committee invoked the power of the committee that controls the funding ISU receives, unsubtly implying that lawmakers were ready to cut budgets if administrators did not comply with their demands to punish speech. And given their talk about lawsuits, it’s clear that they had doubts about whether punishing the speech would violate the First Amendment.
FIRE has seen this sort of attitude before. For example, when FIRE was poised to file a lawsuit against Kirkwood Community College in 2020 after it moved to terminate a professor for describing himself as “Antifa,” Kirkwood president Lori Sundberg told a media outlet there was “no evidence” the professor had espoused his controversial views in the classroom. The president remarked, “at the end of the day for me, if I’m found legally wrong on this, I can live with that.”
The college eventually settled with the professor for $25,000. Similarly, in 2013, a federal jury held the former president of a public college in Georgia personally liable for violating the rights of a student who protested against the building of two parking garages on campus. There, the student and the university reached a $900,000 settlement after a lengthy court battle, as the court ruled that the president had ignored the student’s “clearly established constitutional right to notice and a hearing before being removed from VSU.”
Those fired over protected comments about Kirk’s assassination could be looking at similar payouts, courtesy of the tax- and tuition-payers of Iowa.
While Kirk’s murder has divided Americans across the board, one thing should unite them all: Iowans — and Americans more broadly — shouldn’t be on the hook for public officials’ decisions to ignore the First Amendment.
Around the world, Queer rights are being challenged, attacked and denied. Governments are cutting budgets for important health and other programmes.
But in parts of Africa, there are distinct signs of progress. Organizations that serve and advocate for Queer communities in Eastern Africa now see hope for the future. That’s the case even in Uganda where “aggravated homosexuality” has carried the death penalty since 2023.
“It is still a very hard environment but we are doing much better than a lot of people think,” said Brian Aliganyira, founder and executive director of the Ark Wellness Hub, an organization based in Kampala, Uganda, that helps LGBT community members who have difficulty accessing health services in public hospitals due to both anti-Queer laws and ongoing community stigma and discrimination.
“We are doing better in terms of fighting back and supporting communities, not necessarily better in terms of protection, rights and freedoms,” Aliganyira said.
In Kenya, homosexual acts are illegal. Rodney Otieno, who is the co-founder and policy director for the Queer & Allied Chamber of Commerce Africa of Nairobi (QACC), described the creation of a “Queer ecosystem” that mobilises resources, builds social enterprises, creates sustainable economic pathways for people of the Queer community and attracts impact investments – using money for good causes even as it generates wealth. The QACC now boasts over 3,000 members in Kenya, plus others across Africa.
Language and discrimination
Otieno and the four other East African community leaders interviewed for this article generally prefer to use the more fluid term “Queer” rather than “LGBTQ” or any of its many variations.
Kevin Ngabo, a Queer activist and social justice advocate, said that local languages often lack positive or even neutral words to describe queer identities — only stigmatizing ones.
“‘Queer’ gives us an umbrella that feels both flexible and affirming, allowing people to belong without being boxed in by rigid categories,” Ngabo said. “It’s a way of saying: I am different and that difference is valid.”,
Ngabo was born and raised in Rwanda before moving to Nairobi, Kenya late last year.
In Rwanda, there are no anti-discrimination laws but the government does not recognize same-sex marriages.
Pride in one’s identity
A Queer rights activist in Kigali, who asked not to be identified, said that young people are feeling more comfortable with their identities. “GenZers are taking up more space as their authentic selves,” the activist said. “They are even getting more understanding and affection from their families. It is not ‘weird’ anymore. This will become the norm.”
The Kigali activist has recently been involved in both a Pride Party and a Queer film festival, which attracted over 600 paying participants from around the region.
Queer community leaders point out different elements of both recent progress and hopes for sustainable success in the future beyond the constant imperative to keep community members safe and to try to get discriminatory laws repealed.
“We need to continue to work together, make good use of our limited resources, be clear about what we are doing, raise awareness and be diplomatic when dealing with the authorities” says another anonymous Queer activist and feminist in Rwanda.
Ngabo in Nairobi believes that Queer people across the region need to develop a strong sense of community and be “stubborn when they are told they can’t do something, and take space and stand up for what they believe in.”
Finding allies to your cause
Aliganyira in Kampala agrees that people should not run away from their ongoing challenges with safety, respect and equal opportunity and instead continue to show courage, resilience and perseverance to defend their current rights and expand them in future.
A Queer activist in Rwanda stressed the need to work with allies and others to create more education and training to promote awareness, understanding and empathy.
Ngabo shared some advice: “Start small and start where you are,” he said. “Speak up when you hear harmful stereotypes. Make space for people to share their stories without fear. Support Queer-led groups, attend events, or even just show up for your friends when they need someone safe to lean on.”
Allyship isn’t always grand, he said. “It’s often in the quiet, consistent choices to affirm someone’s humanity,” he said.
Queer community leaders say they are generally optimistic about the future.
“In five to 10 years’ time, the narrative will change completely,” said Otieno in Nairobi.
Changing people’s perceptions
Young queer activists are being empowered and learning how to take on leadership roles in government and in other decision-making spaces, said one Rwandan activist.
Another Rwandan activist envisions a future where same sex couples will be able to get married, adopt kids and access medical services freely.
“Things will improve if we are smart,” the activist said. “I hope we will see more safe spaces, more affirming healthcare (especially in mental health), more economic inclusion, and more media and policy-making representation. In the end though, dignity is more important than law changes.”
Ngabo in Nairobi agrees: “We want respect,” he said. “We want to feel safe. We don’t want equality. We want equal opportunities. We want to thrive.”
Real progress means being able to live authentically without having to conform, he said. “Stronger protections under the law, safe spaces to gather, visibility in public life, and most importantly, Queer people leading the narrative about our own lives,” Ngabo said. “These are what a brighter future looks like to me.”
Even in Uganda, Aliganyira believes things can still change for the better.
Uganda was once considered the safest place for Queer people in East Africa before the 1990s, he said.
“Uganda can undo what it has done and get beyond fear and uncertainty,” he said. “It’s up to everyone to come together and overcome division.”
Questions to consider:
1. Why do LGBTQIA+ community members in East Africa prefer to call themselves “Queer”?
2. What are the key elements of a brighter future for the East African Queer communities?
3. What can you do yourself to stand up for human rights as an ally or a member of a Queer community where you live?
This blog was kindly authored by Mike Crone, a final-year law student at the University of Reading. He is developing a series of blogs, articles and research on public law matters, and the future of higher education policy.
The Issue
You look intently at the assessment mark. 52%. That’s it. No why. No how. Just 52%. The comments read something like: ‘Good structure. Engage more critically’. Two sentences to explain twelve weeks of work. And that number now decides your classification, your next step, maybe your career.
In the HEPI and Advance HE Student Academic Experience Survey 2025, 58% respondents state that all or most of their teaching staff gave them useful feedback. However, this means that for 42% of respondents, around half, a minority, or none of their teaching staff were providing useful feedback. Similarly, 51% of respondents stated that all or a majority of teaching staff provided feedback on draft work, and 58% stated that all of the majority of their teaching staff gave them more general feedback on progress. While some of these figures are welcome, there is an issue of consistency. Most students are having a positive experience of feedback from most of their teaching staff, however, there are gaps in the system. For example, 14% of students stated that a minority or none of their teaching staff provided them with useful feedback.
While these figures have improved over the last five years, the statistics remain concerning. Where useful feedback is lacking, marks may be being awarded without transparent explanation, feedback is often vague, and links to assessment rubrics may be missing or inconsistently applied. Without improvements, students are not consistently being shown how to improve, and even where rubrics are introduced, their effectiveness hinges on clarity, training, and implementation, all of which vary widely. If students question the result, they may often be told it falls under ‘academic judgement’.
In a system that demands students explain every idea, quote every claim, and justify every argument, surely institutions should be held to the same standard?
This would be concerning at any time. But in 2025, it’s urgent. Ninety-three per cent of students now use generative AI tools in their studies, up from 66 per cent just a year ago, according to the HEPI–Kortext Gen AI Survey. As the Guardian reported, thousands of UK university students were caught cheating using AI in the last academic year. The pressure on universities to modernise assessment and restore student trust has never been greater.
And as Rohan SelvaRadov highlighted in his HEPI Policy Note Non-Examinable Content: Student access to exam scripts, most students do not even see their exam scripts. If students cannot access the work being judged, feedback loses almost all its value. Transparency begins with access. Without it, fairness collapses. Rohan’s superb recommendations on page 10 of the Policy Note set the foundations for rectification.
The Problem
Assessment is the foundation of credibility in higher education. But right now, that foundation is cracking. Markers vary. Some use rubrics carefully. Others rely on instinct. A recent study of programming assignments asked 28 markers to grade the same set of student submissions. The results were wildly inconsistent, and in some criteria, the level of agreement was close to random. Double marking and moderation exist, but they rarely give students clarity. Feedback still often consists of vague phrases like ‘needs depth’ or ‘some repetition’, which give no insight into how the grade was reached.
This is not only a pedagogical failure. It raises legal concerns.
Under Section 49 of the Consumer Rights Act 2015, universities must provide services with ‘reasonable care and skill’. If a student receives a grade without explanation, it risks breaching that statutory duty. Schedule 2 of the Act lists examples of unfair terms, many of which could be triggered by provisions in student handbooks or teaching contracts.
The Equality Act 2010 goes further. Sections 20 and 21 require universities to make reasonable adjustments where a provision, criterion, or practice places disabled students at a substantial disadvantage. Schedule 13 goes into greater depth surrounding the duties of Higher Education institutes. Vague or unstructured feedback can do exactly that, especially for neurodivergent students who may rely on clarity and structure to improve. Where feedback is not intelligible, impactful, and rubricaligned, universities may be breaching their anticipatory duty under Section 149 as well as the individual duty under Section 20.
Meanwhile, the formats we continue to rely on (long essays and highstakes exams) are increasingly misaligned with the world graduates inhabit. Essays reward polish and curriculum style and adherence. Exams reward memory under pressure. Both reward conformity. Neither reflects how people learn and work today, especially in an age of technology and AIsupported thinking.
If students are learning differently, thinking differently, and writing differently; why are aren’t we assessing them differently?
The Solution
The Department for Education (DfE) has the power to act. The Secretary of State for Education and Minister for Women and Equalities appoints the Office for Students (OfS) and sets regulatory priorities. The OfS was designed as a buffer, not a direct arm of government. But if students cannot trust how their futures are decided, then the DfE must ensure the OfS enforces transparency. This does not mean ministers marking essays. It means regulators requiring clear and fair feedback from institutions.
First, every summative assessment should include a short, criterion-linked justification. Paragraphs should be labelled according to the rubric. If the student scored a 2:2 in structure and a 1st in analysis, they should be told so clearly and briefly. It would be as easy as colour-coding the marking rubric sections on the rubric table and then highlighting each sentence, paragraph, or particular section as to which colour-coded rubric area it correlates to.
Second, from September 2025, Jisc is piloting AI-assisted marking tools like Graide, KEATH and TeacherMatic. These systems generate rubric-matched feedback and highlight inconsistencies. They do not replace human markers. They reveal the thinking behind a mark, or its absence.
Pilots should be funded nationally. The results should be made public. If AI improves consistency and transparency, it should be integrated with safeguards and moderation.
Third, we need fewer mega-assessments and more micro-assessments. Small, frequent tasks: oral analyses, short-answer applications, real-world simulations, timed practicals. These are harder to cheat, easier to mark, and better at testing what matters: judgement, adaptability, and process.
British University Vietnam has already piloted an AI-integrated assessment model with a 33 per cent increase in pass rates and a 5.9 per cent rise in overall attainment. This is not theory. It is happening. But that, precisely, is the concern. A jump in attainment might reflect grade inflation or relaxed calibration rather than increased accuracy. Recent studies complicate the AI narrative: a 2025 study in BMC Medical Education found that while AI systems like ChatGPT-4o and Gemini Flash 1.5 performed well in visually observable OSCE tasks (e.g., catheterisation, injections), they struggled with tasks involving communication or verbal interpretation; areas where nuance matters most.
Finally, the OfS registration conditions can be updated to require forensic marking as a basic quality measure. The QAA Quality Code can be revised to mandate ‘outcome-reason mapping’. Institutional risk and satisfaction profiles can include indicators like student trust, misconduct rates, and assessment opacity.
It is to be noted that, as per the Competition & Markets Authority’s (CMA) guidance and the case of Clark v University of Lincolnshire and Humberside [2000] EWCA Civ 129, if assessment is not transparent, it may not be lawful, and could be left open to judicial challenge. However, it may not be wise to pursue such judicial challenge through an application for judicial review. The precedent set by the case of Clark, subsequent cases thereafter, and the CMA’s guidance, almost closes the door to judicial review. But, in turn, it leaves open the door to a civil action of a possible breach of contract.
In conclusion, Dear DfE… please see me after class regarding the above. If students must show their workings, then so must academic institutions, with government support. With the ever-increasing appetite of the population for litigation, it would seem prudent to take pre-emptive action and collaboration to mitigate such risks.
Students from the class of 2024 had historically low scores on a major national test administered just months before they graduated.
Results from the National Assessment of Educational Progress, or NAEP, released September 9, show scores for 12th graders declined in math and reading for all but the highest performing students, as well as widening gaps between high and low performers in math. More than half of these students reported being accepted into a four-year college, but the test results indicate that many of them are not academically prepared for college, officials said.
“This means these students are taking their next steps in life with fewer skills and less knowledge in core academics than their predecessors a decade ago, and this is happening at a time when rapid advancements in technology and society demand more of future workers and citizens, not less,” said Lesley Muldoon, executive director of the National Assessment Governing Board. “We have seen progress before on NAEP, including greater percentages of students meeting the NAEP proficient level. We cannot lose sight of what is possible when we use valuable data like NAEP to drive change and improve learning in U.S. schools.”
In a statement, Education Secretary Linda McMahon said the results show that federal involvement has not improved education, and that states should take more control.
“If America is going to remain globally competitive, students must be able to read proficiently, think critically, and graduate equipped to solve complex problems,” she said. “We owe it to them to do better.”
The students who took this test were in eighth grade in March of 2020 and experienced a highly disrupted freshman year of high school because of the pandemic. Those who went to college would now be entering their sophomore year.
Roughly 19,300 students took the math test and 24,300 students took the reading test between January and March of 2024.
The math test measures students’ knowledge in four areas: number properties and operations; measurement and geometry; data analysis, statistics, and probability; and algebra. The average score was the lowest it has been since 2005, and 45% of students scored below the NAEP Basic level, even as fewer students scored at NAEP Proficient or above.
NAEP Proficient typically represents a higher bar than grade-level proficiency as measured on state- and district-level standardized tests. A student scoring in the proficient range might be able to pick the correct algebraic formula for a particular scenario or solve a two-dimensional geometric problem. A student scoring at the basic level likely would be able to determine probability from a simple table or find the population of an area when given the population density.
Only students in the 90th percentile — the highest achieving students — didn’t see a decline, and the gap between high- and low-performing students in math was higher than on all previous assessments.
This gap between high and low performers appeared before the pandemic, but has widened in most grade levels and subject areas since. The causes are not entirely clear but might reflect changes in how schools approach teaching as well as challenges outside the classroom.
Testing officials estimate that 33% of students from the class of 2024 were ready for college-level math, down from 37% in 2019, even as more students said they intended to go to college.
In reading, students similarly posted lower average scores than on any previous assessment, with only the highest performing students not seeing a decline.
The reading test measures students’ comprehension of both literary and informational texts and requires students to interpret texts and demonstrate critical thinking skills, as well as understand the plain meaning of the words.
A student scoring at the basic level likely would understand the purpose of a persuasive essay, for example, or the reaction of a potential audience, while a students scoring at the proficient level would be able to describe why the author made certain rhetorical choices.
Roughly 32% of students scored below NAEP Basic, 12 percentage points higher than students in 1992, while fewer students scored above NAEP Proficient. An estimated 35% of students were ready for college-level work, down from 37% in 2019.
In a survey attached to the test, students in 2024 were more likely to report having missed three or more days of school in the previous month than their counterparts in 2019. Students who miss more school typically score lower on NAEP and other tests. Higher performing students were more likely to say they missed no days of school in the previous month.
Students in 2024 were less likely to report taking pre-calculus, though the rates of students taking both calculus and algebra II were similar in 2019 and 2024. Students reported less confidence in their math abilities than their 2019 counterparts, though students in 2024 were actually less likely to say they didn’t enjoy math.
Students also reported lower confidence in their reading abilities. At the same time, higher percentages of students than in 2024 reported that their teachers asked them to do more sophisticated tasks, such as identifying evidence in a piece of persuasive writing, and fewer students reported a low interest in reading.
Chalkbeat is a nonprofit news site covering educational change in public schools.
This audio is auto-generated. Please let us know if you have feedback.
Dive Brief:
California’s Black, foster and homeless student populations are experiencing persistent and widespread discipline disparities despite state reforms to reduce inequities, a new report from the National Center for Youth Law said.
The report found that students in the foster system lost 76.6 days of instruction per 100 students enrolled in 2023-24 due to out-of-school suspensions — seven times the statewide average for all students of 10.7 days lost per 100 students. And in many districts, the suspension gap between Black and White students has increased significantly over the past seven years.
NCYL warns that discipline disparities could widen even more as the Trump administration seeks to eliminate school discipline practices meant to address racial inequity for historically marginalized student populations.
Dive Insight:
NCYL’s analysis of discipline data in California shows that while some districts have made progress in reducing disparities, many continue to suspend and expel students at disproportionately high rates.
For example, students experiencing homelessness lost 29.1 days because of out-of-school suspensions per 100 students enrolled in 2023-24. Students with disabilities lost 23.4 days of instruction per 100 students enrolled the same school year, which is nearly three times higher than students without disabilities, according to the report.
Black foster youth had the highest disproportionate discipline rate with 121.8 days per 100 students enrolled due to out-of-school suspensions. That’s 15 times the rate of lost instruction for all enrolled Whites students, which was 7.9 lost days per 100 students.
The report’s analysis pulls from discipline data between the 2017-18 and 2023-24 school years. California doesn’t publicly report on the number of school days lost by offense category. Rather, NCYL developed the metric to compare rates across districts, over time and between student groups, the report said.
Additionally, NCYL’s data analysis shows that most suspensions are for minor misconduct that did not involve injury, such as the use of profanity or vulgarity. The 2024-25 school year was the first in which no suspensions were allowed for willful defiance in grades K-12 in California, although the policy had been phased in for younger grades in the years before.
The report recommends that the state disaggregate discipline data for the offenses with the highest rates so the public can see which are for violent and nonviolent behaviors. Currently, most suspensions in California schools, even for profanity and vulgarity offenses, can be reported under a category titled “violent incident, no injury,” which can be misleading, NCYL said.
When most suspensions are reported under the category of ‘violent incident, no injury’ or ‘violent incident, injury’ people will assume the offenses were violent, but they could be mostly profanity and vulgarity, said Dan Losen, co-author of the report and senior director for education at NCYL.
“Don’t call obscenity violence. It’s not violent,” Losen said. “These very subjective determinations about what’s profanity, what’s vulgarity, what’s obscene, what’s not obscene is fertile ground for implicit racial bias.”
The report highlights several California districts making improvements in reducing discipline disparities. Merced Union High District, for instance, has reduced its rate of lost instruction from 58.3 days per 100 Black students in 2017-18, to 8.8 days per 100 Black students in 2023-24. Lost instruction days for students with disabilities went from 32 in 2017-18 to 6.1 in 2023-24 per 100 students with disabilities.
The report credited the reductions in lost instruction to the district’s efforts at problem-solving rather than punitive measures and for providing student supports like individualized interventions and behavioral services.
NCYL recommends several statewide initiatives to reduce discipline disparities, including strengthening state civil rights enforcement and oversight of district discipline practices, as well as expanding support for students in the foster system, students experiencing homelessness, and students with disabilities.
However, statewide reforms in California could be in jeopardy under the Trump administration’s efforts to stamp out diversity, equity and inclusion programs nationally, the report said. Such state reforms have included a ban on suspensions for willful defiance in grades K-12 and the explicit inclusion of school discipline in the California Department of Education’s statewide accountability system.
Specifically, the report points to a White House executive order issued in April that calls for a stop to “unlawful ‘equity’ ideology” in school discipline. The order requires the U.S. Department of Education to issue guidance on states’ and districts’ obligations “not to engage in racial discrimination under Title VI in all contexts, including school discipline.”
Critics of equity-based discipline policies say they hamper school safety.
Title VI of the Civil Rights Act prohibits discrimination based on race, color or national origin in federally funded programs.
The federal discipline guidance required by Trump’s executive order has not yet been issued, and the Education Department did not respond to inquiries about its status. While discipline policies are typically set at the school, district or state levels, the federal government can issue guidance and investigate schools for discriminatory practices under Title VI.
The civil rights law has historically been invoked to protect the rights of historically marginalized students, including when they are overrepresented in school discipline — and especially exclusionary discipline — data. However, the current administration has used the law to protect White and Asian students, sometimes at the expense of DEI efforts meant to level the playing field for those historically marginalized groups.
“One should expect that, soon, all student groups that have experienced unjustifiably high rates of removal will be excluded from educational opportunities on disciplinary grounds even more often,” the NCYL report said.
On March 20, 2023, the students of Spectrum WT — an LGBTQ+ organization at West Texas A&M University — were in the final stages of preparing a charity drag show when University President Walter Wendler sent a community-wide email unilaterally banning all drag shows from campus. In his email, Wendler derided drag shows as “misogynistic,” and enacted the ban despite acknowledging that “the law of the land appears to require” him to allow the show to go on.
On Aug. 18, 2025, the U.S. Court of Appeals for the Fifth Circuit confirmed that, indeed, it does. The 2-1 panel opinion overturned the trial court’s denial of Spectrum WT’s motion for a preliminary injunction and ordered the lower court to block Wendler from enforcing the drag ban while the case proceeds. The court held the students are substantially likely to prevail on the merits of their claims that singling out drag performances to ban them from a campus theater, otherwise open to students and the public alike, violates the right to free speech.
To start, the court affirmed that the First Amendment protects drag performance — just as it protects other theatrical performance — rejecting the trial court’s holding that drag shows constitute nonexpressive conduct outside the First Amendment’s protection. The appeals court explained that like the “unquestionably shielded painting of Jackson Pollock, music of Arnold Schöenberg, or Jabberwocky verse of Lewis Carroll,” art, whether painted, sung, or performed on stage, is expressive as so long as it is “evident that conveying some message, even if nearly opaque or perhaps smeared, was intended.”
Spectrum WT’s drag show passes that test, the court explained, because “the message sent by parading on a theater stage in the attire of the opposite sex,” in support for the LGBTQ+ community, “would have been unmistakable” to its ticketed audience.
The second question the court considered was whether the university could lawfully keep Spectrum WT’s drag show out of Legacy Hall, a performance venue the college allows both students and outside groups to rent for expressive events like magic shows, beauty pageants, and even a past drag show. Here, again, the court sided with Spectrum WT. The court conducted a public forum analysis, which examines the underlying purposes and practices of government property to determine what restrictions officials can place on protected expression in the property.
The court noted that the university had let pretty much anyone beside the plaintiffs use Legacy Hall for expressive events, including, “a local church group’s ‘Community Night of Worship and Prayer,’ a congressional candidate forum, a local high school’s ‘Casino Night’ dance, a local nonprofit’s benefit gala, Randall County’s livestock show, and a religious retreat center’s event dinner.”
Because President Wendler singled out a particular type of expression to exclude from a space WTAMU generally opens to third parties for expressive use, his drag ban must survive strict scrutiny, the toughest level of judicial review. And because Wendler made no attempt to overcome strict scrutiny, the court held “the plaintiffs are entitled to an injunction protecting their rights, and the district court erred in concluding otherwise.”
Spectrum WT’s legal battle may not be completely over, as the case waits to return to the trial court, but this opinion represents a real victory for all students at West Texas A&M, reaffirming the First Amendment principles that protect their free speech rights on campus. It’s also another victory for students across Texas — where drag performance bans have become alltoocommon — whose abilities to express themselves shouldn’t be subject to the whims of censorial college administrators.
Across the country, Black fathers are too often seen as a threat when they speak up and advocate for their children. And it’s not just in courtrooms and on sidewalks — it’s happening in classrooms, daycares and schools.
I’ve spent my career in education and equity leadership, and I know this is part of a larger, troubling pattern. When Black parents — especially men — assert themselves in spaces not designed for them, they are too often perceived as “aggressive.”
Their advocacy is sometimes interpreted as “rude,” and their presence is framed as disruption rather than partnership, something that has played out in my own experience as a proud Black father of three.
This isn’t about one parent or teacher or even one moment. It’s about what happens when systems designed to support children carry embedded racial assumptions.
I’ll never forget picking my kids up from daycare during a lice outbreak. My wife and I had no experience dealing with lice, and I asked a few questions — just trying to understand what to expect. Instead of getting reassurance or guidance, I was met with suspicion, even subtle blame.
Or the time I raised a safety concern about an emotional child in my son’s class who had a pattern of throwing chairs. Rather than treating my concern as legitimate, it was brushed off — as if I were overreacting.
In both cases, my presence and voice weren’t welcomed. They were managed.
In a society in which Black men are still fighting to be seen as full participants in their children’s lives, we cannot ignore the role that bias plays in shaping who gets welcomed, who gets questioned and who gets believed. Daycares, schools, courts and society at large must actively affirm and restore the voices of Black fathers, rather than dismiss them.
Too often, Black men are portrayed as threats or criminals — rather than as nurturers and protectors. These images become mentally entrenched, shaping public attitudes and institutional responses. This persistent framing contributes to a cultural blind spot that brings confusion to the presence of Black fathers and negatively affects how they are treated in schools, courts and communities.
Despite this anti-Black bias, Black fathers defy stereotypes every day. Black dads, on average, are actually more involved in daily caregiving than fathers of other racial backgrounds, the National Health Statistics Reports from the Centers for Disease Control and Prevention notes. Yet media representation has not caught up with this reality.
As a student pursuing a doctorate in education leadership and policy, I study how identity shapes access to opportunity. And I know that bias against Black men starts early — when we are boys. A 2016 Yale Child Study Center report found that preschool teachers, regardless of race, were more likely to monitor Black boys for misbehavior — even when no misbehavior was apparent.
And in Indiana, studies highlight that nearly four out of every five Black children in the state will be investigated for suspected maltreatment.
These are not just statistical disparities — they’re stories of fractured trust between families and the institutions meant to serve them.
I have explored the concept of “mega-threats” introduced by researchers Angelica Leigh and Shimul Melwani — high-profile, identity-relevant events that trigger lasting psychological stress for people who share that identity. Though typically used to describe major public tragedies, these threats can be individual and personal, too. When a Black father sees himself reduced to a stereotype — his parenting undercut, his words distorted — it becomes an embodied threat, one that lingers and works to fulfill the myth that Black fathers are absent. These corrosive interactions run counter to the heroic influence and legacy that Black men have within their communities as warm demanders — men who emphatically build relationships and uphold high expectations.
If we want to support children, we must support their families. That means ensuring that early childhood professionals are trained not just in child development but in cultural competence and anti-bias practices. It means separating assumptions from observations when writing reports.
And it means reflecting on how language like “rude” or “aggressive” can carry racial undertones that reinforce long-standing stereotypes.
In my work as an educator, leader and former coach, I’ve partnered with countless families across race and class lines. What all parents want — especially those from marginalized communities — is the assurance that when they show up, they’ll be heard, not judged. That their questions will be met with respect, not suspicion.
If we truly believe in family engagement, we must be honest about the ways our systems still punish the very people we say we want more of. Black fathers are showing up.
The question is: are we ready to see them clearly?
Craig Jordan is an educator and doctoral student at Vanderbilt University’s Peabody College. A native of Gary, Indiana, he writes about equity, identity and systemic change in education. His work has been featured in IndyStar and Yahoo News.
This story about Black fathers was produced by The Hechinger Report, a nonprofit, independent news organization focused on inequality and innovation in education. Sign up for Hechinger’s weekly newsletter.
The Hechinger Report provides in-depth, fact-based, unbiased reporting on education that is free to all readers. But that doesn’t mean it’s free to produce. Our work keeps educators and the public informed about pressing issues at schools and on campuses throughout the country. We tell the whole story, even when the details are inconvenient. Help us keep doing that.