Tag: Size

  • New Report From CUPA-HR Explores Changes in Faculty Size, Pay and Tenure Status Over the Past 20 Years – CUPA-HR

    New Report From CUPA-HR Explores Changes in Faculty Size, Pay and Tenure Status Over the Past 20 Years – CUPA-HR

    by CUPA-HR | May 20, 2025

    How has the higher education faculty workforce changed over the past 20 years? What disciplines have emerged as frontrunners in hiring? What disciplines pay the most? What disciplines pay the least?

    In the new research report, Two Decades of Change: Faculty Discipline Trends in Higher Education, CUPA-HR presents findings from an analysis of data from its Faculty in Higher Education Survey from 2003-04 to 2023-24.

    Some key findings highlighted in the report:

    • The disciplines of Health Professions and Business have experienced the most growth in number of faculty over the past 20 years. The number of faculty in Health Professions more than doubled from 2003-04 to 2023-24, and the number of Business faculty grew by 20.8% over the same period.
    • The disciplines of Theology, Liberal Arts and Humanities, and English Language/Literature are experiencing very little growth in terms of hiring new faculty. These disciplines also have high numbers of non-tenure-track faculty and are among the lowest-paying disciplines — all of which point to institutions’ divestment in these disciplines.
    • Business ranked among the top four highest-paid disciplines every year from 2003-04 to 2023-24 and has been the highest-paid discipline for the past nine years. In addition, Business saw the largest percentage increase in median salary across all disciplines, with an increase of 66.2% since 2003-04.
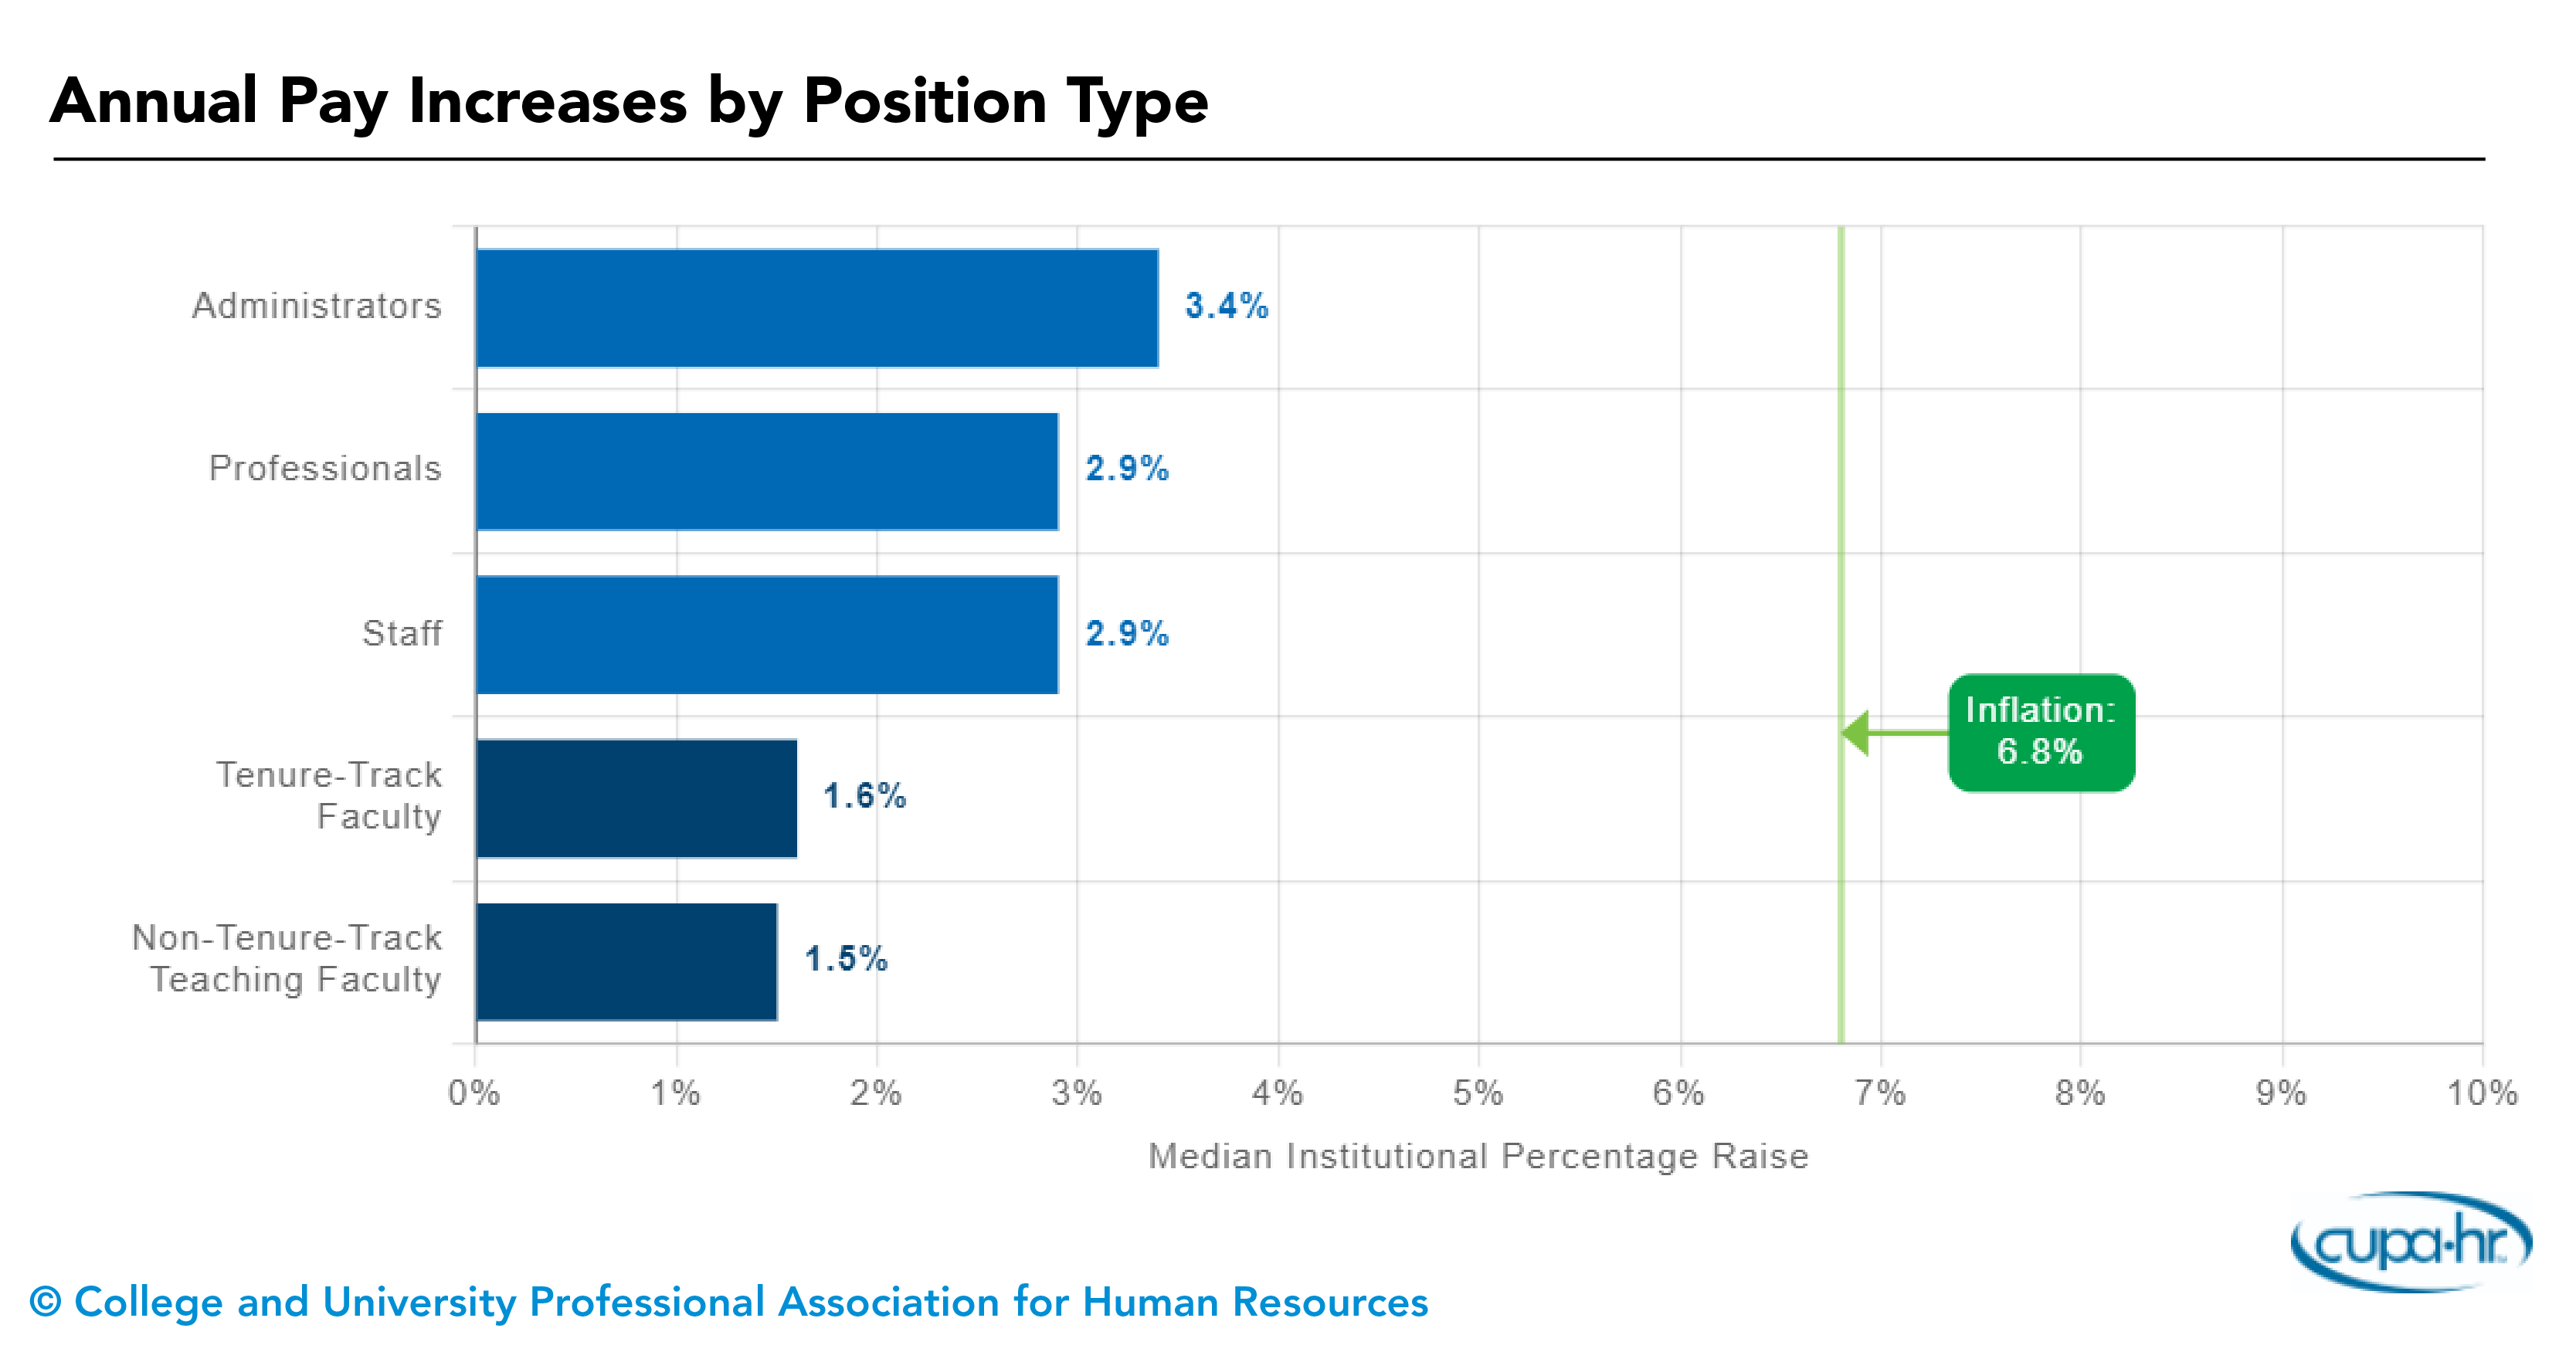
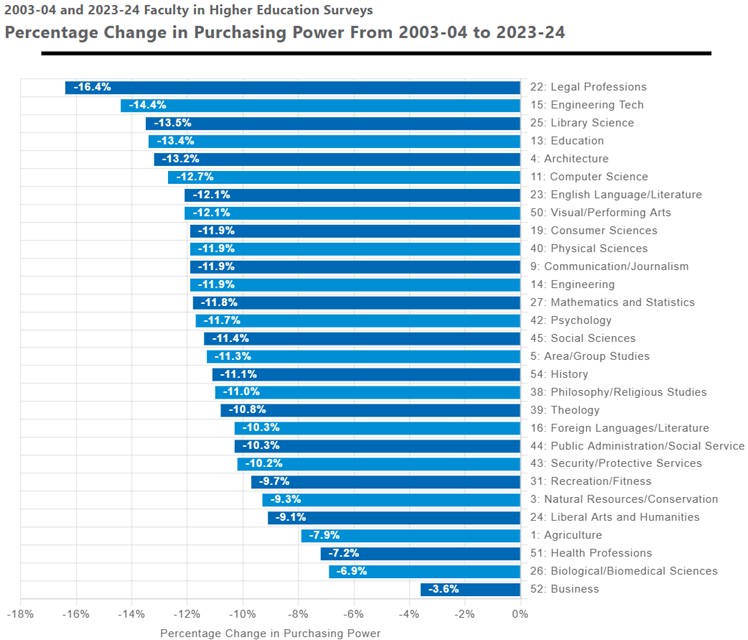
    • No discipline’s pay increases beat inflation. Although many disciplines appeared strong based on changes in size and salary over time, all disciplines reported median salaries in 2023-24 that were lower than inflation-adjusted salaries based on 2003-04 salary data. Overall, faculty in all disciplines have less purchasing power with their salaries in 2023-24 than they did in 2003-04.


    Read the full report and explore the data with interactive graphics.


    Source link

  • 2022 Data: Changes in Higher Ed Pay and Workforce Size – CUPA-HR

    2022 Data: Changes in Higher Ed Pay and Workforce Size – CUPA-HR

    by CUPA-HR | April 27, 2022

    CUPA-HR has released its data on overall higher ed pay increases, as well as changes in workforce size for 2021-22.

    Higher Ed Pay Increases Have Not Kept Pace With Inflation

    The soaring inflation rate has far outpaced pay increases for the higher education workforce. According to findings from CUPA-HR’s annual workforce surveys for 2021-22, overall median salaries for administrators increased by 3.4%. Professionals and non-exempt staff saw increases of 2.9%, and salaries for tenure-track and non-tenure-track faculty increased by 1.6% and 1.5%, respectively. The inflation rate for 2021 was 6.8% and continues to climb.

    This is not the first year that pay increases have not kept up with inflation. Pay increases for administrators, professionals and staff last met or exceeded inflation in 2019-20.  Non-tenure-track faculty salary increases last met or exceeded inflation in 2016-17, and tenure-track faculty salary increases have not kept pace with inflation in any of the past six years.

    Explore pay-increase trends on CUPA-HR’s website.

    Overall Workforce Size Has Declined in the Wake of the Pandemic

    Historically, the overall size of the higher education workforce has increased from year to year. However, colleges and universities are experiencing the same employee recruitment and retention challenges that most U.S. employers have struggled with in the past few years. In both 2020-21 and 2021-22, the size of full-time staff, part-time staff, and tenure-track faculty declined from the prior year.

    Two areas of the workforce that saw growth this year were those of non-tenure-track faculty and adjuncts. Although the number of non-tenure-track faculty and adjuncts declined between 2019-20 and 2020-21, those numbers have rebounded in 2021-22.

    Explore the trends in workforce size changes on CUPA-HR’s website.

    In-Depth Data and Custom Reports

    Higher ed institutions can use CUPA-HR’s DataOnDemand (DOD) subscription service to run comprehensive data tables and analyses.


    Source link