Tag: Student

  • Investing in Student Engagement: University of Georgia Equips Faculty and Students with Free Access to Top Hat

    Investing in Student Engagement: University of Georgia Equips Faculty and Students with Free Access to Top Hat

    New license agreement provides all students and faculty with free access to Top Hat, reinforcing UGA’s strategic focus on affordability, student success, and innovation in teaching.

    TORONTO – June 17, 2025 – Top Hat, the leader in student engagement solutions for higher education, today announced that the University of Georgia has entered into a new enterprise agreement that will provide campus-wide access to the Top Hat platform at no cost to students or faculty. This initiative supports UGA’s continued efforts to promote high-impact teaching practices, student affordability, and innovation in the classroom.

    Top Hat’s interactive teaching platform as well as content authoring and customization tools will be available to UGA faculty to enhance in-person, online, and hybrid courses across disciplines. With this agreement, UGA joins a growing number of leading institutions investing in Top Hat to empower instructors to improve learning outcomes and student success at scale.

    “We are proud to support the University of Georgia in its efforts to deliver proven, student-centered teaching practices,” said Maggie Leen, CEO of Top Hat. “This partnership ensures every student and educator at UGA has access to the tools they need to drive learning and achievement, while reinforcing the university’s focus on affordability, innovation, and evidence-based instruction.”

    This initiative reflects UGA’s commitment to both student affordability and instructional excellence. With Top Hat, faculty can adopt and customize low- or no-cost course materials—including OpenStax and OER—helping to reduce costs for students while delivering engaging, evidence-based instruction. The platform enables instructors to easily integrate active learning strategies, such as frequent low-stakes assessments and reflection prompts, which are proven to enhance student engagement and academic outcomes. Top Hat’s AI-powered assistant, Ace, streamlines course prep by generating high-quality questions directly from lecture content, and supports students with on-demand study help and unlimited practice opportunities—reinforcing learning both in and out of the classroom. Real-time data from polls, quizzes, and assignments also empowers educators to continuously monitor progress and improve instructional impact.

    The University of Georgia is recognized nationally for excellence in teaching and learning, student completion, and affordability. The enterprise agreement with Top Hat is part of UGA’s broader commitment to building a world-class learning environment and increasing access to affordable, high impact teaching and  learning resources.

    About Top Hat

    As the leader in student engagement solutions for higher education, Top Hat enables educators to employ proven student-centered teaching practices through interactive content and tools enhanced by AI, and activities in in-person, online and hybrid classroom environments. To accelerate student impact and return on investment, the company provides a range of change management services, including faculty training and instructional design support, integration and data management services, and digital content customization. Thousands of faculty at 900 leading North American colleges and universities use Top Hat to create meaningful, engaging and accessible learning experiences for students before, during, and after class.

    Contact [email protected] for media inquiries.

    Source link

  • States balance supports and discipline to address troubling student behaviors

    States balance supports and discipline to address troubling student behaviors

    This audio is auto-generated. Please let us know if you have feedback.

    In Arkansas, a $7 million program approved last year aims to support students’ mental health by restricting their cellphone use and using telehealth to connect more students to mental health providers.

    In Texas, a multiyear effort to study student mental and behavioral health yielded a host of recommendations, including putting Medicaid funds toward school-based mental health supports and better tracking of interventions.

    And in West Virginia, state education leaders and partnership organizations have amassed a trove of resource documents and built out training to help schools address student mental health challenges.

    All three states are working to proactively to respond to the student mental health crisis that worsened due to the COVID-19 pandemic. 

    All three states are also considering or expected to pass laws allowing schools to implement tougher discipline policies.

    Likewise, many states are tweaking their discipline policies at the same time they are putting more resources toward supporting students’ mental well-being.  

    Although school discipline and mental health supports are mostly addressed at the local level, state leadership is critical for setting expectations for accountability and requiring transparency in disciplinary actions, said Richard Welsh, founding director of the School Discipline Lab, a research center that shares information about school discipline.

    And states are using a variety of measures from proactively providing mental health supports to loosening restrictions for exclusionary discipline, said Welsh, who is also an associate professor of education and public policy at Vanderbilt University. 

    Post pandemic, “we did have an uptick in student misbehavior,” Welsh said. “But I think what also gets missing in that was we also had an uptick in student and teacher needs.” 

    The COVID factor

    Post-COVID, schools have reported a rise in unruly behaviors, including among young students. Some of the behaviors have been violent and have even injured teachers, leading them to turn away from the profession.

    Research published by the American Psychological Association last year found an increase in violence against K-12 educators over the past decade. After COVID restrictions ended in 2022, a survey of 11,814 school staff, including teachers and administrators, found that 2% to 56% of respondents reported physical violence at least once during the year, with rates varying by school staff role and aggressor. 

    Data also shows that student verbal abuse occurring at least once a week on average, doubled from 4.8% in the 2009-10 school year to 9.8% in 2019-20, according to APA.

    Students’ mental health needs increased during and after the pandemic, according to studies. Additional research showed that teachers, administrators and other school staff lacked resources to properly address students’ needs

    Some educators, parents and advocates worry that harsher student discipline policies will undermine evidenced-based practices for decreasing challenging behaviors and keeping students in school. They are also concerned that after several years of expanding positive behavior supports and restorative practices, a focus on stricter discipline policies will disproportionately affect students of color and those with disabilities. 

    The legislative activity at the state level is occurring at the same time President Donald Trump is calling for “reinstating common sense” to school discipline policies. An April executive order calls for the U.S. Department of Education to issue guidance to districts and states regarding their obligations under Title VI to protect students against racial discrimination in relation to the discipline of students. Title VI of the Civil Rights Act prohibits discrimination based on race, color or national origin in federally funded programs. 

    The Trump administration has called for the federal government to enact policies that are “colorblind,” not favoring one race over others.

    The order also directs the Education Department to submit a report by late August on the “status of discriminatory-equity-ideology-based school discipline and behavior modification techniques in American public education.” 

    Welsh predicts that the executive order will lead to more state activity addressing student behavior and a specific focus on the guidelines for administering punitive discipline. 

    Source link

  • Data Shows Attendance Improves Student Success

    Data Shows Attendance Improves Student Success

    Prior research shows attendance is one of the best predictors of class grades and student outcomes, creating a strong argument for faculty to incentivize or require attendance.

    Attaching grades to attendance, however, can create its own challenges, because many students generally want more flexibility in their schedules and think they should be assessed on what they learn—not how often they show up. A student columnist at the University of Washington expressed frustration at receiving a 20 percent weighted participation grade, which the professor graded based on exit tickets students submitted at the end of class.

    “Our grades should be based on our understanding of the material, not whether or not we were in the room,” Sophie Sanjani wrote in The Daily, UW’s student paper.

    Keenan Hartert, a biology professor at Minnesota State University, Mankato, set out to understand the factors affecting students’ performance in his own course and found that attendance was one of the strongest predictors of their success.

    His finding wasn’t an aha moment, but reaffirmed his position that attendance is an early indicator of GPA and class community building. The challenge, he said, is how to apply such principles to an increasingly diverse student body, many of whom juggle work, caregiving responsibilities and their own personal struggles.

    “We definitely have different students than the ones I went to school with,” Hartert said. “We do try to be the most flexible, because we have a lot of students that have a lot of other things going on that they can’t tell us. We want to be there for them.”

    Who’s missing class? It’s not uncommon for a student to miss class for illness or an outside conflict, but higher rates of absence among college students in recent years are giving professors pause.

    An analysis of 1.1 million students across 22 major research institutions found that the number of hours students have spent attending class, discussion sections and labs declined dramatically from the 2018–19 academic year to 2022–23, according to the Student Experience in the Research University (SERU) Consortium.

    More than 30 percent of students who attended community college in person skipped class sometimes in the past year, a 2023 study found; 4 percent said they skipped class often or very often.

    Students say they opt out of class for a variety of reasons, including lack of motivation, competing priorities and external challenges. A professor at Colorado State University surveyed 175 of his students in 2023 and found that 37 percent said they regularly did not attend class because of physical illness, mental health concerns, a lack of interest or engagement, or simply because it wasn’t a requirement.

    A 2024 survey from Trellis Strategies found that 15 percent of students missed class sometimes due to a lack of reliable transportation. Among working students, one in four said they regularly missed class due to conflicts with their work schedule.

    High rates of anxiety and depression among college students may also impact their attendance. More than half of 817 students surveyed by Harmony Healthcare IT in 2024 said they’d skipped class due to mental health struggles; one-third of respondents indicated they’d failed a test because of negative mental health.

    A case study: MSU Mankato’s Hartert collected data on about 250 students who enrolled in his 200-level genetics course over several semesters.

    Using an end-of-term survey, class activities and his own grade book information, Hartert collected data measuring student stress, hours slept, hours worked, number of office hours attended, class attendance and quiz grades, among other metrics.

    Mapping out the various factors, Hartert’s case study modeled other findings in student success literature: a high number of hours worked correlated negatively with the student’s course grade, while attendance in class and at review sessions correlated positively with academic outcomes.

    Data analysis by Keenan Hartert, a biology professor at Minnesota State University, Mankato, found student employment negatively correlated with their overall class grade.

    Keenan Hartert

    The data also revealed to Hartert some of the challenges students face while enrolled. “It was brutal to see how many students [were working full-time]. Just seeing how many were [working] over 20 [hours] and how many were over 30 or 40, it was different.”

    Nationally, two-thirds of college students work for pay while enrolled, and 43 percent of employed students work full-time, according to fall 2024 data from Trellis Strategies.

    Hartert also asked students if they had any financial resources to support them in case of emergency; 28 percent said they had no fallback. Of those students, 90 percent were working more than 20 hours per week.

    Four pie charts show how working students often lack financial support and how working more hours is connected to passing or failing a course.

    Data analysis of student surveys show students who are working are less likely to have financial resources to support them in an emergency.

    The findings illustrated to him the challenges many students face in managing their job shifts while trying to meet attendance requirements.

    A Faculty Aside

    While some faculty may be less interested in using predictive analytics for their own classes, Hartert found tracking factors like how often a student attends office hours was beneficial to helping him achieve his own career goals, because he could include those measurements in his tenure review.

    An interpersonal dynamic: A less measured factor in the attendance debate is not a student’s own learning, but the classroom environment they contribute to. Hartert framed it as students motivating their peers unknowingly. “The people that you may not know that sit around you and see you, if you’re gone, they may think, ‘Well, they gave up, why should I keep trying?’ Even if they’ve never spoken to you.”

    One professor at the University of Oregon found that peer engagement positively correlated with academic outcomes. Raghuveer Parthasarathy restructured his general education physics course to promote engagement by creating an “active zone,” or a designated seating area in the classroom where students sat if they wanted to participate in class discussions and other active learning conversations.

    Compared to other sections of the course, the class was more engaged across the board, even among those who didn’t opt to sit in the participation zone. Additionally, students who sat in the active zone were more likely to earn higher grades on exams and in the course over all.

    Attending class can also create connections between students and professors, something students say they want and expect.

    A May 2024 student survey by Inside Higher Ed and Generation Lab found that 35 percent of respondents think their academic success would be most improved by professors getting to know them better. In a separate question, 55 percent of respondents said they think professors are at least partly responsible for becoming a mentor.

    The SERU Consortium found student respondents in 2023 were less likely to say a professor knew or had learned their name compared to their peers in 2013. Students were also less confident that they knew a professor well enough to ask for a letter of recommendation for a job or graduate school.

    “You have to show up to class then, so I know who you are,” Hartert said.

    Meeting in the middle: To encourage attendance, Hartert employs active learning methods such as creative writing or case studies, which help demonstrate the value of class participation. His favorite is a jury scenario, in which students put their medical expertise into practice with criminal cases. “I really try and get them in some gray-area stuff and remind them, just because it’s a big textbook doesn’t mean that you can’t have some creative, fun ideas,” Hartert said.

    For those who can’t make it, all of Hartert’s lectures are recorded and available online to watch later. Recording lectures, he said, “was a really hard bridge to cross, post-COVID. I was like, ‘Nobody’s going to show up.’ But every time I looked at the data [for] who was looking at the recording, it’s all my top students.” That was reason enough for him to leave the recordings available as additional practice and resources.

    Students who can’t make an in-person class session can receive attendance credit by sending Hartert their notes and answers to any questions asked live during the class, proving they watched the recording.

    Hartert has also made adjustments to how he uses class time to create more avenues for working students to engage. His genetics course includes a three-hour lab section, which rarely lasts the full time, Hartert said. Now, the final hour of the lab is a dedicated review session facilitated by peer leaders, who use practice questions Hartert designed. Initial data shows working students who stayed for the review section of labs were more likely to perform better on their exams.

    “The good news is when it works out, like when we can make some adjustments, then we can figure our way through,” Hartert said. “But the reality of life is that time marches on and things happen, and you gotta choose a couple priorities.”

    Do you have an academic intervention that might help others improve student success? Tell us about it.

    Source link

  • The student experience is beyond breaking point

    The student experience is beyond breaking point

    The standout headline stat in this year’s HEPI/Advance HE Student Academic Experience Survey (SAES) is that there’s been a dramatic rise in the proportion of students at work.

    Full-time undergraduates undertaking paid work (that is not related to their course) during term time is now at 68 per cent, up from 56 per cent in 2024 and just 35 per cent a decade ago.

    That’s tempered a little by the news that of those in work, the average number of hours worked during term time has actually fallen a little – from 14.5 hours to 13.1 hours. The report speculates that some of those who have begun working in the past year may have taken jobs with more moderate, perhaps more manageable, hours.

    Or maybe – in an era when the leisure and hospitality industries are on their knees, and employers have been grappling with a minimum wage rising much faster than inflation, students are struggling to get the hours they need.

    Either way, if we extrapolate up the sample and the overall mean average, and assume that students are roughly accurate in their responses, there’s an even more astonishing stat buried in here:

    That’s right – student numbers over the decade are up 15.5 per cent, while the total hours worked in term time are up 79.6 per cent.

    There’s a touch of numberwang here – so to put the numbers in some vague context, full-time students in the UK working during term time are now contributing over a quarter of the hours that Latvia’s entire workforce produces in a full year.

    Paid employment can be positive for all sorts of reasons – but the idea that an increase like that won’t be having serious negative impacts on health and learning really is for the birds.

    If – as various aspects of this year’s SAES suggest – earning while learning is a “new normal”, the least students should expect is universities developing proper strategies to facilitate it, and the government providing a proper framework to enable it. On European comparisons, we’re miles away from both.

    This is, as ever, a weighty bit of work – 10,232 full-time undergraduate students in the UK, representing a population of 1,759,245 (2023–24 data) all yield a margin of error of ±1% at a 95% confidence level.

    That said, a health warning before we get into it – while the figures weight the sample for ethnicity, type of school attended, discipline and (for the first time) domicile, they don’t weight the sample for age.

    And given the 22-25 age group has nearly doubled from 18 per cent to 36 per cent of the sample year on year, while the 26+ group has collapsed from 23 per cent to just 5 per cent, a pinch of salt is required throughout.

    Various of the questions referred to below can be interrogated for a range of demographic and other splits via the cross-tab tables, which DK has plotted here.

    [Full screen]

    Short-lived celebrations

    Corks were popping last year when the headline “value for money” perception score rose after its Covid collapse to 39 per cent. Short-lived celebrations, sadly – we’re back down at 37 per cent feeling they received good or very good value.

    As ever, Scottish students perceive the highest value, although even then only at 48 per cent – a figure which always baffles some on the socials who forget that a bargain Ryanair flight to Reykjavík still feels like terrible value if your sandwich and coffee at Keflavik International costs double that.

    That’s borne out in the factors considered when judging VFM data – cost of living is some 10 percentage points ahead of any other factor. Tuition fees have declined in relative significance, academic quality concerns are also moderating, and stuff like one-to-one staff time, contact hours, and course organisation remain relatively stable but secondary.

    Down in the splits there are some fascinating differences not picked up in the report – women, first in family and state educated students are less happy than peers, students in non-university halls are 10pp more likely to report poor value than those in university halls or living alone or at home, care experienced and estranged students are almost twice as likely to report poor value than their peers, and degree apprentices are 11pp more likely to report poor value than UGs.

    This is your regular reminder that an apprentice aged 21 in the first year of their apprenticeship is entitled to a princely minimum hourly rate of £7.55 an hour. Earn while you learn indeed.

    One thing that’s striking is a kind of Value for Money paradox – there’s a very strong relationship between negative impact of the cost of living crisis and VFM perceptions, and a good value “sweet spot” of working 10-15 hours (4 in 10 happy), with those working fewer or more hours less happy.

    I’d suggest we’re staring here at two “trapped” student profiles – those having to work so many hours that it’s ruining the experience, and those who need to work but are constrained by visa restrictions, health, lack of available employment, course demands or timetabling conflicts – leaving them financially stressed without the ability to address it.

    Grating expectations

    On expectations, bifurcation has been the big story in SAES in recent years – and this year’s no different. 26 per cent of students in 2025 report that their experience exceeded expectations – double the rate seen during the pandemic in 2021.

    But there’s been a corresponding rise in students whose experience was worse than expected too – 15 percent in 2025, up from 8 per cent in 2021.

    For students whose expectations weren’t met, it feels like time and money are the ones hardest to influence – 23 per cent cite less disposable income than expected, 18 per cent are taking on more debt than anticipated, and 17 per cent cite longer commutes.

    Academic issues were up there too, though – poor teaching quality (23 per cent), lack of support for independent study (23 per cent) and course disorganisation (20 per cent) are the notables. Analysis of the qual also suggests that loneliness should have been a box they could tick.

    And down in the splits there are some similar lessons to those seen in the VFM questions – again, only 18 per cent of those in non-university halls have had expectations met, over 10pp worse than those at home or living alone.

    I’ve had a few

    I’ve been following the “regret” question quite closely for a few years now – and I’m afraid to say that this year a record low of 56 per cent said they would make the same decision on course and university again. Significantly, those who would avoid higher education entirely has nearly doubled from 6 per cent to 11 per cent between 2024 and 2025.

    The factors underpinning that are much better explored in the Nicola Dandridge/University of Bristol deep dive we looked at a few weeks back, although sticking out like a sore thumb here are those working but under 10 hours (just 38 per cent would make the same choice), those doing Level 4 or 5 quals (on 46 per cent and 40 per cent respectively), and those with caring responsibilities, those that are themselves care experienced, those estranged and trans students – they languish down on 44, 39, 40 and 41 per cent “no regrets” respectively.

    Non-university halls also make another of their regular appearances – every other type of living arrangement averages out at between 55 and 59 per cent “no regrets”, while those in private PBSA are on 39 per cent. An astonishing 21 per cent of them would avoid HE altogether if they had their time again.

    Considered withdrawing (roughly two-thirds) and the reasons for that (mental health and cost of living) both remain stable – combined with the regret figures, they continue to suggest that the system is better at trapping students onto a conveyor belt than anything else.

    Can I have some more?

    Every year students are asked to make qualitative suggestions on what could be done to improve the quality of the student experience – eight major themes range from requests for more personalised academic support and timely feedback to calls for enhanced mental health services, financial assistance, and improved teaching quality.

    I won’t dwell on them here – suffice to say that almost all of them represent a direct collision between rising expectations and diminishing resources. Students are requesting precisely the kind of labour-intensive, personalised services that universities are routinely subjecting to “shrinkflation”.

    Smaller class sizes, one-to-one interaction with staff, detailed feedback, enhanced mental health support, and reduced fees for international students all feel like things doing in precisely the opposite direction – a potentially vicious cycle where quality is hit, that generates further dissatisfaction. They are not necessarily completely unaffordable – but they either reflect support expectations associated with an expected speed of completion not seen in many other countries, or degree structures which pile on too much pressure unnecessarily.

    That said, if you’re looking for something (anything) resembling good news here, it’s on aspects of teaching. Pretty much every characteristic tested – encouraged you to take responsibility for your own learning, clearly explained course goals and requirements, helpful and supportive, initiated debates and discussion are within margins of error at record satisfaction.

    Assessment feedback has reached new heights, with holistic feedback and draft work feedback achieving record scores – over 15 percentage points higher than 2018 levels. And assignment turnaround times have dramatically improved – 61 per cent are now returned within two weeks (up from just 33 per cent in 2022), exceeding evolving student expectations where 70 per cent expect two-week returns.

    Under pressure

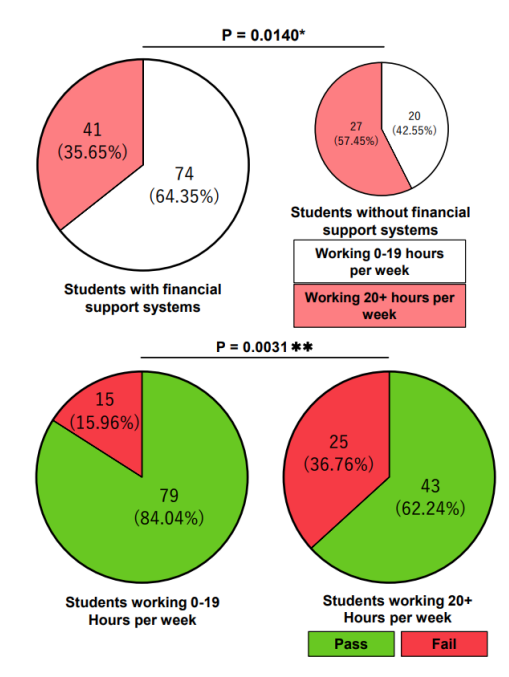
    The problems are in pressure and time. Contact hours are stable at 15-16 hours provided, 13 hours attended, but student satisfaction with contact hours has declined significantly by nine percentage points to its lowest level in a decade (excluding the pandemic blip).

    The data reveal that students generally value contact hours, with those having 10+ hours weekly showing greater satisfaction, but the key factor seems to be the rise in students working for pay. Students without paid employment show notably higher satisfaction with contact hours (64 per cent) compared to working students (57 per cent), suggesting that increased work commitments are creating challenges in balancing total time demands rather than dissatisfaction with the contact hours themselves.

    That pattern intensifies as students progress through their degrees, where they attend fewer contact hours while taking on more paid work responsibilities – and the decline appears linked to students’ difficulty managing their broader commitments, indicating a need for more flexible timetabling to help students balance their academic and work responsibilities effectively.

    That all results in this fairly alarming chart – not only is the amount of time spent in timetabled hours and independent study at its lowest in half a decade (24.2 hours), there’s a significant difference between those who work and those who don’t.

    Worse still, as I’ve noted before, the UK’s notional ECTS-to-hours ratio is already lower than the rest of Europe at 20 hours per credit (everyone else is on 25-30 hours) – these figures suggest that they’re somehow getting their degrees on 15 fewer hours studying than they’re supposed to be able to, all while being expected to complete 5.8 summative assignments per semester and 4.1 formative assignments – both at record highs.

    The pressures of work, what is starting to look clearly like over-assessment, cost of living and so on – all in a system and culture set up to get UGs through their degrees faster than pretty much every other country – will almost certainly be generating support demands, mental health issues and (Al related) “efficiencies” that are harming students’ health and learning.

    Hence wellbeing remains concerningly low, with only 14-18 per cent reporting high scores on key measures (life satisfaction, happiness, feeling worthwhile, and low anxiety) – half the levels seen in the general population. Students have very high, perhaps unrealistic expectations for institutional mental health support too – 40 per cent believe universities should provide comprehensive services including severe cases, and another 41 per cent expect preventative programs and counselling for less severe issues.

    Students with existing mental health difficulties, those significantly affected by cost-of-living pressures, trans students, first-years, and those studying in Scotland show even higher expectations, with nearly half (47 per cent) of students with mental health challenges expecting comprehensive university support.

    All about the money

    Back on money again, three-quarters of students continue to report that cost-of-living pressures have notably impacted their studies, nearly one-in-five students have taken on more debt than planned (particularly affecting home students), and other impacts include reduced spending on course equipment, lower participation in sports and societies, and increased commuting costs.

    The reduction in extracurricular activities is particularly worrying given existing student mental health challenges – and miserably, financial challenges mean that 6 per cent of home students selected a different course than they had planned to, and 7 per cent selected a different institution than they had planned to.

    This year there’s also a strange set of questions testing students’ attitudes towards maintaining, increasing or decreasing tuition fee levels with some associated quality trade-offs – it’s not clear that that tells us much given the range of other factors underpinning their value perceptions.

    Breaking points

    So what are we to make of all that? Similar to previous years, the data suggests a system under extraordinary strain – but this year’s findings suggest to me that we’ve crossed a threshold from manageable pressure into systematic breakdown.

    One way to understand what’s happening is through the lens of the Study Demands-Resources model we found in European student research. Eurostudent’s analysis distinguishes between stress-inducing demands (excessive workload, time pressure, financial obligations) and supportive resources (peer contact, teacher guidance, family support, adequate funding) – where wellbeing depends on the balance between these forces.

    The SAES figures suggest we’re witnessing unprecedented demand escalation alongside systematic resource depletion. Students face more assignments per semester (up 47 per cent since 2017), their capacity to engage has collapsed, independent study time has fallen below contact hours for many subjects, and the employment reality means students are operating at 44.3 total weekly hours while UK full-time workers average 36.6 hours.

    Another lens is Maslow. Universities are investing heavily in what I’ve previously described as self-actualisation interventions (creative assignments, intellectual debates, community building) while students struggle with basic physiological and safety needs. As I’ve noted before on here, when basic needs are unmet, higher-order educational experiences become impossible regardless of quality – and every extra hour of effort up the top of Maslow has diminishing returns.

    The control paradox is also troubling. We’re used to universities being held accountable for outcomes – retention, belonging, wellbeing, satisfaction, completion – that are increasingly driven by factors outside their control. Universities might perfect contact hour delivery, but students working extreme hours can’t attend. They can enhance support services, but working students can’t access them during traditional hours. I’m usually the first to argue that universities should look at what they can control – but the multi-car pile up of issues inside that which they can’t is starting to look overwhelming.

    Most troubling of all is what this all means for “full-time” study. Every student finance review and the credit system itself puts its meaning at 35 to 40 hours a week of academic work. 24.7 hours of actual academic engagement, with a record number of deadlines to hit is a 35 to 40 per cent shortfall. When “full-time” students operate at part-time academic intensity while longer hours than full-time employees, something has to give – their health, their wider intellectual and social development, academic integrity or all three.

    I’m also starting to worry profoundly about choice, equality and institutional mission. Take the Russell Group’s recent home student expansion. These are universities predominantly located in expensive cities, increasing their numbers (but not necessarily proportions) from lower tariff applicants and lower socioeconomic backgrounds. The mathematics are cruel – poor(er) students recruited to institutions they cannot afford to attend properly, forced into extreme employment that excludes them from the very experiences that make those institutions valuable.

    A two-tier system – where financially supported students engaging fully with campus life, relationships and opportunities, while “widening participation” students work 30-plus hours, miss relationship-building opportunities, and graduate with the same credentials but fundamentally different educational experiences. This isn’t inclusion, or positive choice – it’s a sophisticated form of educational inequality that maintains the appearance of social mobility while perpetuating class advantages.

    On this evidence, the efficiency imperative – on both universities and students – is harming what makes higher education valuable beyond qualification acquisition. The slow elimination of intellectual curiosity, community membership, personal development, and critical thinking is what distinguishes higher education from job training. It’s melting away.

    It all points at a need for much radical thinking than is on offer either in the SAES report’s recommendations or in the portfolio reviews and strategic collaborations being planned in documents like this. If nothing else, you can’t pull off a transformation and efficiency taskforce on provision without one looking at the student experience.

    The UK does, on admittedly shaky OECD evidence, have a curiously expensive way of delivering higher education. Unless the sector is prepared to be more radical over curriculum design, subject specialisation, assessment and credit acquisition, and be matched in maintenance and flexibility efforts by a government prepared to own the problems its predecessor created, it will continue down a fatal path – of demanding more and more from staff and students while paying the former less and less and charging the latter (through commercial debt and lifetime repayments) more and more.

    Source link

  • Colleges Support Student Financial Literacy Education

    Colleges Support Student Financial Literacy Education

    Students often consider the return on investment of their degree when deciding whether and where to enroll in college, but not every student receives financial education from their institution on how to turn a college education into a life-sustaining career. A 2022 survey by Inside Higher Ed found that 67 percent of students are not sure if their college or university offers personal financial education; an additional 9 percent said no programs or classes are offered regarding financial literacy.

    To rectify that, colleges and universities are implementing programs that promote students’ money management skills, increase their awareness of financial planning and help them understand the debts they may acquire while in school.

    What’s the need: Student debt has skyrocketed over the past 20 years, with 42.7 million student borrowers holding nearly $1.7 trillion in federal loans. The average student who takes out loans to attend a public university borrows $31,960 to attain a bachelor’s degree, and over half of graduates use federal loans at some point. Loan debt can limit students’ earnings after college and hinder their socioeconomic advancement.

    Even while students are in college, financial challenges can impact their persistence and outcomes. A 2024 survey by Trellis Research found that 71 percent of students experienced financial trouble while enrolled, and nearly half said their current financial situation made it difficult to concentrate on schoolwork.

    A lack of financial education can also exacerbate equity concerns. An April 2025 report from Education Northwest found that only 25 percent of students were able to answer three financial questions correctly, with students from low-income families and those younger than 21 even less likely to answer correctly. Similarly, Black, American Indian or Alaska Native, Hispanic or Latino, and Native Hawaiian or Pacific Islander students were less likely to answer financial literacy questions correctly.

    Inside Higher Ed highlights six institutions that have introduced innovative programs to combat financial illiteracy.

    1. Florida State University: Unconquered by Debt

    Housed within the university’s Gus. A Stavros Center for Advancement of Free Enterprise and Economic Education, FSU’s Unconquered by Debt program enhances student financial literacy to ensure graduates leave with the ability to advance their socioeconomic standing.

    The program walks students through crucial areas of financial planning including selecting a career, establishing healthy spending habits, investing, managing credit, ensuring assets and planning for retirement.

    Students can attend workshops on campus and enjoy free food and drinks while they learn more about money management and how to plan for their futures beyond college.

    The center recently hired an assistant director as part of a program expansion funded by the Office of the Provost.

    1. University of Miami: Money Management

    In 2019, the University of Miami created the Money Management Program to help build students’ short- and long-term financial well-being. The program has proven so successful in increasing student persistence that it has also received external grant funding, a university spokesperson said.

    Through workshops called Money Talks, the program addresses budgeting, credit and credit cards, loans, and debt repayment, as well as saving and investing. Students can also participate in half-day personal finance workshops on Saturdays throughout the academic year. The university hires peer coaches to provide confidential one-on-one coaching, to help prepare students for future careers in the finance world as well as bridge knowledge gaps for those who may need support.

    During the 2022–23 academic year, the university hosted over 240 Money Management events for more than 2,500 attendees, according to the spokesperson.

    1. East Carolina University: Financial Wellness Hub

    The Financial Wellness Hub at East Carolina University offers regular workshops on how to mitigate financial challenges while enrolled and helps students understand credit reports, debt management and student loan repayment strategies. The Hub caters services to various seasonal holidays, hosting a “Falling in Love With Credit” workshop for Valentine’s Day and “Spooky Credit Scores” for Halloween, as well as a budgeting workshop for gift giving during the winter holiday season.

    The Hub relies on relationship building and partnerships across the university to generate an audience for programs, director Kevin Sutton told Inside Higher Ed. Services are also available to alumni and staff, who in turn can better advise students or elect to contribute financially to the program’s budget.

    1. Penn State: Sokolov-Miller Family Financial and Life Skills Center

    Penn State established a center dedicated to managing financial wellness in college and beyond, which offers one-on-one coaching and workshops. In addition, the center provides students with access to a course on Canvas called MoneyCounts, which gives them a self-paced opportunity to engage in 28 modules on financial wellness.

    Other resources include live webinars, offered on the first and third Tuesday of each month at noon, which are recorded for those who can’t make it synchronously, and a free bookshelf stocked with financial wellness books— topics range from simple money skills to insurance—that is supported by Barnes & Noble.

    1. Babson College: The Babson Financial Literacy Project

    In addition to supporting current students, the BFLP is a nonprofit organization the ensures all community members can receive quality financial education. The program was developed by faculty at Babson and coaches lead online and in-person workshops, as well as train staff to deliver content on their own.

    Between its launch in fall 2018 and March of this year, the program has supported 418 workshops with 17,189 participants, according to the program webpage.

    In addition, participants can engage with various student organizations on campus to learn more about the world of finance, including the Babson Finance Association, Babson Scholars of Finance and Women in Finance.

    1. Western Washington University: Financial Wellness Badges

    At WWU, students can engage with the Merriman Financial Literacy program through workshops, online courses delivered via iGrad, peer mentorship and digital badging.

    Students can earn badges in such areas as financial mindfulness, investment, savings and credit, as well as budgeting and spending.

    To earn the financial mindfulness starter badge, for example, students must complete a financial wellness checkup and a money meditation on iGrad, then write a financial wellness journal entry. Each badge has three levels, from foundations to expert, building on students’ knowledge and signaling deep understanding of the topic.

    If your student success program has a unique feature or twist, we’d like to know about it. Click here to submit.

    Source link

  • Indian Student Handcuffed and Pinned to Ground at Newark Airport Before Deportation (One India)

    Indian Student Handcuffed and Pinned to Ground at Newark Airport Before Deportation (One India)

    A shocking video from Newark Airport shows an Indian student in handcuffs, pinned to the ground by U.S. authorities before being deported. The clip, shared by Indian-American entrepreneur Kunal Jain, has sparked outrage online. Jain described the young man as crying and being treated like a criminal, despite arriving with valid documents. He urged the Indian Embassy to intervene. Jain also claimed that similar incidents are now occurring frequently—3 to 4 deportations daily—often due to students being unable to explain their purpose in the U.S. properly at immigration.

    Source link

  • Which Universities Spend the Most on Student Services

    Which Universities Spend the Most on Student Services

    More colleges and universities are investing in support service offerings to increase student retention and graduation outcomes, but these interventions and offices come at a cost—one that is often subsidized by students.

    A recently published analysis from Studocu of data from the Integrated Postsecondary Education Data System finds that among four-year colleges and universities, most spent nearly $2,933 on academic supports and $4,828 on student services during the 2022–23 academic year. Across all institutions, the average expense per full-time equivalent student was $3,334 for student services and $4,198 for academic supports.

    The group analyzed over 1,000 degree-granting institutions across the U.S. that enroll at least 101 undergraduates. Institutions ranged from large, primarily online institutions to small liberal arts colleges. Community colleges and technical colleges were not included in the study.

    Academic support offerings were categorized as classroom-focused interventions, including tutoring centers, writing labs, academic advising and technology-enhanced learning tools. Student services included mental health counseling, career services, housing assistance and extracurricular programs, according to Studocu.

    The biggest spenders on academic supports were, not surprisingly, wealthy Ivy League institutions. Yale University spent the most on academic supports ($1.8 billion) in the 2023 fiscal year, followed by the University of Pennsylvania ($1.1 billion) and Harvard University ($1 billion), each of which has an undergraduate population of less than 10,000.

    Per student, Yale invested $225,000, Harvard spent $132,000 and Penn spent $105,707 on academic interventions.

    Next in line were two public institutions: the University of Washington at Seattle, which spent $844 million for 30,000 undergraduates, or $28,133 per student, and the University of California, San Diego, which spent $844 million for 32,800 undergraduates, or roughly $25,732 per student.

    Looking at student services, some of the institutions that spent the most were those with substantial online student bodies, including Grand Canyon University ($504 million), Southern New Hampshire University ($435 million), Liberty University ($289 million) and Arizona State University ($243 million).

    But Yale spent the most per capita, investing $53,000 per student in nonacademic programs, followed by the California Institute of Technology and the U.S. Naval Academy, which spent $41,000 and $36,000 per student, respectively.

    The analysis also revealed a positive correlation between dollars spent per student and graduation rates, which researchers said suggest well-funded support services provide meaningful benefits, particularly for students who might otherwise be at risk. However, the data does not capture the privileges of socioeconomic advantage that may supplement on-campus offerings, nor the likelihood of students to graduate regardless of support offerings due to selective admissions processes.

    Students foot the bill: The high level of investment in student supports contrasts with the revenue the average student produces. The average public college received about $8,720 net revenue in tuition and fees per full-time-equivalent student in 2021, and the average private nonprofit received $23,900, according to the National Center for Education Statistics.

    A growing number of colleges and universities are embedding student service fees into tuition costs to fund support offerings, particularly health and wellness resources.

    James Madison University, which spends around $1,620 per student on support services and $3,220 on academic resources, charges $5,662 in student fees, among the highest in the nation, according to a Sportico analysis. Nearly half ($2,362) of that fee goes directly to athletics funding, Sportico reported.

    Harvard charges $3,676 annually for student services as part of the cost of attendance, a fraction of its total spend per student ($163,000). The Massachusetts Institute of Technology bills students $420 annually for student clubs and organization funding, as well as fitness activities—about 2 percent of the total dollars invested in student supports. Caltech charges $2,586 in fees, while the Naval Academy does not charge tuition.

    The University of Pennsylvania lists $8,032 in fees in its estimated costs of attendance, but it’s unclear which expenses students are paying for with those fees.

    Yale does not differentiate student fees in tuition prices, grouping lab, library and gymnasium costs into a student’s tuition package. Similarly, UCSD and UW do not have additional fees associated with the cost of attendance.

    We bet your colleague would like this article, too. Send them this link to subscribe to our newsletter on Student Success.

    Source link

  • A change agenda for the commuter student experience

    A change agenda for the commuter student experience

    In February, we launched our commuter student series, seeking to uncover how universities are responding to the increasing numbers of commuter students – students who continue to live at home whilst studying, rather than relocating to attend university, in contrast to “traditional” residential students.

    We sought to increase the visibility of commuters and share best practice, responding to demand for thought leadership and evidence-based interventions, with the aim of influencing pedagogy, practice and policy, within institutions and nationally.

    The series also followed the inclusion of commuter students on the Office for Students’ Equality of Opportunity Risk Register in England as a distinct group who experience inequality of opportunity.

    In our final article we look back at the series, reflecting on key learnings, before looking forward, setting out a change agenda for commuters that will make higher education more accessible, attractive and available to all.

    Commuter students are everywhere yet invisible

    Commuter students are part of every UK university.

    The proportion of commuters varies by institution – research by Susan Kenyon using 2022 HESA data, shows a range from 12 to 85 per cent.

    As such commuters need to be counted and made visible, acknowledged in pedagogy, policy and processes and, where necessary, considered as communities at risk in Access and Participation Plans (APPs) in England.

    And despite being everywhere, commuters can often be invisible and underserved.

    Earlier in the series Val Yates and Carolyn Oulton discussed how to build an institutional agenda for change by making commuters visible. Their agenda was one where commuters are embedded across the institution. Commuters don’t interact only with their lecturers – supporting commuters lies with academics, across professional services and into teams like IT and sustainability.

    We explored the diverse definitions of commuters in APPs, which often makes measuring progress difficult. In supporting commuters, it’s important we know we’re talking about the same group of students. Expanded definitions have considered those who live locally, use transport, have the same term time and home address but also those who relocate but live further away due to cost and housing pressures.

    Commuters need to be visible to their institution first before making them visible to each other through access programmes, networks and student societies.

    Commuter students are valuable

    Our series also reveals the cultural, educational and social value of commuters to our learning community.

    Commuters are passionate, engaged and committed. They bring diverse perspectives, experience and expertise to the classroom. As Martin Lowe, Adrian Wright and Mark Wilding write, they “are not just students, they are employees, caregivers, and active members of their communities,” bringing skills such as time management and the ability to balance multiple responsibilities, alongside discipline and an internal motivation to learn that can inspire and influence other students.

    And as Emma Maslin highlighted, there is a tendency to see commuters from a deficit perspective, as a disadvantaged group, whose experience needs to be “fixed.”

    Our authors don’t deny the academic, financial and social difficulties of being a commuter in a world designed for residential students, particularly when, as Elise Thornton discusses, commuting is often a financial necessity, rather than an active choice.

    But the opportunity to attend university as a commuter student can allow students to maintain community, employment and relationships that they value, whilst learning.

    Articles by Molly Pemberton and Susan Preston emphasise how valuable commuter students are to the wider student community. Commuters are campaigning for changes in policy, practice and spaces that reshape the university experience and bring benefits to all students.

    A common theme running throughout the series is that changes made to pedagogy, policy and processes, which initially aim to create a more inclusive environment for commuter students, benefit all students. And a lot of the time, they’re changes driven by students themselves.

    In designing services and learning for commuters, we’ve seen Tom Perou discusses the universal benefits of podcasts, which provide bite-sized learning in an alternative format; Kulvinder Singh described the importance of enhancing belonging in the classroom; and Susan Kenyon and Flic Lindo stressed the importance of improving information on the “rules of the game” and demystifying the “hidden curriculum.”

    Commuters are in the city

    In the traditional residential model, students remain largely in their defined area. But commuter students are integrated into the wider fabric of communities.

    Finding out where commuters are is often a good first step. David Kernohan analysed HESA data to help us understand what constitutes a local student and if local students aren’t going to your provider, where are they going?

    It’s common that local authorities don’t know how many students live locally, have relocated or are registered to vote, all of which inhibits the design of services to meet students’ needs. In the context of transport providers, bus fares and transport routes often don’t serve commuters because they don’t first understand that population.

    Joel Dowson’s article takes this further, outlining how universities and their students’ unions can leverage the financial value of students to transport providers, in terms of revenue and potential gains from reduced road congestion. At the Greater Manchester Student Partnership they have been lobbying for an improved commuter student experience, influencing the affordability and availability of transport services, to the benefit of all students.

    A commuter change agenda

    The aim of this series was to empower everyone in HE, whatever their role, to have a better understanding of the needs of commuter students.

    And as our contributions have evidenced, work happens everywhere – in professional services, in the classroom, in regional advocacy and with students.

    When thinking about where the work starts, it might be at your desk. There’s four categories to our change agenda, drawing on contributions from authors across the series: in the classroom, at the institution, with students and in national policy.

    In the classroom

    Supporting commuters in the classroom is about making them feel seen and making them visible to each other. Active pedagogies develop belonging and on-commute learning options such as podcasts, pre-recorded lectures or flipped learning are examples of inclusive learning delivery. Creating a reason to attend and articulating the benefits to students is important to sustain engagement.

    At the institution

    Institutions need to count commuters, then research, listen and review policies to ensure they work for all students. Practical steps include things like student-centric timetabling, consistent and empathetic attendance policies, providing clear information to commuters on application and offering accommodation options so that students can engage beyond the classroom. Institutions have influence with local governments and transport authorities and can be an effective conduit for making the city more commuter student friendly. And institutions can work towards building institutional empathy so colleagues understand that a lack of engagement may not be laziness, it may be a delayed bus or a train fare hike.

    With students

    Many APP interventions included co-creating solutions with students rather than for them which is undoubtedly the best step forward. It was students who led the way to making a commuter student lounge at Leeds University through the sharing of university rooms, giving them ownership, space and agency. In any project, involving commuters beyond consultation leads to successful interventions and outcomes.

    On a national level

    Measuring progress is difficult with different and diverse definitions, the sector needs to start with a shared agreement of who this student group is and how to measure them.

    The engagement barriers universities face are often tied to the cost of living crisis. Transport fares are expensive, so commuters make tactical, tough decisions about when and how to engage. Responding to consultations and calls for evidence on key transport policy with commuters helps shift transport service design in favour of students. And institutions are key agents in making change on a national level – at Sheffield Hallam SU, it was their VC support that got students in the room with their mayor to discuss bus prices.

    Whether it’s student-centric timetables, creating a commuter student lounge or working with the local transport authority, individuals across institutions want to feel empowered to enhance the commuter student experience themselves. So as institutions better understand, count and make visible the commuter student experience, the next step is for the work to start. And small things make a difference, simply talking about commuters in the classroom helps build community. Students experience enough delays on public transport, they don’t want to see the same delays happening with support at their institutions.

    Since publication, John Blake, Director for Fair Access and Participation at the Office for Students told us:

    Commuter students can sometimes get forgotten in the discourse around higher education. Yet they make up a significant proportion of the student body at all institutions, and at some comprise over three quarters of students. That’s why I really welcome Wonkhe’s focus on this issue. This series has helped identify who commuter students are, the enormous amount they add to the institutions where they study, and the work institutions are doing to support commuter students to get the most from their studies. The OfS has included commuter students in our equality of opportunity risk register, and a number of institutions are working with these students to develop creative solutions to some of the challenges they might face to access and succeed in higher education.

    Thank you to all the contributors to the series, if you would like to discuss supporting commuters in more detail, please do reach out to Susan Kenyon.

    Click here to read the rest of our commuter student series.

    Source link

  • U.S. Judge Rules Colleges Can Directly Pay Student Athletes

    U.S. Judge Rules Colleges Can Directly Pay Student Athletes

    Michael Reaves/Getty Images 

    Federal district judge Claudia Wilken granted final approval to a multi-billion-dollar settlement in the yearslong House v. NCAA lawsuit late Friday evening, effectively transforming college sports: Starting July 1, institutions will be allowed to pay student athletes directly.

    In accordance with the settlement, the National Collegiate Athletic Association and colleges in Division I conferences will distribute nearly $2.8 billion in back damages over the next 10 years to athletes who competed any time since 2016, as well as to their lawyers. The case also allows each college that opted in to pay their athletes collectively up to $20.5 million per year, in addition to scholarships. That figure will increase incrementally over time.

    The ruling, which technically resolves three antitrust lawsuits against the NCAA, essentially turns student-athletes from amateurs into professionals. But experts say this isn’t likely to end court battles over athletics. The creation of the revenue-sharing model (where schools distribute money earned from areas such as media rights or merchandise), combined with existing turmoil over the regulation of name, image and likeness (NIL) deals, will only invite more lawsuits, they say. 

    “The judge said, in essence, this is not a perfect settlement that solves everyone’s concerns, but it makes progress towards ‘righting the wrongs’ of higher education’s desire to maintain amateurism status for the players but no one else,” Karen Weaver, adjunct assistant professor in the graduate school of education at the University of Pennsylvania, wrote in an email to Inside Higher Ed.

    Although many colleges began making changes to their programs in anticipation of the settlement’s approval, the timing of the ruling could present logistical challenges as they move to start revenue-sharing with students from the July 1 deadline set out in the suit. 

    Current and former athletes have celebrated the ruling. 

    “It’s historic,” former college basketball star Sedona Prince, a co-lead plaintiff in one of the lawsuits, told ESPN. “It seemed like this crazy, outlandish idea at the time of what college athletics could and should be like. It was a difficult process at times … but it’s going to change millions of lives for the better.”

    Wild West Yet to be Tamed

    Judge Wilken’s ruling comes nearly two months after both parties presented arguments in early April for approving the settlement, and nearly five years after the suit was first filed in 2020. But contentious debates over how to manage paying student athletes really erupted in 2021, when NIL deals were first legalized. 

    Since then, collectives made up of alumni and boosters have paid athletes millions of dollars to play at schools through unregulated NIL partnerships. Top football and basketball players have earned the most.

    College leaders have argued that the collectives could give wealthier institutions an unfair recruiting advantage. The House settlement, which not only allows colleges to pay athletes directly but also gives conferences the power to regulate booster influence, could help solve that problem.

    “For several years, Division I members crafted well-intentioned rules and systems to govern financial benefits from schools and name, image and likeness opportunities, but the NCAA could not easily enforce these for several reasons,” NCAA president Charlie Baker wrote in a statement Friday. “The result was a sense of chaos: instability for schools, confusion for student-athletes and too often litigation.”

    “The settlement opens a pathway to begin stabilizing college sports,” Baker said. “This new framework that enables schools to provide direct financial benefits to student-athletes and establishes clear and specific rules to regulate third-party NIL agreements marks a huge step forward for college sports.”

    The settlement also establishes a new clearinghouse, run by Deloitte, that will vet any endorsement deal between a booster and an athlete worth more than $600, with the goal of ensuring it is for a “valid business purpose.”  

    Still, doubts remain about how the watchdog will work; one commenter on X noted that all it takes for boosters to create an NIL regulatory loophole is to pay athletes in multiple $599 payments rather than one mass sum

    Despite the efforts to regulate NIL payments through the clearinghouse, Weaver said the settlement will create “a feeding frenzy of agents and dealmakers capitalizing on a few athletes wealth while schools scramble to lock down players who could bolt for a better offer at any moment.”

    “I expect to see the first Title IX lawsuits, and requests for an immediate stay, filed as soon as this week,” she said. “It’s important for higher education leaders to understand the far-reaching impact on our industry—it’s only just begun.”

    Source link

  • Housing Program Increases Student Success in Calif.

    Housing Program Increases Student Success in Calif.

    An estimated 20 percent of college students experience housing insecurity and 14 percent experience homelessness, according to fall 2024 data from Trellis Strategies. Yet many colleges are ill-equipped to address student housing concerns, particularly institutions with nonresidential campuses or those that serve adult learners.

    The state of California created an initiative in 2020 to provide housing and short-term support to students who were experiencing housing insecurity while enrolled at one of the three public systems—the California State Universities, California Community Colleges or the University of California.

    A recently published analysis of the state’s College Focused Rapid Rehousing (CFRR) program identified promising practices and lessons learned from the pilot. The study—authored by the Center for Equitable Higher Education (CEHE) at California State University, Long Beach—found that students who participated were more likely to remain enrolled and graduate compared to their peers, and a majority had established stable housing one year later.

    The background: Passed in July 2019, Assembly Bill 74 allocated funding for college-focused rapid rehousing programs, which give students rental subsidies, moving assistance, wraparound supports, case management and emergency grants. The community college system received $9 million, CSU $6.5 million and UC institutions $3.5 million to invest in long- and short-term initiatives, depending on each system’s unique student needs.

    According to 2023 data included in the report, over half of CSU students and 65 percent of CCC’s who receive financial aid experience housing insecurity. One-quarter of CCC students and 11 percent of CSU students experienced homelessness during the 2022–23 academic year.

    The CEHE study evaluated the program over three years at eight CSU campuses and two community colleges. In total, 639 students participated in CFRR across the 10 institutions, and 3,949 received short-term assistance—often in the form of an emergency grant—from spring 2020 to spring 2024. Approximately 540 students fell into both categories, receiving short-term support before enrolling in CFRR.

    Some historically underserved populations were more likely to participate in CFRR: Black students and former foster youth were heavily overrepresented relative to the general population, and first-generation, transfer and returning students were also overrepresented to a smaller degree.

    Addressing housing insecurity: The program was successful in its goal of mitigating homelessness for enrolled students. After engaging with CFRR, participants experienced substantial housing stability, with an average of nine consecutive months of housing.

    In addition, a majority of students who left the program graduated (27 percent) or reached permanent housing (27 percent), while 15 percent failed to meet academic requirements, which is a common barrier to sustaining housing assistance.

    The greatest share of students (37 percent) were placed in stable housing in less than six months, though one-third took over 12 months to get housing from a community partner. The breakdown highlights the challenges in placing students in viable housing options, according to the report. However, two-thirds of surveyed students (n=181) said they believe they had been housed relatively quickly.

    One year after exiting the program, a majority of participants indicated that they were residing in an apartment or home that they directly leased or owned. Eighteen percent lived with a family member.

    Students credited the program with supporting their long-term success; 71 percent of survey respondents agreed or strongly agreed that their current housing situation was better because of the assistance they received.

    However, many still struggled with financial insecurity. Sixty-two percent said it was difficult to pay increased rent in the first year after exiting the program, and 25 percent underpaid or missed at least one rent payment during this period. Three in 10 said they had to move more than twice due to financial difficulties, and one-quarter of program graduates reported at least one episode of homelessness.

    Impacting student success: In addition to meeting students’ basic needs, the program had a demonstrated effect on persistence and attainment rates.

    Participants were more likely to remain enrolled or graduate (56 percent) compared to students receiving short-term housing assistance (47 percent). At CSU, CFRR students graduated within four years at higher rates than the broader CSU population (43 percent versus 35.5 percent), as well.

    Data also pointed to the impact housing crises can have on students’ academic performance, with housing-insecure students reporting their lowest GPA the semester they engaged in support interventions and the semester following.

    A graph showing the average GPA of CFRR participants compared to their peers who received short-term assistance from their institution.

    Twelve months after receiving assistance, CFRR students were significantly less likely to stop out of school compared to their peers who received just a short-term housing subsidy. Survey data showed students were more likely to engage in school activities, but a majority (70 percent) still held jobs to pay for college, working an average of 25 hours per week. Eighty percent of CFRR participants said they had difficulty balancing school and life responsibilities.

    Program participants were also more likely to be employed six months after entering housing (70 percent) versus three months before entering the program (56 percent).

    Housing insecurity can damage students’ mental health and in turn affect their persistence in higher education. At intake into CFRR, 76 percent of participants said they felt lonely, but that number dropped to 63 percent in follow-up surveys. Just under half of housing-insecure students experienced serious psychological distress at intake, while closer to one-third indicated distress at follow-up. These numbers remain elevated compared to the total student population at CSU, where 20 percent experienced serious psychological distress.

    The program also increased students’ emotional and mental resilience. Students rated their ability to handle personal problems higher after securing housing as well, from 33 percent to 52 percent during follow-up.

    If your student success program has a unique feature or twist, we’d like to know about it. Click here to submit.

    Source link