

Paul T. Corrigan teaches at The University of Tampa. He is currently writing a book on teaching literature. He has published on teaching and learning in TheAtlantic.com, The Chronicle of Higher Education, Inside Higher Ed, College Teaching, Pedagogy, Reader, The Teaching Professor, International Journal for the Scholarship of Teaching and Learning, and other venues. He has a PhD from the University of South Florida and a MA from North Carolina State University. More at paultcorrigan.com. Follow on Twitter at @teachingcollege.
Tag: survey
-
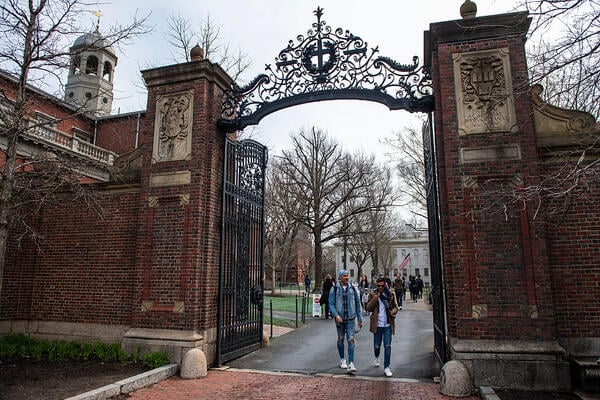
New Survey Measures Student Academic Flourishing in College
A new survey will collect data on academic flourishing among students enrolled in colleges and universities.
Joseph Prezioso/AFP/Getty Images
For prospective students looking to enroll in higher education, there are a variety of institutional factors to consider, among them location, course of study, cost of tuition and campus culture. Various sets of rankings provide additional information that might matter to students, such as spending on research or socioeconomic mobility for graduates.
But one key outcome of higher education remains underappraised, according to Tyler VanderWeele, a professor of epidemiology and biostatistics at Harvard University and director of the Human Flourishing Program: a student’s personal growth.
Many institutions publish lofty mission statements that connect the learning experience to students’ personal growth, leadership skills, vocation and sense of purpose upon graduation. But beyond anecdotal testimony, there are few measures to understand the influence of colleges and universities on student flourishing.
Next spring, Harvard University and Wanderweele are launching a new assessment tool as part of the Human Flourishing Program. The Flourishing Data Collaborative survey asks students to reflect on their college experience and provide their home institution with feedback as to what’s working and what needs additional intervention to affect student thriving.
What’s the need: Researchers created the survey in part to encourage colleges and universities to consider flourishing and student development a core function of the institution.
“I really do believe that what we measure shapes what we discuss, what we aim for, what policies are put in place to achieve those aims,” VanderWeele said. “So the very act of measurement, in some sense, itself constitutes an intervention and might help colleges and universities better pursue this.”
The assessment is not designed as a replacement for other measures of student success, including job placement or retention rates, Wanderweele noted. But sometimes a focus on ranking metrics can shift institutional priorities in a way that neglects the human-centered mission of postsecondary education, he said.
“For example, U.S. News & World Report rankings [have] very much shaped higher education, and people pay a lot of attention to this, but I think it’s also reoriented colleges and universities to specific metrics and ends that will help them go up in those rankings,” VanderWeele said. “Is it really the most important thing how much money has been spent on new student center facilities?”
The program also wants to better understand the role of higher education in promoting student well-being. Large numbers of young people report feeling on edge, lonely, unmoored or directionless, according to a study from Harvard’s Graduate School of Education. To get at this question, the survey asks about a learner’s sense of happiness and meaning and their financial security.
How it works: After promising results from pilot surveys conducted at the University of North Carolina at Chapel Hill, Harvard and Campus Bio-Medico University of Rome last year, the annual survey will launch in spring 2026, allowing first-year students to have at least one semester of undergraduate experience under their belts. Learners will respond to 24 questions ranging from “to what extent has university life helped you pursue truth?” to “to what extent has university life helped you to better lead a moral life?”
VanderWeele hopes the survey will serve as a reflection tool for students to consider how education has contributed to their development, but also where they can be self-motivated to improve their well-being.
After data collection is complete, each institution will receive a 50-page report and a dashboard with their survey results, allowing them to filter by specific data points.
What’s next: Presently, the program is recruiting member institutions to participate in the survey and engage in a community of practice, Wanderweele said. The goal is for institutions to gain insight about their current practices, or even assess interventions across several surveys, but also to learn from their peers.
“Our goal with this is not to differentially rank institutions, but to help each of these institutions come together, reflect on their strengths [and] areas for growth and to learn from one another in these different ways,” VanderWeele said.
Institutions will pay an annual $10,000 membership fee to participate, which VanderWeele said is a similar rate to other survey offerings of this kind.
Approximately 20 colleges have indicated interest in membership and another 100 have signed up for an upcoming webinar on Aug. 20 for additional information. VanderWeele said he is hoping a few dozen colleges and universities join the initiative this year.
In addition to providing institution-specific insights and policy recommendations, VanderWeele and his team hope to use survey results to conduct research on human flourishing in higher education in general.
Get more content like this directly to your inbox. Subscribe to the Student Success newsletter here.
This article has been updated to correct the spelling of Tyler VanderWeele’s last name.
-
Call to promote university racism survey – Campus Review
Picture: Australian Human Rights Commission wesbite
The Australian Human Rights Commission’s landmark Racism@Uni survey will appear in student and staff inboxes from August 11.
Please login below to view content or subscribe now.
Membership Login
-
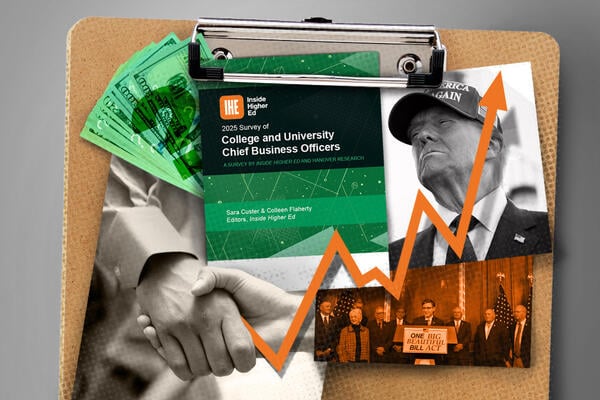
College business officers survey finds risks, resilience
The latest Inside Higher Ed/Hanover Research Survey of College and University Chief Business Officers, released today, reveals concerns about near-term uncertainty and financial sustainability—buoyed by confidence in the longer-term outlook.
One of the most significant findings is that federal policy uncertainty has created difficulties in conducting basic financial planning as the Trump administration has introduced a flurry of changes impacting federal funding for higher education, international students, how students pay for college and more.
That uncertainty, experts noted, has had a palpable effect on the sector.
“Chief business officers like certainty, whether it’s certainty about revenue streams or potential costs,” said Kara Freeman, president and CEO of the National Association of College and University Business Officers. “And right now they just are not getting it and that leads to anxiety.”
The annual Survey of College and University Chief Business Officers, now in its 15th year, offers insights from financial leaders at 169 institutions in 2025, both public and private nonprofits. Responses were gathered in April and May.
Amid the uncertainty, about three in five CBOs (58 percent) rate their institution’s financial health as good or excellent, with differences by institution type.
Pressure Tests
In last year’s survey, 56 percent of CBOs expected that their institution would be in better financial shape a year later. That number fell to 43 percent in this year’s survey, which asked the same question.
CBOs who believe their institution will be worse off financially next year cited concerns about the federal policy/funding environment for the sector (82 percent), potential increases to nonlabor operating costs (67 percent), rising labor costs (67 percent) and general economic concerns (62 percent).
More on the Survey
On Wednesday, Aug. 20 at 2 p.m. E.T., Inside Higher Ed will present a free webcast to discuss the results of the survey, with experts who can answer your most pressing questions about higher education finance—including how to plan effectively amid the current financial and policy uncertainty. Please register here.
The 2025 Survey of College and University Chief Business Officers was made possible by support from Strata Decision Technology and CollegeVine.
Inside Higher Ed’s 15th annual Survey of College and University Chief Business Officers was conducted by Hanover Research. The survey included chief business officers, mostly from public and private nonprofit institutions, for a margin of error of 7 percent. The response rate was 7 percent. A copy of the free report can be downloaded here.
Larry Ladd, a subject matter specialist at AGB Consulting, noted that colleges are taking a number of measures to protect themselves in the short term, such as delaying building projects, freezing hiring and/or travel, and pulling other levers to protect themselves this coming fall.
“You’re seeing colleges do everything they can to preserve their liquidity,” Ladd said. “The biggest reason to do that of course is that they don’t know what their fall enrollment will be.”
Of particular concern, he noted, is the potential for disruption to federal financial aid funds, given mass layoffs at the Education Department, which has raised concerns about disbursement. Just 12 percent of CBOs support the elimination of the department.
Other possible signs of caution: On deferred maintenance, 63 percent of respondents said that their institution was poised to fund less than a quarter of identified needs in the then-current fiscal year. Some 24 percent said their institution was freezing hiring to control costs for students; another 62 percent said their institution would consider doing this.
Despite these challenges, respondents were much more confident in their institution’s five- to 10-year outlooks, with 73 percent believing their college or university will be financially stable over the next five years and 71 percent expressing that same level of confidence over the next decade. For reference, in 2024, 85 percent of CBOs were confident in the five-year outlook, and 73 percent in the 10-year outlook.
Some 11 percent of CBOs say senior administrators at their institution have had serious internal discussions in the last year about merging with another college or university, about the same as last year’s survey. Most of these CBOs indicate such conversations are about proactively ensuring the institution’s financial stability rather than risk of imminent closure.
Another 16 percent of CBOs report serious internal discussions about consolidating some programs or operations with another college or university. Two in five (42 percent) say it’s highly likely that that their college will share administrative functions with another institution within five years. CBOs in the Northeast, with its relative concentration of institutions, are especially likely to say so, at 63 percent.
Beyond the Fog
Ruth Johnston, vice president of NACUBO consulting, said that while business officers may be stressed by the immediate pressures, they are confident in their scenario planning for the future.
“I think we’ll figure it out. Higher ed, even if it’s slow to change, is resilient. So I expect that we’re going to see new, creative solutions that will help bolster higher education,” Johnston said.
That said, just 28 percent of CBOs described themselves as very or extremely confident in their institution’s current business model. Another third expressed moderate confidence.
View online
Top issues for those CBOs with just some or no confidence in their institution’s business model: lack of diverse revenue streams (64 percent of this group), ineffective cost containment and/or operational efficiency (54 percent), and insufficient cash reserves for “rainy days” or strategic investments (50 percent).
Tuition discounting is another standing concern. Among all CBOs, more than half (54 percent) are at least moderately concerned about the financial sustainability of their institution’s tuition discount rate; two in 10 (21 percent) are highly concerned. Similarly, 50 percent of CBOs are at least moderately concerned about the sustainability of their institution’s tuition sticker price increases. In both cases, private nonprofit CBOs are the most concerned, by sector.
Respondents also saw government efforts to influence institutional strategy and policy as an increasing risk to their institutions, with 71 percent registering this as a concern. That number is up slightly from last year’s 65 percent.
CBOs in 2025 were much less concerned about donor efforts to influence institutional strategy, with 16 percent worrying that this amounts to an increasing financial risk to their college or university.
Internally, at least, some 81 percent of CBOs agree that they have sufficient agency influence within their institution to ensure its financial stability. Most also report a strong working relationship with their president, and understanding among trustees of the financial challenges facing their institution.
Survey respondents were notably concerned about federal student aid policies, overwhelmingly picking that as the top federal policy-related risk over the next four years, at 68 percent. Some experts suggest that concerns about other federal policy matters may have been heightened if the survey were administered after the One Big Beautiful Bill Act passed earlier this month. It included major changes for higher education as well as cuts to other public programs that could have downstream effects on the sector.
“There are both direct and indirect implications of the bill, some of which have not fully been explored by colleges and universities,” Ladd said. “I think of the Medicaid cuts—even those will have implications for colleges and universities.”
When asked about general financial risks to their institution over the next five years, many CBOs—especially those at publics—flagged state and federal policy changes, along with state and federal funding reductions. Enrollment declines, rising personnel costs and infrastructure and deferred maintenance costs also registered.
As for what would most improve their institution’s financial situation and sustainability, CBOs’ top responses from a list of options were: growing enrollment through targeted recruitment and improved retention programs; optimizing operational efficiency through process improvement and strategic cost management; and—in a more distant choice—forming strategic partnerships with employers, community organizations and/or other educational institutions. Cutting faculty and cutting staff were especially unpopular options.
Asked about value and affordability, CBOs largely agreed that their institution offers good value for what it charges for an undergraduate degree (93 percent) and that its net price is affordable (88 percent). Two in three (65 percent) said their institution has increased institutional financial aid/grants in the last year to address affordability concerns.
The survey also found that CBOs are increasingly using artificial intelligence. Nearly half of respondents—46 percent—indicated that AI helps them make more informed decisions in their role. That number is up from 33 percent in last year’s survey.
Despite that uptick, respondents at most institutions aren’t all-in on artificial intelligence yet. Only 6 percent reported that their college has made a comprehensive, strategic investment in AI. But many are experimenting: 39 percent of CBOs noted that their institution is in the early exploration phase with AI, while another 28 percent are piloting such tools in select departments.
“AI is here to stay,” Johnston said.
-

National Student Survey 2025 | Wonkhe
After a few years of rapid changes and exogenous shocks we are pretty much back to normal on the national student survey.
The 2025 results tell an overall tale of graduate improvement – of students being generally content that they are getting what they have been led to expect (or, for the cynics, having modulated their expectations appropriately), and of a sector where the majority of students are content with pretty much every area of their academic experience.
The positivity is always worthy of noting as it balances out a popular image of unhappy students, poor quality courses, and failing universities. The inconvenient truth is that UK higher education as a whole is pretty good, and remains so despite the efforts and fervent wishes of many.
Overall
The main utility of the National Student Survey is to draw gentle but persistent external attention to the kind of internal problems that decent providers will already be aware of. If you know, for example, there is a problem with students receiving timely feedback on your undergraduate architecture course, the temptation in these times of budgetary restraint may be to let it slide – a negative NSS finding focuses attention where it is needed.
Michelle Donelan (where is she now?) famously took against the framing of students being “satisfied” in her jeremiad against the old NSS – but the NSS has, since inception, acted as a tool to get students some satisfaction.
Our first chart looks at the four home nations and the UK as a whole – you can examine subject areas of interest at three levels, choose to see registered or taught students, of all undergraduate levels and mode, and filter out areas with low response numbers. From this we learn that food and beverage studies is probably the most challenging course in the UK, with 94.8 per cent of respondents responding positively to question 4 (“how often does your course challenge you to achieve your best work”).
In Wales, medical technology students were least likely to be positive about the fairness of marking and assessment. In England, maritime technology students are least likely to feel their student union represents them. To be clear, at CAH3 we are often looking at very small numbers of students (which may pertain to a single course in a single provider) – cranking things up to CAH1 means we can be much more confident that veterinary science students in Scotland find their course “intellectually stimulating”.
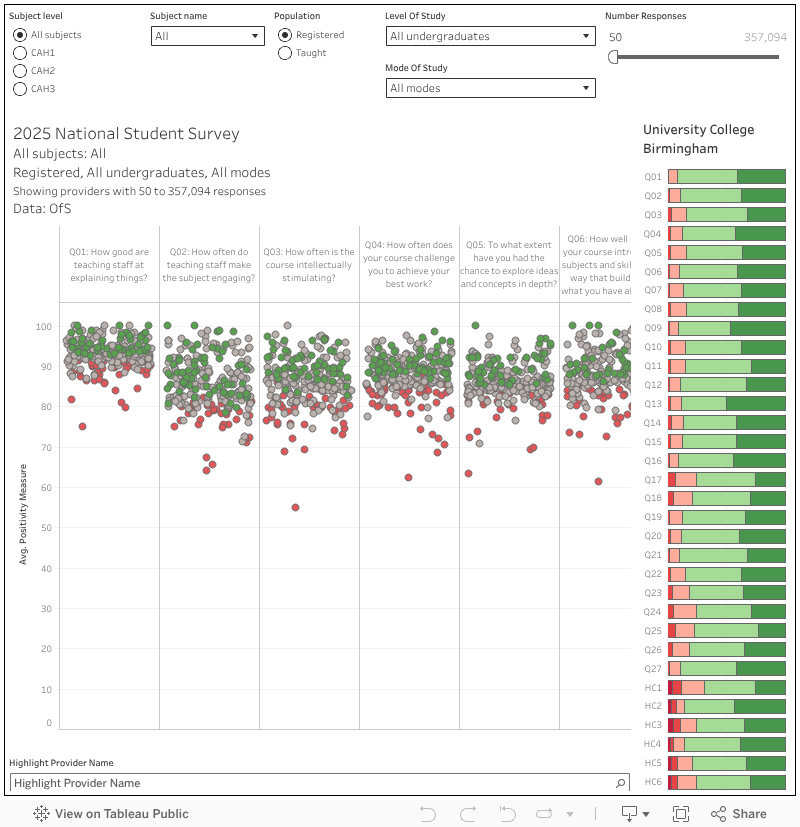
By provider
It gets interesting when you start comparing the national averages above to subject areas in your provider, so I’ve built a version of the dashboard where you can examine different aspects of your own provision. I’ve added a function where you click on a subject dot it updates the bar chart on the right, offering an overview of all responses to all questions.
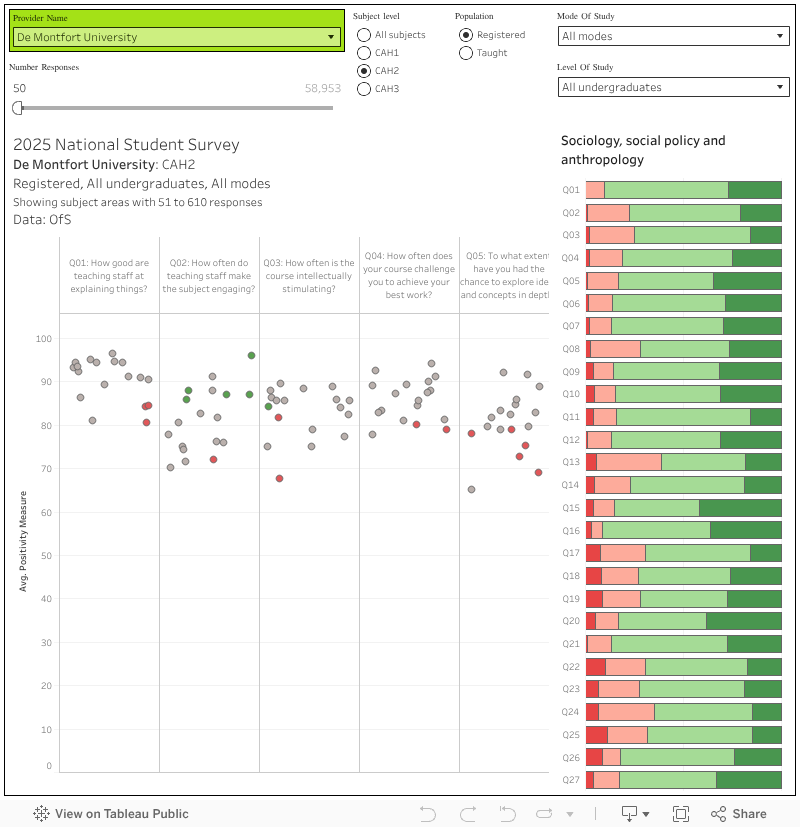
This helps put in perspective how cross your computer games and animation students are with your library resources – it turns out this is a national problem, and perhaps a chat to a professional body might be helpful in finding out what needs to be done
Of course, there’s a whole industry out there that uses NSS results to rank providers, often using bizarre compound metrics now we don’t have an “overall satisfaction” question (if you’ve ever read nonsense about nursing students in a provider being the most satisfied among modern campus universities in the East Midlands then this is how we get there).
There is a value in benchmarking against comparators, so this is my gentle contribution to this area of discourse which works in the same way as the one above (note that you need to select a subject area as well as a subject level). For the people who ask every year – the population sizes and response numbers are in the tooltips (you can also filter out tiny response numbers, by default I do this at fifty).
I’ve not included the confidence intervals that OfS’s dashboard does because it simply doesn’t matter for most use cases and it makes the charts harder to read (and slower to load). You should be aware enough to know that a small number of responses probably doesn’t make for a very reliable number. Oh, and the colour of the dots is the old (very old) TEF flags – two standard deviations above (green) or below (red) the benchmark.
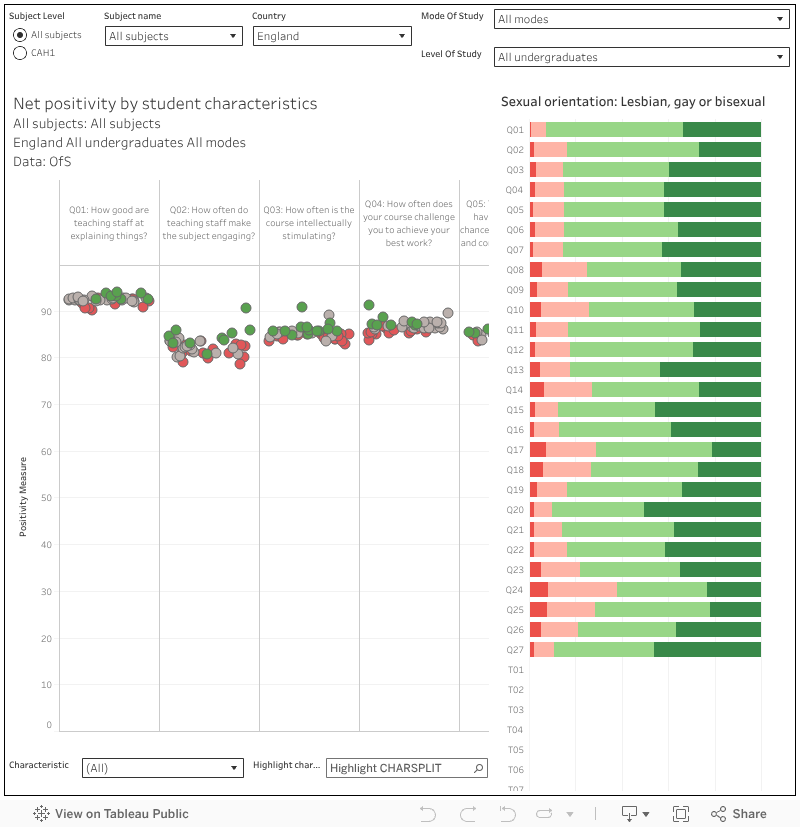
Characteristics
Beyond national trends, subject level oddities, and provider peculiarities the student experience is affected by personal characteristics.
While there may be a provider level problem, many of these could equally be a national or UK-wide issue: especially when linked to a particular subject area. We get characteristic statistics up to CAH level 1 (very broad groups of subjects) in public data, which may be enough to help you understand what is going on with a particular set of students.
For instance, it appears that – nationally – students with disabilities (including mental health struggles) are less likely to feel that information about wellbeing support is well communicated – something that is unlikely to be unique to a single provider, and (ideally) needs to be addressed in partnership to ensure these vulnerable students get the support they need.
Conclusion
If you take NSS at face value it is an incredibly useful tool. If we manage to leave it in a steady state for a few more years time series will add another level to this usefulness (sorry, a year-on-year comparison tells us little and even three years isn’t much better.
As ammunition to allow you to solve problems in your own provider, to identify places to learn from, and iterate your way to happier and better educated students it is unsurpassed. It’s never really convinced as a regulatory tool, and (on a limb here) the value for applicants only really comes as a warning away from places that are doing outstandingly badly.
-

Survey of 1500 Kids Suggests School Phone Bans Have Important but Limited Effects – The 74
Get stories like this delivered straight to your inbox. Sign up for The 74 Newsletter
In Florida, a bill that bans cellphone use in elementary and middle schools, from bell to bell, recently sailed through the state Legislature.
Gov. Ron DeSantis signed it into law on May 30, 2025. The same bill calls for high schools in six Florida districts to adopt the ban during the upcoming school year and produce a report on its effectiveness by Dec. 1, 2026.
But in the debate over whether phones should be banned in K-12 schools – and if so, how – students themselves are rarely given a voice.
We are experts in media use and public health who surveyed 1,510 kids ages 11 to 13 in Florida in November and December 2024 to learn how they’re using digital media and the role tech plays in their lives at home and at school. Their responses were insightful – and occasionally surprising.
Adults generally cite four reasons to ban phone use during school: to improve kids’ mental health, to strengthen academic outcomes, to reduce cyberbullying and to help limit kids’ overall screen time.
But as our survey shows, it may be a bit much to expect a cellphone ban to accomplish all of that.
What do kids want?
Some of the questions in our survey shine light on kids’ feelings toward banning cellphones – even though we didn’t ask that question directly.
We asked them if they feel relief when they’re in a situation where they can’t use their smartphone, and 31% said yes.
Additionally, 34% of kids agreed with the statement that social media causes more harm than good.
And kids were 1.5 to 2 times more likely to agree with those statements if they attended schools where phones are banned or confiscated for most of the school day, with use only permitted at certain times. That group covered 70% of the students we surveyed because many individual schools or school districts in Florida have already limited students’ cellphone use.
How students use cellphones matters
Some “power users” of cellphone apps could likely use a break from them.
Twenty percent of children we surveyed said push notifications on their phones — that is, notifications from apps that pop up on the phone’s screen — are never turned off. These notifications are likely coming from the most popular apps kids reported using, like YouTube, TikTok and Instagram.
This 20% of children was roughly three times more likely to report experiencing anxiety than kids who rarely or never have their notifications on.
They were also nearly five times more likely to report earning mostly D’s and F’s in school than kids whose notifications are always or sometimes off.
Our survey results also suggest phone bans would likely have positive effects on grades and mental health among some of the heaviest screen users. For example, 22% of kids reported using their favorite app for six or more hours per day. These students were three times more likely to report earning mostly D’s and F’s in school than kids who spend an hour or less on their favorite app each day.
They also were six times more likely than hour-or-less users to report severe depression symptoms. These insights remained even after ruling out numerous other possible explanations for the difference — like age, household income, gender, parent’s education, race and ethnicity.
Banning students’ access to phones at school means these kids would not receive notifications for at least that seven-hour period and have fewer hours in the day to use apps.
Phones and mental health
However, other data we collected suggests that bans aren’t a universal benefit for all children.
Seventeen percent of kids who attend schools that ban or confiscate phones report severe depression symptoms, compared with just 4% among kids who keep their phones with them during the school day.
This finding held even after we ruled out other potential explanations for what we were seeing, such as the type of school students attend and other demographic factors.
We are not suggesting that our survey shows phone bans cause mental health problems.
It is possible, for instance, that the schools where kids already were struggling with their mental health simply happened to be the ones that have banned phones. Also, our survey didn’t ask kids how long phones have been banned at their schools. If the bans just launched, there may be positive effects on mental health or grades yet to come.
In order to get a better sense of the bans’ effects on mental health, we would need to examine mental health indicators before and after phone bans.
To get a long-term view on this question, we are planning to do a nationwide survey of digital media use and mental health, starting with 11- to 13-year-olds and tracking them into adulthood.
Even with the limitations of our data from this survey, however, we can conclude that banning phones in schools is unlikely to be an immediate solution to mental health problems of kids ages 11-13.
Grades up, cyberbullying down
Students at schools where phones are barred or confiscated didn’t report earning higher grades than children at schools where kids keep their phones.
This finding held for students at both private and public schools, and even after ruling out other possible explanations like differences in gender and household income, since these factors are also known to affect grades.
There are limits to our findings here: Grades are not a perfect measure of learning, and they’re not standardized across schools. It’s possible that kids at phone-free schools are in fact learning more than those at schools where kids carry their phones around during school hours – even if they earn the same grades.
We asked kids how often in the past three months they’d experienced mistreatment online – like being called hurtful names or having lies or rumors spread about them. Kids at schools where phone use is limited during school hours actually reported enduring more cyberbullying than children at schools with less restrictive policies. This result persisted even after we considered smartphone ownership and numerous demographics as possible explanations.
We are not necessarily saying that cellphone bans cause an increase in cyberbullying. What could be at play here is that at schools where cyberbullying has been particularly bad, phones have been banned or are confiscated, and online bullying still occurs.
But based on our survey results, it does not appear that school phone bans prevent cyberbullying.
Overall, our findings suggest that banning phones in schools may not be an easy fix for students’ mental health problems, poor academic performance or cyberbullying.
That said, kids might benefit from phone-free schools in ways that we have not explored, like increased attention spans or reduced eyestrain.
This article is republished from The Conversation under a Creative Commons license. Read the original article.
Get stories like these delivered straight to your inbox. Sign up for The 74 Newsletter
-

College parents speak out in new survey: Weekly updates, mental health info and more access needed
As colleges nationwide double down on enrollment, retention, and student success strategies, one key voice is becoming harder to ignore: the family. According to the 2025 Current Families Report released by CampusESP, families want more updates, more access, and more say in the college journey, and they’re increasingly dissatisfied when they don’t get it. In addition, when parents do receive the information they need to support their student, research shows significant gains in student yield and retention.
The survey, conducted across 81 colleges and universities and with more than 32,000 parents and supporters of current students, is the most comprehensive look at family engagement to date. And the findings are impossible to miss.
Mental health, money, and mentorship
Nearly half of all parents talk to their student daily, with the number jumping to over 60% for low-income and first-generation households. These families aren’t just chatting about weekend plans — they’re offering support on mental health (53%), academic advice (57%), and student life (69%).
“Parents aren’t bystanders — they’re active advisors,” says the report. “And they need the right tools to guide their students.”
Communication expectations are high
A staggering 77% of families want to hear from their student’s college weekly or more, up 12% in just four years. While email is still the go-to channel, the demand for text messaging is surging, especially among Black, Hispanic, low-income, and first-gen families.
However, a gap remains: 48% of families prefer text, but only 28% of colleges offer it.
Trust wavers without transparency
Families are becoming more skeptical about the return on their tuition investment. Only 59% say college is worth the cost — a sharp drop from 77% the year before. Their #1 request? More info on career services and job placement, which ironically ranked lowest in satisfaction.
Families want in, but feel left out
Even when they receive a high number of communications from their student’s college, families still feel sidelined. Just 46% are satisfied with their opportunities to get involved on campus, down from 63% last year. And only 30% feel they have good ways to connect with other families.
Yet the desire is there: 38% want to be more involved, and 22% say they’re more likely to donate to their student’s college than their own alma mater.
Financial aid frustration runs deep
Navigating costs is a pain point. 59% say it’s hard to pay for college, and only 25% found financial aid information easy to understand.
And with confusion comes attempts at self-education. Nearly half of families rely on their student’s login to access key financial records—posing serious data privacy concerns.
The report confirms what many enrollment leaders have long suspected: families aren’t just part of the support system — they are the support system. The challenge for institutions? Reaching them with the right information, in the right format, at the right time.
“Family engagement isn’t optional — it’s a strategic advantage,” the report concludes.
Download the full 2025 Current Families Report from CampusESP to explore the findings and access actionable strategies for turning family influence into institutional success.
-
Faculty Survey Shows Need for Digital Accessibility Support
The U.S. Department of Justice introduced the Americans With Disabilities Act final rule for digital accessibility in 2024, requiring public colleges and universities to follow Web Content Accessibility Guidelines for ensuring that online programs, services and activities are accessible. These laws require institutions to update inaccessible documents and ensure new content follows accessibility requirements.
A recent survey by Anthology found that faculty members feel they lack sufficient support and access to resources to create an accessible online classroom environment, and they have a general lack of awareness of new ADA requirements.
Anthology’s survey—which included responses from 2,058 instructors at two- and four-year colleges and universities across the U.S.—highlights a need for professional development and institutional resources to help faculty meet students’ needs.
Supporting student success: Expanding accessibility isn’t just mandated by law; it has powerful implications for student retention and graduation outcomes.
Approximately one in five college students has a disability, up 10 percentage points from the previous decade, according to 2024 data from the U.S. Government Accountability Office. A majority of those students have a behavioral or emotional disability, such as attention deficit disorder, or a mental, emotional or psychiatric condition.
While a growing number of students with disabilities are enrolling in higher education, they are less likely than their peers without a disability to earn a degree or credential, due in part to the lack of accessibility or accommodations on campus.
Survey says: Only 10 percent of faculty believe their institution provides “absolutely adequate” tools to support students with disabilities, and 22 percent say they consider accessibility when designing course materials.
Instructors are largely unaware of the ADA’s Web Content Accessibility Guidelines; one-third of survey respondents said they are “not at all” aware of the requirements, and 45 percent said they were aware but “unclear on the details.”
When asked about the barriers to making course content accessible, faculty members pointed to a lack of training (29 percent), lack of time (28 percent) and limited knowledge of available tools (27 percent) as the primary obstacles.
A lack of awareness among faculty members can hinder student use of supports as well. A 2023 survey found that only about half of college students are aware of accessibility and disability services, though 96 percent of college staff members said the resources are available.
In Anthology’s survey, 17 percent of instructors said they were unaware of what tools their institution provides to help students access coursework in different formats, and 30 percent said they were aware but didn’t share information with students.
Less experienced faculty members were more likely to say they haven’t considered accessibility or were unaware of ADA requirements; one-third of respondents with fewer than two years of teaching experience indicated they rarely or never consider accessibility when creating materials.
One in four faculty members indicated more training on best practices would help them make their digital content more accessible, as would having the time to update and review course materials.
Improving accessibility: Some colleges and universities are taking action to empower faculty members to increase accessibility in the classroom and beyond.
- The University of North Dakota in spring 2023 created an assistive technology lab, which trains faculty and staff members to make course resources accessible. The lab, led by the university’s Teaching Transformation and Development Academy, offers access to tech tools such as Adobe Acrobat Pro and the screen-reader software Job Access with Speech, for course content development. Lab staff also teach universal design principles and conduct course reviews, as needed.
- The State University of New York system created the SUNY Accessibility Advocates and Allies Faculty Fellowship program in January, designating 11 fellows from across the system to expand digital accessibility and universal design for learning practices at system colleges. Fellows will explore strategies to build a culture of access, share expertise and experience, connect with communities of practice, and design a plan to engage their campus community, among other responsibilities.
- The University of Iowa built a new digital hub for accessibility-related resources and information, providing a one-stop shop for campus members looking for support. The university is also soliciting questions from users to build out a regularly updated FAQ section of the website. Iowa has a designated Accessibility Task Force with 10 subcommittees that address various applications of accessibility needs, including within athletics, communication, health care, student life and teaching.
- Colorado State University has taken several steps to improve community compliance for accessibility, including offering free access to Siteimprove, a web-accessibility assessment tool that helps website developers and content managers meet accessibility standards and improve digital user experience. Siteimprove offers training resources to keep users engaged in best practices, as well as templates for creating content, according to CSU’s website. The university also has an accessibility framework to help faculty members bring electronic materials into compliance.
Get more content like this directly to your inbox. Subscribe here.
-
Federal agency reportedly texts survey to professors asking if they’re Jewish or Israeli
This audio is auto-generated. Please let us know if you have feedback.Dive Brief:
- Faculty members of Columbia University and Columbia-affiliated Barnard College received text messages from the U.S. Equal Employment Opportunity Commission asking them to complete a survey inquiring about whether they are Jewish or Israeli, multiple news outlets reported April 23.
- According to a screenshot of a message posted by CNN, EEOC said responses to the survey would be kept confidential “to the extent allowed by law.” The screenshot said EEOC was conducting an inquiry into Barnard College and that, should the agency find that the college violated laws enforced by EEOC, some of the information of respondents may be disclosed.
- In an email to HR Dive, EEOC declined to confirm that it had sent the messages. Columbia, in a separate email, declined to confirm that employees had received messages from EEOC.
Dive Insight:
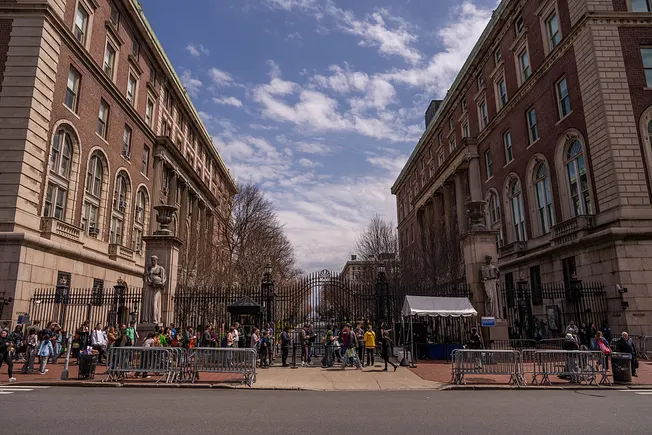
Federal officials have scrutinized Columbia following a series of on-campus protests in 2024. In August of that year, Rep. Virginia Foxx, R-N.C., and former chairwoman of the House Committee on Education and the Workforce, issued several subpoenas to Columbia leaders as part of an investigation into antisemitism at the university and whether the protests had created a hostile environment in violation of the 1964 Civil Rights Act.
Last month, EEOC Acting Chair Andrea Lucas issued a statement in which she pledged to hold universities and colleges accountable for workplace antisemitism. Lucas’ statement did not name any specific institutions, but it did cite “disruptive and violent protests in violation of campus policies” as an example of severe or pervasive antisemitic conduct that could violate Title VII of the Civil Rights Act.
“Under the guise of promoting free speech, many universities have actually become a haven for antisemitic conduct, often in violation of the universities’ own time, place, and manner policies, as well as civil rights law,” Lucas said in the March 5 statement.
EEOC did not confirm whether messages sent to Columbia and Barnard faculty were part of an ongoing investigation into either institution. “Per federal law, we cannot comment on investigations, nor can we confirm or deny the existence of an investigation,” the agency said.
Similarly, Columbia declined to comment on a pending investigation, but a university official said Columbia had told staff that it gave “affected employees notice that the University was required to provide certain information in compliance with a subpoena. The University did not provide the information voluntarily.”
Columbia did not respond to a request for comment on whether it had advised staff not to respond to EEOC’s messages.
News of the inquiry drew criticism from one of EEOC’s administrative judges, Karen Ortiz, who sent an all-staff email directed to EEOC Acting Chair Andrea Lucas.
Ortiz wrote that Lucas should consider resigning; in an interview with HR Dive, she said the email was in response to news of the text messages and other recent agency actions, including its decision to abandon gender-identity discrimination litigation and halting some claims processing. She said the survey arguably was not within Lucas’ authority to send and could be understood as an attempt to intimidate Columbia and Barnard.
“It’s a complete overreach,” Ortiz said of the survey.
-

62% Jewish students, staff feel unsafe on campus: Survey – Campus Review
Members of the Jewish community gather to protest. University of Sydney pro-Palestine encampment counter-protest. Pro-Israel counter-protesters gathered at the University of Sydney’s campus during a pro-Palestine encampment rally in May, 2024. Picture: Britta Campion
A survey of 550 university staff and students found six in 10 experienced antisemitic comments, and about the same felt unsafe on campus due to Israel-Gaza driven conflict in Australia.
Please login below to view content or subscribe now.
Membership Login