This week on the podcast the government has finally unveiled its new International Education Strategy – but with no headline target for international student numbers and a clear shift towards education exports, what does it mean for the sector?
Plus the latest UCAS end of cycle data and what it reveals about entry qualifications at high tariff providers, and a new NUS campaign on student maintenance that’s turning the spotlight on parents.
With Mike Ratcliffe, Senior Advisor at UWE Bristol, Richard Brabner, Visiting Professor of Civic Engagement at Newcastle University, Jen Summerton, Operations Director at Wonkhe and presented by Jim Dickinson, Associate Editor at Wonkhe.
You can subscribe to the podcast on Apple Podcasts, YouTube Music, Spotify, Acast, Amazon Music, Deezer, RadioPublic, Podchaser, Castbox, Player FM, Stitcher, TuneIn, Luminary or via your favourite app with the RSS feed.
On the site
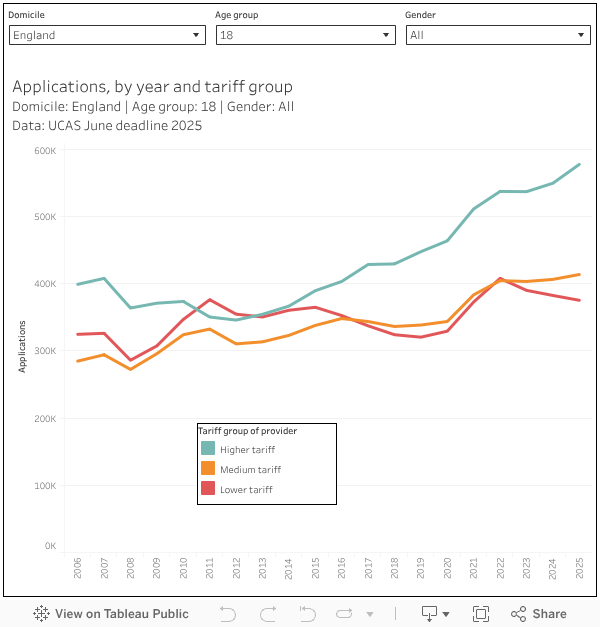
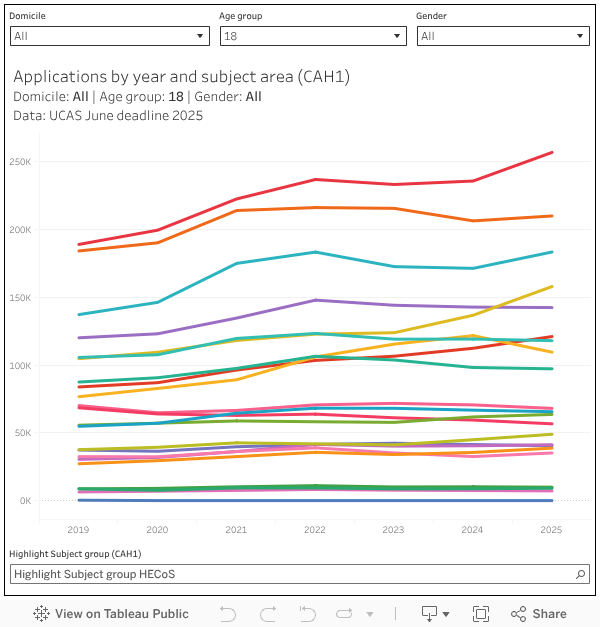
UCAS End of Cycle, 2025: access and participation
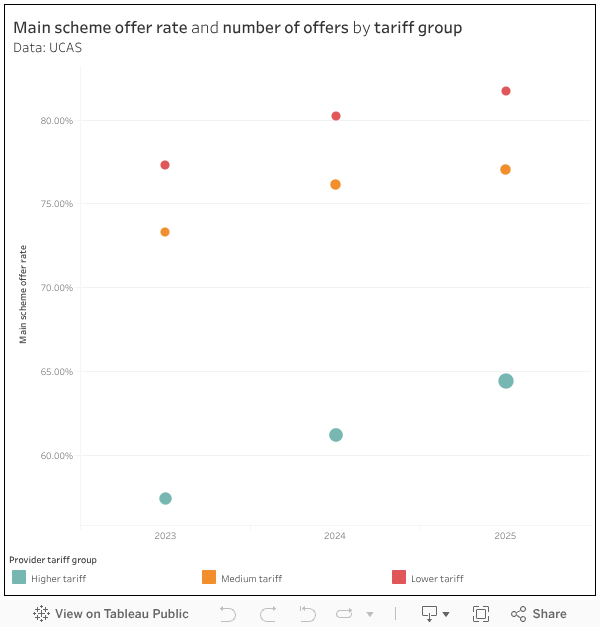
UCAS End of Cycle, 2025: provider recruitment strategies
Graduates are paying more and getting less
A new international education strategy
Transcript (auto generated)
It’s the Wonkhe Show. The long-awaited international education strategy finally lands, but where’s the numbers target? There’s UCAS data out, latest on who’s doing the hoovering, and NUS launches a new campaign aimed at mum and dad. It’s all coming up.
“Yes, we think this is important, but this is definitely framed as the solution to your financial worries is to not bring more international students into this country. But it is still framed as international students are being valuable, what they bring, the globalisation. And then I thought that I’m annoyed that soft power boils down to how many presidents and prime ministers we have.”
Welcome back to the Wonky Show, your weekly roundup of higher education news, policy and analysis. I’m your host, Jim Dickinson, and I’m here to help us make sense of it all. As usual, three excellent guests.
In Oxford, Mike Bratcliffe is Senior Advisor at UWE Bristol. Mike, your highlight of the week, please.
“It’s starting block. So we’ve got students back. They’re doing their programme-level induction, which is lovely. Having students run a campus game is particularly lovely because it means that catering feel confident enough to reopen the salad bar.”
And in Newcastle this week, Richard Brabner is visiting Professor of Civic Engagement at Newcastle and LPD Place Fellow at the University of Birmingham. Richard, your highlight of the week, please.
“Thanks, Jim. Well, I’ve actually based in South East London in Bromley, but my highlight of the week was actually going up to Newcastle on Monday and Tuesday, the first time in my visiting role, to talk to the senior team and various colleagues up there about our Civic 2.0 campaign, which is looking at the next steps for the civic university movement and how we can have more of an impact on policy and the incentives in the system. So that was all very fun and very exciting.”
Lovely stuff. And near Loughborough this week, Jen Summerton is Operations Director at Wonky. Jen, your highlight of the week, please.
“Thanks, Jen. My highlight of the week, workwise, is launching the Secret Life of Students programme yesterday because I’m really excited. We’ve got some great content in there. I’ve just got to cheekily add another one, which is that yesterday was my birthday and my daughter made me some chocolate covered strawberry demi-gorgons which were absolutely delicious.”
Oh that reminds me, someone gave me some chocolate at Student Governors yesterday. I think that’s melted in my pocket anyway.
So yes, we’ll start this week with international education. This week the government published a long-awaited refresh of its strategy. Jen, what is in it and perhaps what isn’t in it?
“Yes, so I think we were told in autumn 2024 that we were due for a refresh of this, so it is long-awaited. Tuesday. Unsurprisingly, though, missing our headline target numbers on international students, which turned out to be a bit of a hot potato last time. I think in 2019 we had a 600,000 international student target.
“So what we do have this time is a £40 billion target on education exports by 2030. And that’s up from 35 billion in the last strategy, although perhaps worth mentioning that the methodology has changed and obviously inflation’s in quite a bit since then. I think really the focus this time is on exports, and transnational education gets plenty of warm words.
“There’s also a slight difference in terms of the strategy being co-owned by the Foreign, Commonwealth and Development Office and the Department for Business and Trade along with the DfE. So the reference to education as a soft power tool, lots about influencing. And there’s a focus on student experience and support for international students as well, infrastructure, housing, that kind of thing.”
Well, this is interesting now. Richard, on LBC this week, actually in written form, despite the fact that it was on LBC’s website, Jackie Smith said, “If they are to survive, universities must maximise the opportunities and expand abroad.” That’s a signal of intent, isn’t it?
“Absolutely. I think whether it’s the correct signal of intent will be depending on your perspective on these sort of things. I think this document reflects political reality and it’s essentially quite a small-c conservative document in a way. I personally think its pragmatism should be welcomed in the sense that it’s not telling the sector something it might want to hear but isn’t able to deliver on.
“There’s clearly been some mixed reaction. I think there are some organisations that have clearly been involved in shaping this strategy, have really warmly welcomed it. But you’ve seen various other commentary from people, particularly from the international student recruitment market, that are more negative towards it because I don’t think it’s ambitious enough.
“The shift in emphasis towards TNE is really interesting. It reminds me of the coalition government, where international students were included in the net migration target, but there wasn’t a cap on numbers. There were mixed messages, but they did shift emphasis towards TNE thinking it could be the answer to all our prayers.
“But what’s challenging for Jackie Smith, and why the £40 billion target is arguably quite ambitious, is that it doesn’t really reflect the internal challenges universities are under at the moment. Are they really able to capitalise on this moving forward? We know some really positive examples of TNE overseas and they’ve highlighted that in the strategy, particularly in relation to India and so on.
“But how difficult it is not just to build campuses but deliver effective partnerships when you’re restructuring your institution internally and investing overseas when there’s so much challenging change at home, I think is quite difficult. So perhaps it won’t be institution-led. It’ll be tech and other innovation in the system that might lead this.”
Now, Mike, when I was planning the study tour this year, I was thrilled to be reminded that Premier Inn operated in Germany. When we got there, without going into detail, I think it’s fair to say they’re struggling to maintain quality. If there’s a massive expansion in TNE, there’s actually not been much regulatory attention on it. Are there a set of quality risks?
“Well, there are. I think there’s a lot of scope to think about TNE and its opportunities. If you go back to a UUKi report last month, it shows how much growth we’ve had. But it also makes the point that there’s a distinction between TNE actually delivered in country and TNE done by distance and other flexible means.
“There’s an artefact in the report, that picture of them all in India with the Prime Minister, and you think, well, that’s a big ‘let’s build a campus’ kind of TNE. That’s the big slow burn stuff.
“We don’t know. OfS continue to threaten English providers with expanding the scope of what they’re going to do and then going quiet on it again. What would be really good is some kind of backup that says, this is the kind of thing we’re going to be doing over the next three to four years, so institutions know they don’t go and set up provision and then fall foul of some new rule applied to people in a completely different country, which no one knew was coming.
“The report talks about taking out red tape. If we’re going to start to put more red tape onto TNE, that’s not going to work.”
Well, that’s interesting, isn’t it? Look, Jen, one of the things that strikes me is the Foreign Office’s logo is on this time, but the Home Office’s logo isn’t. We still have this split between immigration policy and what amounts to an export policy. How much joint government is going on here?
“I mean, it’s an interesting one because in a sense, the new strategy is seeking cross-government commitment. We’ve got the Foreign Office and we’ve got the trade and business side involved. That’s quite a big ask.
“In one way, Jackie Smith is saying if they are to survive, universities must maximise opportunities. Actually, she’s also saying it has to be done meaningfully and with purpose. Doing all of this in the right way at the same time as universities facing the financial constraints they’re under is a hugely ambitious task and it will be a lot easier for some institutions than others.
“We need to be careful that the sector can support all institutions to do this in the right way and with purpose. And thinking about home students as well, how do we create opportunities overseas that benefit students in the UK? How can we make this across the board beneficial and valuable for everybody and greater than the sum of its parts?”
Back on the main international recruitment stuff, Richard. A lot of other countries have national-level initiatives around experience, mental health, emergency financial support, housing, and so on. There’s very little here that moves the dial beyond warm words on urging institutions to offer the best experience.
“Yeah. I think it does mention infrastructure and housing, which I’m not sure it did previously. Small steps forward, you could argue.
“There are two things I’d pick up on. Firstly, it says it supports the sector-led agent quality framework, which is welcome, but I personally don’t think it goes far enough in protecting students from bad practice. There’s plenty of that out there, and it presents a reputational risk. It could be strengthened, perhaps through a co-regulatory approach with government and sector together.
“Secondly, there’s a cursory mention of outcomes, but in a limited way. When we ran the Student Futures Commission a few years ago, there was a sub-commission looking at the international student experience. Graduate outcomes and employability were a major theme. The UK sector needs to get better at facilitating opportunities not just in the UK but also in the countries students come from and may return to.
“I think there might be a role for government, not necessarily funding lots of things, but facilitating pooling resources and knowledge-sharing, particularly around graduate opportunities overseas.
“And from a civic lens, another missing piece is utilising international students intentionally to support economic and social growth in towns and cities beyond their spending power. How could we facilitate their expertise and knowledge with small businesses that want to grow export-led approaches overseas, including in their own countries? That could support graduate outcomes and business in this country.”
But Mike, this is part of the problem, isn’t it? When you’ve got a strategy separated from the trade-offs the Home Office has to make on immigration policy, you end up with an international education strategy that doesn’t really rehearse whether we want international graduates, whether we need immigration, ageing population, sustainable migration. That framing ends up missing and it reads like export promotion.
“I suppose that framing of ‘we support the sustainable recruitment of high quality international students’ is sat there on the face of the thing, which is fine. There are clearly paragraphs there to show the sector they’re paying attention. That framing of genuine students, that’s a concern because the Home Office is sitting on a lot of casework suggesting it is concerned that some people who come here are not genuine students.
“There’s something weird in how the Home Office, on the one hand, is activist in this area, but on the other hand it hasn’t used the CAS system where it allocates the number of students a place can recruit. It’s not done anything to deal with what sometimes looks like boom and bust in recruitment.
“So that’s the tension. Yes, we think this is important, but this is definitely framed as the solution to your financial worries is to not bring more international students into this country. But it is still framed as international students are very valuable, what they bring, the globalisation.
“And then I thought I’m annoyed that soft power boils down to how many presidents and prime ministers we have. Wouldn’t it be marvellous to have procurement managers spread across the world with British degrees? Because that would be far better for an industry than the occasional president, who is subject to international whim.
“What could we do to say that’s where we get value by having a lot of people who have an experience of British education? But also, increasingly, we come back to the TNE thing, a British education that they haven’t had to fly halfway around the world in order to get.”
I mean, on the target thing, Jen, we should note there isn’t an explicit numbers target, but there also isn’t a cap or a cut of the sort being played with now in Canada and Australia.
“Yeah, and to be honest, it doesn’t take people in the sector who know how to do these calculations to work that up into a numbers target if they want to. Individual institutions will be required to do that. They have to plan what proportion will be overseas, what will be TNE, what might be English language, whatever, and diversify it.
“And obviously the majority will still be international students coming to the UK. They have to decide where they want to prioritise efforts and finances. We’re hearing this from government all the time. They’re putting the onus back on institutions to be creative about how they can make more money and diversify their offer.
“If we don’t do it, other countries will do it. So we have to be in it to win it.”
I was at student governance yesterday and ended up talking with four of them from a particular part of the country who said they don’t think their own university could sustain a campus abroad, but the four of them could probably collaborate on a multidisciplinary degree abroad. Are there opportunities for collaboration in the TNE space that aren’t being taken?
“Yeah, I’m sure there must be. If institutions are going to be creative and innovative in this space, you’d think so. And that’s where there could be a role for government in developing this strategy, whether nationally or regionally, easing out tensions and creating partnerships that could be effective abroad.”
And finally, Mike, one of the things that strikes me is there often doesn’t seem to be much interaction between students studying similar subjects on a TNE campus and back home. Academics fly backwards and forwards. Is there more opportunity for internationalisation at home, maybe a semester at the TNE campus, or mixing without requiring someone to spend years abroad?
“Yeah, we’ve definitely seen that with places with fixed scale campuses abroad. The opportunity to continue your course but do it in China or Malaysia is part of the offer.
“There are American universities that bring their students here for a semester and get an experience but stay on course, and have the opportunity to mix with different people.
“What will be interesting is whether you can do that with technology. If you’ve got your VLE set up and you’re teaching the module, what opportunities are there to make that module available to people in two or three other countries at the same time as people are doing it in the UK? Opportunities for group work, sharing resources, getting global perspective without anyone moving an inch. There’s lots more we could develop. There are good examples already of how people are making their TNE enrich the experience of UK students.”
Well, fascinating. Now, let’s see who’s been blogging for us this week.
“Hi, I’m Common Miles and this week on Wonky I’ll be writing about why universities struggle to act on early warning data from their analytics systems. Many of us have seen this, universities investing heavily in learning analytics. The OfS sets clear continuation thresholds, yet when dashboards flag at risk students, institutions often can’t respond effectively.
“My article explores why this is an organisational challenge rather than a technology problem. The issue is that universities are structured for retrospective quality assurance, not proactive support. When analytics identifies a struggling student in week three, most institutions lack clear protocols for who should act and how.
“Successful institutions solve this by building explicit governance frameworks and creating tiered response systems that bridge the gap between regulatory requirements and teacher judgment. You can read the full piece on Wonky.”
Now, next up, UCAS has released provider-level end-of-cycle data for 2025, and it’s thrown up some interesting patterns, Mike.