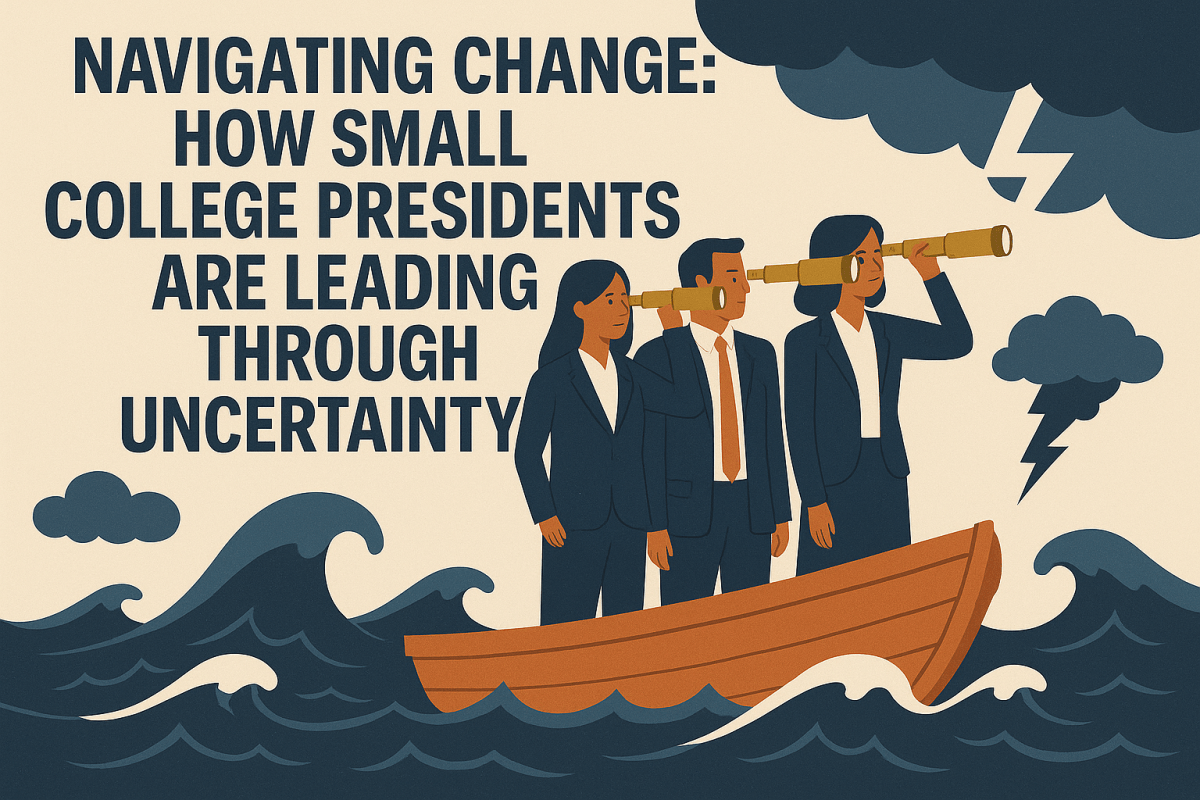
When President Trump ordered a 90-day freeze on foreign aid, no one felt the impact more than the people of Sudan. Two years of civil war has left more than 25 million Sudanese starving in what is the largest humanitarian crisis the world has ever seen. Debora Patta reports.
Tag: Uncertainty
-
Resilience and Psychological Safety: Navigating Uncertainty
by Julie Burrell | February 26, 2025
The first two months of 2025 have brought no shortage of change and uncertainty to higher ed institutions. Amid that uncertainty, you may find yourself not only navigating a wave of new compliance requirements, but also supporting employees who are feeling overwhelmed or worried. When change is happening at a rapid pace, it can be challenging to think strategically about how to manage emotional responses to change.
However, two approaches you probably honed during the COVID-19 pandemic — fostering resilience and psychological safety — can be particularly useful in times like these.
Resilience is a set of tools we use to regulate our response to stress. It’s what allows us to survive during moments of crisis and learn to grow. Psychological safety is a management approach that allows employees to thrive and adapt to stressful situations. We feel psychologically safe when we’re able to take risks knowing we’ll be supported.
Combined, these workplace strategies tap into emotional resources we already have and can further develop and strengthen.
Strengthening Internal Resilience
You may never have stopped to reflect on how you endured the pandemic, but it likely took a great deal of resilience. Learning to survive, and even flourish, in tough times calls for a store of personal resilience, which the American Psychological Association defines as “successfully adapting to difficult or challenging life experiences, especially through mental, emotional, and behavioral flexibility.”
Some people just appear to be more naturally resilient than others. Maybe they seem tougher or more inclined to go with the flow. But resilience isn’t an innate trait we’re born with. It’s a skill that can be learned and practiced.
In her Resilience in the Workplace webinar, Maureen De Armond, chief human resources officer at Des Moines University Medicine and Health Sciences, identified the four key factors that make up resilience:
- Identifying your purpose and values
- Gaining confidence
- Seeking support from your networks
- Learning adaptability
A Quick Resilience Exercise on Personal Values
Even a 15-minute resilience-building exercise can be effective, such as this brief reflection shared in the webinar.
First, write down a list of five answers to the question, “why is it worth it to persevere and get through this challenging time?” For example, do you want to model certain behavior for your children? Do you want to be compassionate to your coworkers? Do you want to steward your team through change? Do you want to support your friends and family?
Second, figure out the why behind each of these five answers by identifying the value behind each. Values can include achievement, compassion, economic security, humor, leadership, passion, etc. (Here’s a handy checklist.)
Finally, be proactive about reminding yourself of these values:
- Display photos that represent your values so that you see them every day — a loved one, beloved pet, a favorite spot on a hike, a trip you’re planning, an inspirational public figure.
- Place quotes that illustrate these values around your workspace.
- Craft an inspiration board, either on a digital whiteboard or as a physical craft, that contains photos, symbols, images and words that demonstrate your values.
- Get out of your office and take a walk. Especially if you work on campus, this can be a reminder of your community and of the student population the higher ed workforce serves.
Think of these proactive reminders as a “battery pack,” De Armond says, that will give you a boost or a nudge to get out of a negative head space. Helping employees tap into and strengthen their own resilience will equip them for whatever lies ahead.
The Role of Psychological Safety in Managing Uncertainty
While it’s natural for people to seek safety and solace in a time of upheaval, psychological safety isn’t about providing comfort or promoting kindness, as important as these are. Rather, it’s about candor, trust and accountability among teams. It allows team members to speak up about mistakes (including their own), tolerate risk, and embrace discomfort and change.
Amy Edmonson, an expert on team psychological safety in the workplace, defines psychological safety as “the shared belief that’s it’s okay to take risks, express ideas and concerns, speak up with questions, and admit mistakes without fear of negative consequences.”
For example, what happens when a team member goes to their supervisor with a question, admits a mistake, or notices a colleague’s error? If that supervisor gets angry or becomes dismissive, the employee may stay quiet in the future and even cover up mistakes to avoid that reaction again. But if the supervisor adopts some of the tips below, the team feels safe enough to take risks and can weather storms as a group.
Recommendations to Increase Psychological Safety
- Encourage people to come to you with problems and thank them for doing so. Also ask, “how can I help?”
- Adopt a learning mindset. In the example above, an angry or dismissive supervisor also missed the chance to ask, “what did you learn?” As psychological safety experts know, “organizations characterized by a learning orientation focus on curiosity and continuous improvement, and they make it safe for organizational members to admit what they do not know or perhaps got wrong.” If you have a Learning and Development team, they can offer practices for adopting a learning mindset.
- Listen rather than talk. Leaders are expected to have all the answers, but unless immediate action is needed, pausing and getting all the facts, and listening to feelings, can be an important leadership tool. Reflective listening — repeating or paraphrasing what’s said or reflecting a feeling that’s expressed — is a particularly useful skill for creating trust.
- Say, “I don’t know.” Leaders modeling psychological safety admit when they don’t know something, allowing others in their organization to adopt a curious mindset. This is what Brené Brown calls “the courage to not know.”
- Celebrate small wins. Appreciating your employees matters now more than ever.
- Take care of yourself and your team. HR is often expected, fairly or not, to manage tension and conflicting emotions. How are you showing up for yourself and your team?
For more tips on increasing psychological safety, see the article Why Psychological Safety Matters Now More Than Ever by Allison M. Vaillancourt, vice president and senior consultant at Segal.
Finally, Give Grace
Giving grace to others during stressful and uncertain times can be a small but critical daily practice, one that builds compassion and trust. But we need to extend that same grace to ourselves. Set boundaries, take breaks, practice going slow, and share the load.
Related CUPA-HR Resources
Resilience in the Workplace — This CUPA-HR webinar, recorded in 2021, was designed to serve as resilience training for attendees, as well as a model that could easily be replicated at your institution for HR teams and other employees.
Why Psychological Safety Matters Now More Than Ever — This article offers practical advice for increasing psychological safety, specifically for the higher ed workplace.
Recent Executive Orders and Higher Ed HR’s Role in Creating and Sustaining an Inclusive Campus Community — A message from CUPA-HR President and CEO Andy Brantley.
Mental Health Toolkit — This HR toolkit includes resources on sustaining mental health programs on campus and addressing problems like burnout.
The Great Pivot from Resilience to Adaptability — This article explains how to move from resilience to adaptability and, ultimately, growth in challenging times for higher education.
Managing Stress and Self-Care: “No” Is a Complete Sentence — This highly rated webinar shows how and why setting boundaries is critical to thriving.
Trauma-Informed Leadership for Higher Education — This webinar explores how to develop a supportive leadership style and how to create a culture where team members can depend on each other for support during times of hardship.
-
Endowment returns climb amid fiscal uncertainty
Endowment returns climbed in fiscal year 2024, offering a boost to university coffers at a time when even the richest institutions have been gripped with financial uncertainty amid the Trump administration’s attempts to freeze federal funding and change research reimbursements.
One-year returns averaged 11.2 percent for FY 2024, according to the latest study by the National Association of College and University Business Officers and the Commonfund Institute—up from 7.7 percent in FY 2023 and negative returns in FY 2022.
The overall 10-year return averaged 6.8 percent, the study found.
In a press call Tuesday, Commonfund Institute executive director George Suttles noted that FY24 “was characterized by a strong U.S. economy, steady consumer spending, strong employment data, including higher wages, easing inflation accompanied by the prospect of lower interest rates, reasonable energy costs” and a prosperous technology sector, among other factors.
The endowment study also noted increased philanthropy in FY 2024. Donors contributed $15.2 billion in new gifts to university endowments included in the study—a nearly 20 percent bump from the $12.7 billion donated in FY23.
Altogether, 658 institutions with combined endowment values of almost $874 billion participated in the voluntary survey, with the median endowment value at $243 million. Nearly a third (30 percent) of the respondents reported an endowment valued at $100 million or less.
“While a handful of institutions receive wide public attention for the size of their endowments, the vast majority of colleges and universities are working with a much smaller set of resources,” NACUBO CEO Kara Freeman said on Tuesday’s press call. “And as we review the total market value, 86 percent was held by endowments with more than $1 billion in assets.”
NACUBO has conducted annual college endowment studies since 1974. This year’s iteration had slightly fewer participants than the 688 who responded last year.
Top Endowments
The nation’s richest institutions kept their status in this year’s study, with no changes among the top 10 and only minor fluctuations among the 25 universities with the largest endowments.
Harvard University is still the nation’s wealthiest institution with an endowment of almost $52 billion, followed by the University of Texas system ($47.4 billion), Yale University ($41.4 billion), Stanford University ($37.6 billion) and Princeton University, with just over $34 billion.
Endowment values grew at all of the five wealthiest universities except Princeton.
Though average annual one-year returns for FY 2024 were 11.2 percent, the nation’s top 25 wealthiest universities mostly missed that mark. The outlier among those was Johns Hopkins University, which had a nearly 24 percent one-year return in FY 2024.
In all, 149 of the 658 participating institutions reported endowments valued at or over $1 billion.
Endowment Performance
Like last year, smaller endowments performed better on one-year returns than large ones. Institutions with endowments valued under $50 million saw an average return of 13 percent, while those with endowments over $5 billion had the lowest one-year returns, with an average of 9.1 percent.
However, larger endowments outperformed smaller ones over the long term.
Across the 10-year mark, institutions with assets above $5 billion reported returns of 8.3 percent, compared to 6.5 percent for those with less than $50 million. Large endowments also fared better on 25-year returns, reporting 8.5 percent compared to 4.5 percent for those under $50 million.
On the spending side, endowments funded an average of 14 percent of the annual operating budgets at the institutions surveyed, up from 10.9 percent in FY23. That figure was slightly higher at institutions with multibillion-dollar endowments.
Study respondents spent a total of $30 billion from their endowments in FY24, up from $28.4 billion in FY23. The most common use of endowment dollars was for financial aid.
Issues Affecting Endowments
With the return of Donald Trump to the White House, college leaders have publicly and privately fretted about the likelihood that Republicans will ratchet up endowment taxes.
During his first term, the Trump administration passed an endowment excise tax of 1.4 percent on investment income at universities with endowment holdings of at least $500,000 per student and a minimum of 500 students. Earlier this month, Republican congressman Mike Lawler proposed raising that rate to 10 percent and changing the per-student endowment threshold from $500,000 to $200,000, which would affect more institutions. Another legislative proposal would raise that rate to 21 percent.
In a question-and-answer session on Tuesday’s press call, the tax issue was the first to arise.
Freeman said NACUBO “remains opposed to the endowment excise tax,” arguing that it “diminishes the charitable resources that would otherwise be available” to universities for financial aid, student services, academic support, research and innovation, among other uses.
Mark Anson, CEO of Commonfund, said the tax could hit some universities hard, including many Ivy League institutions whose robust endowments make up a higher percentage of their operating budgets.
On the press call, Inside Higher Ed asked about the fallout of last spring’s pro-Palestinian protests, in which students at numerous universities demanded divestment of their endowment holdings from Israel or companies profiting off the war in Gaza. While the study did not touch on that issue, experts noted the protests sparked questions from colleges; Anson said some asked for more information about their holdings.
While colleges have largely rejected student divestment demands, one win for protesters has been more transparency around institutional investments.
“What’s come out of this is a continued push for transparency around how endowments are invested,” Suttles said. “Thinking about transparency for stakeholders is an important part of this work. I am encouraged by the calls for transparency, but in terms of actual investment or divestment strategies and a shift in that, we haven’t seen much from our perspective.”
-
Slowing Growth and Uncertainty: A Look at IIE’s Open Doors Report 2024 and What the Future Might Hold
Bryce Loo, Associate Director of Higher Education Research
International students navigate a landscape of uncertainty and opportunity, as the 2024 IIE Open Doors Report highlights shifting trends in U.S. enrollment and global migration.
The Institute of International Education’s (IIE) annual Open Doors Report on International Education Exchange (Open Doors, for short),[1] along with its companion Fall Enrollment Snapshot Survey (Fall Snapshot Survey, for short),[2] was released only a few weeks after a consequential presidential election in which former president Donald Trump defeated Vice President Kamala Harris. Trump’s win will significantly shift the landscape around international students in the U.S.
Open Doors is a retrospective report on international enrollment and other student data in the U.S., focused on the previous full academic year—in this case 2023-24.[3] The Fall Snapshot Survey provides insights into the current fall term. But uncertainty abounds in this new environment with the return of Trump, known for his tough stances on immigration, which may affect non-immigrant residents such as international students and temporary workers. This is happening against a backdrop of global uncertainty, in a year with a tremendous number of important elections around the world, many armed conflicts, and growing climate change. At the same time, there are bright spots for the U.S. as a host of international students and for global student migration in general.
In this article, I also compare results from Open Doors and the Fall Snapshot Survey against recently released data from SEVIS (the Student Exchange and Visitor Information System), maintained by the Department of Homeland Security (DHS), for Fall 2024.[4] This dataset captures all students with a record in SEVIS, the U.S. government database in which all international students are required to be registered by their hosting U.S. institution. Data are organized monthly, with the most recently released is for November 2024, and they vary little month-to-month within a given term, such as a fall semester. For consistency, I compare November 2024 with November 2023. Such data help us to gain a fuller picture of current international enrollment trends this fall.
What the data tell us: Continued but leveling growth
Total international student enrollment in the U.S. hit an all-time high of 1,126,690 in 2023–24, a growth rate of 6.6 percent from the previous year. This has followed a few years of recovery following the dramatic enrollment decrease during the COVID-19 pandemic. The post-pandemic growth rate peaked in 2022-23 at 11.5 percent.
However, growth is slowing. While this year’s Fall Snapshot Survey indicates a 3 percent growth rate in fall 2024, analysis of the SEVIS data indicates a drop in overall enrollment. International enrollment is down to 1,091,190 students in November 2024, a 10 percent decrease from the previous November, according to SEVIS records.[5] IIE’s data confirms slowing growth, too. New international student enrollment slowed to only 0.1 percent in 2023-24. Additionally, the Fall Snapshot Survey indicates a 5 percent decrease in new students this fall.
This recent slowdown, which happened prior to the presidential election results, is tricky to diagnose. One likely culprit, though certainly not the only one, is economics: An education in the U.S. has become particularly expensive, due largely to a combination of inflation and a strong U.S. dollar. A more expensive U.S. education particularly impacts many students from South Asia and sub-Saharan Africa, the two regions showing the strongest rise in U.S. international enrollment in recent years, who are particularly price sensitive.
Changing trends in South Asia and East Asia
International enrollments in the U.S. from South Asia, driven dominantly by India, continued growing at a rapid rate in 2023–24. In 2023–24, India became the top country of origin among international students in the U.S. and by a substantial margin, at 331, 602 students. There was about a 23 percent increase in Indian students from the previous year, accounting for almost 30 percent of all international students in the U.S.
In 2023-24, South Asia firmly dominated among regions of origin for U.S. international students and its numbers continue to rise. South and Central Asia (which IIE groups together as one[6]) account for one-third (34.3 percent) of all U.S. international students, just ahead of East Asia. South and Central Asia’s sending numbers grew 22 percent over the last year, more than those of any other region. Beyond India, there continues to be robust enrollment growth from Bangladesh (26 percent), Nepal (11 percent), Sri Lanka (10 percent), and Pakistan (8 percent). Bangladesh and Nepal broke into the top 10 countries of origin in 2023-24.
By contrast, the number of Chinese students in the U.S. declined more than 4 percent to 277,398 during the same period and accounted for less than 25 percent of all U.S. international students. Overall, numbers from East Asia are declining steadily (by nearly 4 percent last academic year). Numbers from South Korea (-2 percent) and Japan (-13 percent) continued to drop. The one bright spot among major East Asian nations was Taiwan, which saw a 6 percent rise from the previous year and was the fifth largest sending country. Students from East Asia have been decreasing in the last few years, and forecasts suggest further steady decline.
For many East Asian students, the calculus about studying in the U.S. and in Western countries has changed in recent years. Holding a degree from a highly ranked U.S. or Western institution holds less cachet than it once did. In both China and South Korea, local universities have become more prestigious and offer students the opportunity to connect directly with the local job market, putting those studying far afield at a disadvantage. For Chinese students, geopolitical tensions and strict policies against Chinese students and scholars largely enacted by the first Trump Administration, many of which were continued by the Biden Administration, may make studying in the U.S. feel riskier. There has also been growing intra-regional mobility, with many East Asian students choosing to go to another country in the region. According to the British Council, for example, there are more Japanese students in China than in any anglophone country.
Despite the recent increases in enrollment from South Asia, the SEVIS data show a rapid reversal of trends heading in Fall 2024. Indian enrollment in the U.S. this fall has declined by 24 percent, and overall South Asian enrollment has fallen at a similar rate. Meanwhile, Chinese and overall East Asian enrollment has flatlined, each with a barely perceptible decrease. As a result, however, China has become the top country of origin once again, with 263,523 students in the U.S., followed by India (25,5443), in Fall 2024. Likewise, East Asia has returned to the top spot among region of origin, with modest enrollment increases from Japan and South Korea.
A slowdown of enrollment growth from South Asia likely is attributable to rising costs in the U.S., particularly given currency exchange rates, as noted earlier. Safety, a frequent concern for Indian students and their families, could also be a factor. Many Indian media outlets, such as The Economic Times and The Indian Express, have recently reported on increasing safety issues for Indian students in the U.S.
That said, these declines from India and South Asia do not necessarily foretell a long-term trend. Many prominent models, notably that of HolonIQ, predict growth from India into 2030.
Graduate students continue to dominate. For now.
International student growth in the U.S. continues to be driven at the graduate level, particularly among master’s degree students. Graduate students made up almost 45 percent of all U.S. international enrollment in 2023-24. Total international student graduate enrollment increased by 7.6 percent in 2023-24, while undergraduate enrollment fell by 1.4 percent and non-degree enrollment fell by 11.5 percent. These trends are somewhat parallel with new international student enrollment. India has driven much of this growth in grad students, as have South and Central Asian students in general. More Chinese students came to study at the graduate level that year, too.
This growth of international graduate students does not appear to be holding into 2024-25, however. The Fall Snapshot Survey indicates a slight decrease of about 2 percent in international grad students this fall and an increase (6 percent) in international undergrad students. The SEVIS numbers show decreases for both, including a significant decrease of 15 percent among international grad students. (International undergrad enrollment declined by 3 percent.) However, international graduate enrollment is still greater than undergraduate enrollment currently.
The decrease in international graduate students appears to be driven by Indian students and South Asian students overall. Indian students account for about 40 percent of all U.S. international student graduate students, and 60 percent of Indian students in the U.S. are studying at the graduate level, according to Open Doors. Per the SEVIS data, Indian graduate enrollment in the U.S. declined by almost 26 percent in Fall 2024. Additionally, South and Central Asian and East Asian student together account for nearly three-quarters of all international graduate students. Chinese graduate enrollment in the U.S. decreased about 4 percent this fall, according to the data from SEVIS.
U.S. universities and colleges continue to focus heavily on India and to a lesser extent China for their international student recruitment, according to the Fall Snapshot Survey. India is the top country of focus for both graduate students (81 percent of respondents) and undergrads (65 percent). China was second top country of focus for grad students and third for undergrads (just after Vietnam). Given the volatility of enrollment from India and steady declines from China, U.S. institutions may wish to ensure diversity of countries from which they recruit.
What could impact international enrollment in the near future?
The Trump Administration
When it comes to potential impacts on international student enrollment in the U.S., a primary factor will be the incoming Trump administration. Donald Trump will take office with a decisive agenda, having campaigned and won with a tough-on-immigration stance. This stance seemed to resonate with many voters, along with concerns about the economy and inflation.
The first Trump administration may provide a useful look at what could happen in the second one. Trump’s first term brought a decline in international student enrollment, due in part to policies like the 2017 travel ban and a slowdown in visa processing. This trend reversed somewhat during the Biden administration but could resume under the policies of a second Trump term.
Going forward, much will depend on the incoming administration’s policies as well as rhetoric. Trump’s immigration agenda is mostly focused on asylum, primarily at the U.S.-Mexico border, and on undocumented immigrants, whom he has pledged to deport at unprecedented rates. The extent that he will focus on international students and immigrants with specialty occupations, notably the H1-B visa program under which some international students seek to remain in the U.S., is unclear. In June 2024, Trump, known for making offhand comments, proposed on a podcast hosted by Silicon Valley investors that international students who graduate from U.S. institutions, including community colleges, should receive a green card (permanent residency). He and his team later walked back that remark, and many commentators see such policy as highly unlikely given Trump’s overall immigration stance. In fact, reports suggest the administration is likely to limit pathways to H1-B visas, international students’ primary means of staying in the U.S. beyond Optional Practical Training (OPT), effectively making such visas virtually inaccessible.
Policy changes under Trump’s second administration could also affect OPT and “duration of status,” the length of time students with visas have been allowed to stay in the U.S. without needing to renew. Such changes were attempted in the first Trump administration but did not succeed. His first administration also tried to eliminate STEM OPT, the 24-month extension of OPT for those graduating with a degree in fields related to science, technology, engineering, or mathematics. Indian students in particular may be concerned about such changes if they are proposed again, as they are often drawn to the U.S. by opportunities to gain work experience. Toward the end of that term the administration also put forward a rule to limit duration of status to a finite period of two or four years, rather than allow the time needed to finish earning a degree, after which a student would be required to pay a fee and renew.
Still, it is possible to overestimate the attitudinal impact of a presidential administration, and recent survey research by Intead and Studyportals found a majority of prospective international students this fall were “indifferent” to the election outcome and how it might affect their plans to study in the U.S., according to The PIE News. There is certainly no monolithic view of President-elect Trump or U.S. politics among international students. If any declines in numbers happen again under Trump, it will likely be in response to policies that specifically impact international students or rhetoric aimed at individuals from their home country or region of origin. It may also be driven in part by visa delays and denials caused by administration policies.
Policies and politics in other major host countries
One other major factor is current policy changes in other major host countries, driven largely by politics and public opinion, which might actually boost the attractiveness of the U.S. The other three Big Four predominantly anglophone destinations—Australia, Canada, and the United Kingdom—have had massive international student enrollment in recent years, particularly as a percentage of total higher education enrollment. According to IIE’s Project Atlas, Canada’s international enrollment rate in 2023 was 30 percent, Australia’s was 24 percent, and the U.K.’s was 22 percent. (By contrast, only 6 percent of U.S. higher education students were international, although overall size of its system makes the U.S. numerically the top enroller of international students.) Canada’s enrollment in particular has seen explosive growth, a rise of nearly 70 percent from 2019 to 2023. Many Canadian locales have struggled to accommodate such an influx, often viewed as a way to fill provincial funding gaps yet sometimes lacking steps to ensure students’ well-being.
Additionally, international students have been ensnared in broader immigration debates within these three countries, often being unfairly blamed for systemic housing and employment challenges, among other issues. As in the U.S., immigration has been a major political topic in many Western countries and in recent elections in France and the U.K.
As a result, the other three Big Four countries have begun implementing policies designed to rein in international enrollment growth and limit access to opportunities to work and stay after graduation. Canada, which according to IIE’s recent Open Doors briefing just overtook the U.K. to become the second most popular international student destination, adopted new policies in rapid-fire succession from late 2023 to fall 2024. The most consequential is a cap on the number of study permits (required in Canada for international students) granted per province, particularly meant to limit growth in higher-enrollment provinces, in 2024 and 2025. Other new policies include a significant hike in the financial resources international students are required to demonstrate, restrictions on work permits for spouses, limits on permission to work during study, and stricter requirements for obtaining the popular post-graduation work permit (PGWP), which allows graduated students to work in Canada and often transition to permanent residency.
The Australian government is strongly considering similar caps on international student enrollment in an attempt to reduce overall migration to the country. Already it has stricter visa regulations for international students, including stronger “tests” to ensure that prospective students are coming with the intention of studying, not working, as well as a significant increase in the visa fee. In the U.K. a new regulation enacted by the Conservative Party prohibits international students at all levels except postgraduate from bringing family members starting in 2024, in order to “slash migration and curb abuse of the immigration system,” according to the U.K, government. The new Labour government has opted not to reverse the policy.
The effects of these changes are already evident. The three other Big Four countries are all seeing declining applications for relevant visas and permits. Preliminary analysis of Canadian study permit application data shows the number of approved study permits will likely come in below the actual caps for 2024. The U.K. reported a 16 percent drop in student visa applications in summer 2024 compared to the same time period in 2023, and in Australia, the decrease in such applications has been particularly steep, nearly 40 percent from October 2023 to August 2024.
So far, the prospective beneficiary of these changes has been the U.S., according to both prospective student surveys and media reports. For example, in IDP Education’s Emerging Futures Report for 2024, a prominent series based on prospective student survey data, the U.S. came in second place (at 23 percent) as destination of choice for survey takers, just behind Australia (24 percent). Interest in the U.S. increased four percentage points; Australia’s percentage point declined by one. By contrast, interest in the U.K. and Canada decreased 1 percent and 9 percent respectively, dropping them to third and fourth places. In media coverage of the restrictions, Indian outlets such as Business Standard and The Indian Express note that many Indian students are switching focus to the U.S, although some, including the Express, also report students are looking beyond the Big Four to other study destinations entirely.
Still, President-elect Trump may introduce cuts or caps of his own, which, depending on their scope, may cause the U.S. to lose its developing enrollment edge. If all Big Four destinations have policies significantly cutting student influx, that could alter the student mobility landscape, shifting enrollments to other countries—notably, smaller anglophone destinations such as Ireland, New Zealand, and Singapore and non-predominantly anglophone countries in continental Europe and Asia—where English-taught programs have increased greatly in recent years.
Student mobility in an uncertain world
The incoming Trump administration and policy changes in other countries are only two factors apt to impact movement to the U.S.; internal issues in other countries and regions also come into play. For example, while U.S. policies and tensions with China have affected the number of Chinese students coming to the U.S., factors within China also played a role, as we examined in a recent series in WENR.
Worldwide, uncertainty and systemic challenges lie ahead. Several major conflicts, notably Russia’s war in Ukraine and escalated fighting in the Middle East, threaten to spiral into bigger geopolitical crises. Authoritarianism is rising around the globe, creating more potential crises, as is the threat of climate change, with 2024 recently declared the hottest year on record. Among its many effects, climate change will likely continue spurring global migration, including, increasingly, the forcibly displaced. In fact, all these factors will likely increase global migration. Luckily, U.S. institutions are well-placed to take in students from affected regions and offer them pathways for academic and professional growth.
In general terms, there is reason for optimism. Global student migration will continue and most likely rise, increasing economic and social opportunities for many globally mobile young people. International students also benefit their host societies, communities, and institutions, including domestic students, by bringing diverse international perspectives as well as economic benefits. By some estimates, international students will increase worldwide from about 6 million in 2023 to 10 million in 2030. The U.S. could host as many as 2 million, a still significant capacity compared to other destinations.
Despite domestic and international pressures, U.S. institutions can continue to demonstrate the value of a U.S. education and what unique value they in particular offer. They can continue to make clear, through channels like the #youarewelcomehere campaign, that international students are both accepted and embraced. Institutions can continue to show that international education benefits not only students and institutions but communities and the nation. For example, huge numbers of U.S.-based entrepreneurs and STEM professionals came to the U.S. as international students and have been an asset for U.S. business and research and development. And international educators can advocate for policies at local, state, and federal levels (for example, via NAFSA: Association of International Educators) that continue to make the U.S. a hospitable place for students from abroad.
Most important, U.S. institutions can and should take proactive steps to ensure inclusion and integration of their international students. This means initial support in everything from securing good housing to culturally sensitive mental health resources to campus career services that recognize international students’ unique needs. It may mean assisting students with financing in any way possible. It also means more efforts toward academic and social integration, which involves educating faculty, staff, and domestic students as well.
Looking to the future, U.S. policymakers, educators, and institutions must work together to create an environment that remains welcoming, inclusive, and responsive to the needs of international students. By doing so, the U.S. can maintain its position as a global leader in higher education and continue to benefit from the diverse perspectives and talents that international students bring.
[1] Open Doors is an annual census of international students (those on a nonimmigrant student visa) enrollment in U.S. higher education institutions, as well as U.S. students who studied abroad two academic years prior.
[2] The Fall Snapshot Survey is sent to all institutions that report data to IIE for Open Doors. This year, IIE collected 693 valid responses.
[3] Open Doors always tracks data from the previous full academic year.
[4] The SEVIS data released by DHS is usually the most up-to-date data available. Open Doors, however, provides more analysis and a greater breakdown of data compared with what is provided by SEVIS.
[5] Usually, IIE’s Fall Snapshot Survey aligns with current data trends from SEVIS and is a strong predictor of numbers that appear in the following year’s Open Doors Report. This year, however, the data between the Fall Snapshot Survey and SEVIS are quite different, though both indicate slowing growth in international enrollment in the U.S.
[6] Central Asia, which includes mostly former Soviet republics in Asia (such as Kazakhstan and Uzbekistan), only accounts for about 1 percent of total enrollment from the overall South and Central Asia region, according to my analysis of IIE Open Doors data.