This audio is auto-generated. Please let us know if you have feedback.
Dive Brief:
Undergraduate enrollment is on track to grow 2.4% year over year this fall, driving a 2% overall rise in higher education enrollment, according to preliminary data released Tuesday by theNational Student Clearinghouse Research Center. This marks the third year in a row of undergraduate enrollment growth.
Graduate enrollment stayed largely level — up 0.1% compared to the year prior. Enrollment in master’s programs, which host almost two-thirds of this fall’s graduate students, declined by 0.6%. Conversely, doctoral-level programs saw a 1.1% increase in students.
The clearinghouse also found that students’ choice of studies is shifting. Enrollment in computer and information sciences dropped this fall — ranging from a 5.8% decline at two-year institutions to a 15% nosedive in graduate programs — while numbers of health and trade majors rose.
Dive Insight:
Enrollment increased in both shorter-term programs and those that prepare students to work in the trades, the clearinghouse found.
Two-year institutions saw a 8.3% year-over-year enrollment increase in engineering technologies and technicians programs this fall. Mechanic and repair technologies and technicians majors also grew 10.4% at those institutions.
And enrollment rose 6.6% in undergraduate certificates and 3.1% in associate programs.Bachelor’s degrees, in comparison, saw a smaller year-over-year enrollment increase of 1.2%.
On a call with reporters Monday, Matthew Holsapple, the clearinghouse’s senior director of research, stressed that the organization did not conduct student interviews or collect data about their enrollment motivations.
But when asked if the decline in computer science enrollment was a side effect of the proliferation of artificial intelligence, he acknowledged that researchers “have seen the same news reports that you all have seen about challenges in the field,” such as AI-related layoffs in technology sectors.
“I assume students are also seeing that, and they’re using that kind of information to make their decisions,” Holsapple said.
Like last year, community colleges once again came out the winner among institutional types this fall. Public two-year colleges saw 4% annual enrollment growth. That’s compared to 1.9% growth at public four-year institutions and 0.9% at four-year private nonprofits.
“Students continue to gravitate towards vocational certificates and associate degrees, leaving less momentum for growth among bachelors’ seekers,” Doug Shapiro, the clearinghouse’s executive director, said in a statement.
Tuesday’s preliminary data is based on some 8.5 million students at just under half of the U.S. postsecondary institutions that report to the clearinghouse. The report marks the organization’sfirst preliminary enrollment dispatch since announcing a striking methodology error early this year.
In January, the clearinghouse said an undisclosed number of its preliminary enrollment reports had mistakenly counted some first-year college students as dual-enrolled students, who are high school students also taking college classes. That preliminary enrollment report series, called Stay Informed, began in 2020.
Holsapple said Monday that the clearinghouse did not include dual enrollment data in Tuesday’s report. It‘s the first of the group’s new preliminary enrollment series, called Clearinghouse Enrollment Insights.In a release, it said the report has “enhanced methodology, clarified reporting structure, and better connections between preliminary and final data.”
The clearinghouse plans to release its final fall enrollment report in mid-January.
Peer-to-peer conversations can help students to make connections with each other and course content. In a course that requires out-of-class reading, that conversation is highly reliant on students doing their part and completing the assigned reading. However, in recent semesters, students engaging in focused reading in which they annotate text is dwindling. There has been a noticeable decline in students’ engagement with course materials, evidenced by reduced annotations and superficial reading habits (Deale & Hyun, 2021; Mizrachi & Salaz, 2022). It seems as if a quick scan of one of the assigned pages is the best effort. Without adequate reading, students will be reluctant, or unable, to participate in class discussions and conversations for lack of understanding and fear of not ‘measuring-up’ to peers (Severe, E., Stalnaker, J., Hubbard, A., Hafen, C. H., & Bailey, E. G., 2024). Subsequently, instructor facilitated classroom conversations intended to enhance understanding of course content may stagnate and falter. Naturally, to maximize student engagement with course content, students must have a degree of self-awareness and desire to do the work assigned to meet the goal of understanding, and mastering, course content.
The frame of content engagement can look different based on course, instructor and level of student. In this case, engagement is on the ‘micro’ level as it offers ideas on what can happen before, during, and after class (Handelsman, M. M., Briggs, W. L., Sullivan, N., & Towler, 2005). While engagement can be observed in many forms, this piece focuses on transactional engagement in which students interact with each other and with the instructor (Zepke & Leach, 2010). As instructors, we can provide the tools to help students engage with content and meaningfully participate in conversation to develop a more robust understanding of coursework.
Course Context
I teach a required, writing-intensive course for students in their junior year of their undergraduate studies. In addition to a heavy writing component, there is also a heavy reading component. While students enjoy the subject matter, they are not terribly thrilled by the amount of reading they are expected to complete. Generally, students start the semester strong, by keeping up with reading, sharing key points and participating in organic content-based conversations. By week four, they hit a wall. There is a notable drop off in the reading and conversations. In an ongoing effort to support students, I altered the clarified expectations and gave more support to students, both in class and beyond.
Choices
Students are busy with layers of competing obligations including classes, work, university organizations and athletics that may impact their time to prepare for class. They may also feel underprepared for reading focused non-fiction, informational texts that require more attention than a casual fiction novel. Being mindful of some students’ sensitivity to what they perceive as inadequate skills, the strategies listed below were shared in class. The whole group presentation and in-class practice encouraged students to try all the tools and self-determine which was most helpful for the time and abilities.
Before Class
Students were introduced to three strategies to use to capture the key points of the assigned reading. The activities provide multiple entry points that allow students to utilize the tool right away.
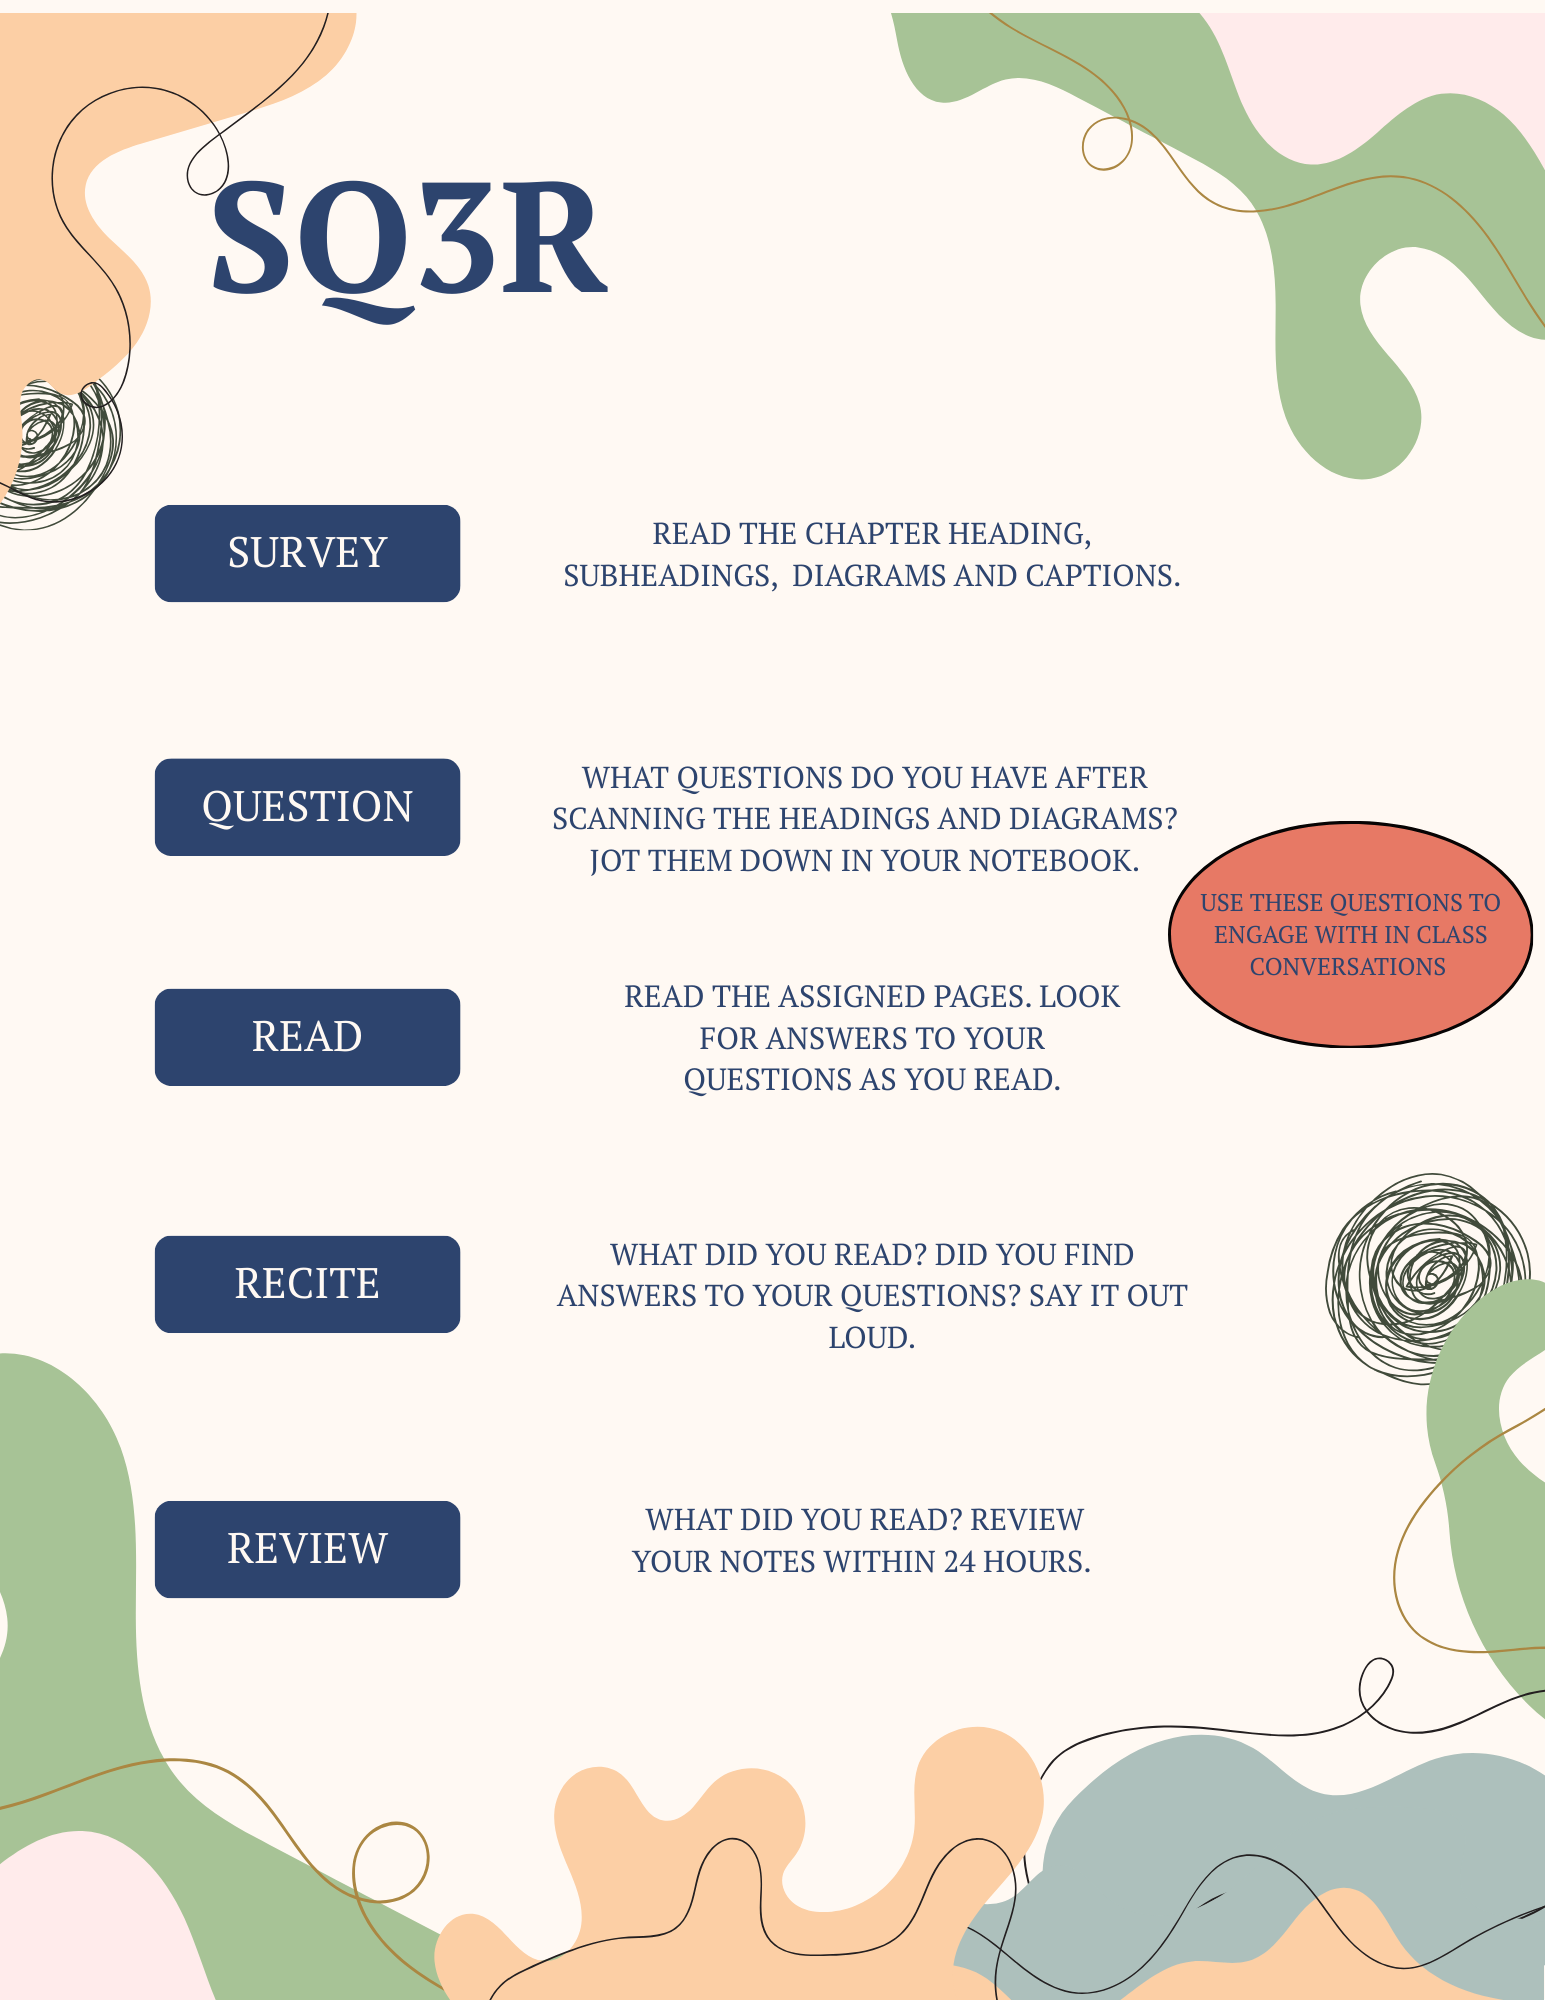
SQ3R. Although this is not a new strategy, I was surprised at how few students had experience working with it. Preparing to join classroom discussions requires intentional preparation. Some students may feel underprepared and think a simple scan of the assigned readings will enable them to join a conversation. While that may work on a superficial level, robust, and meaningful conversation requires proactive work. For students unsure of how to read for maximum understanding a review of the SQ3R strategy is helpful. After a class introduction to the strategy, all students are given a handout with the students so they can utilize as they see fit.
SQ3R
Launchpad. For some students, the formulaic nature of a guided strategy, like the SQ3R, may be too limiting. For the student that wants to prepare for in-class conversation, preparing and providing a few open-ended reading reflection questions (launchpad ideas) may be useful. The questions are intentional few in nature so students can focus on responding to one or two and reading to find solid text evidence to support responses.
Launchpad Example 1Launchpad Example 2
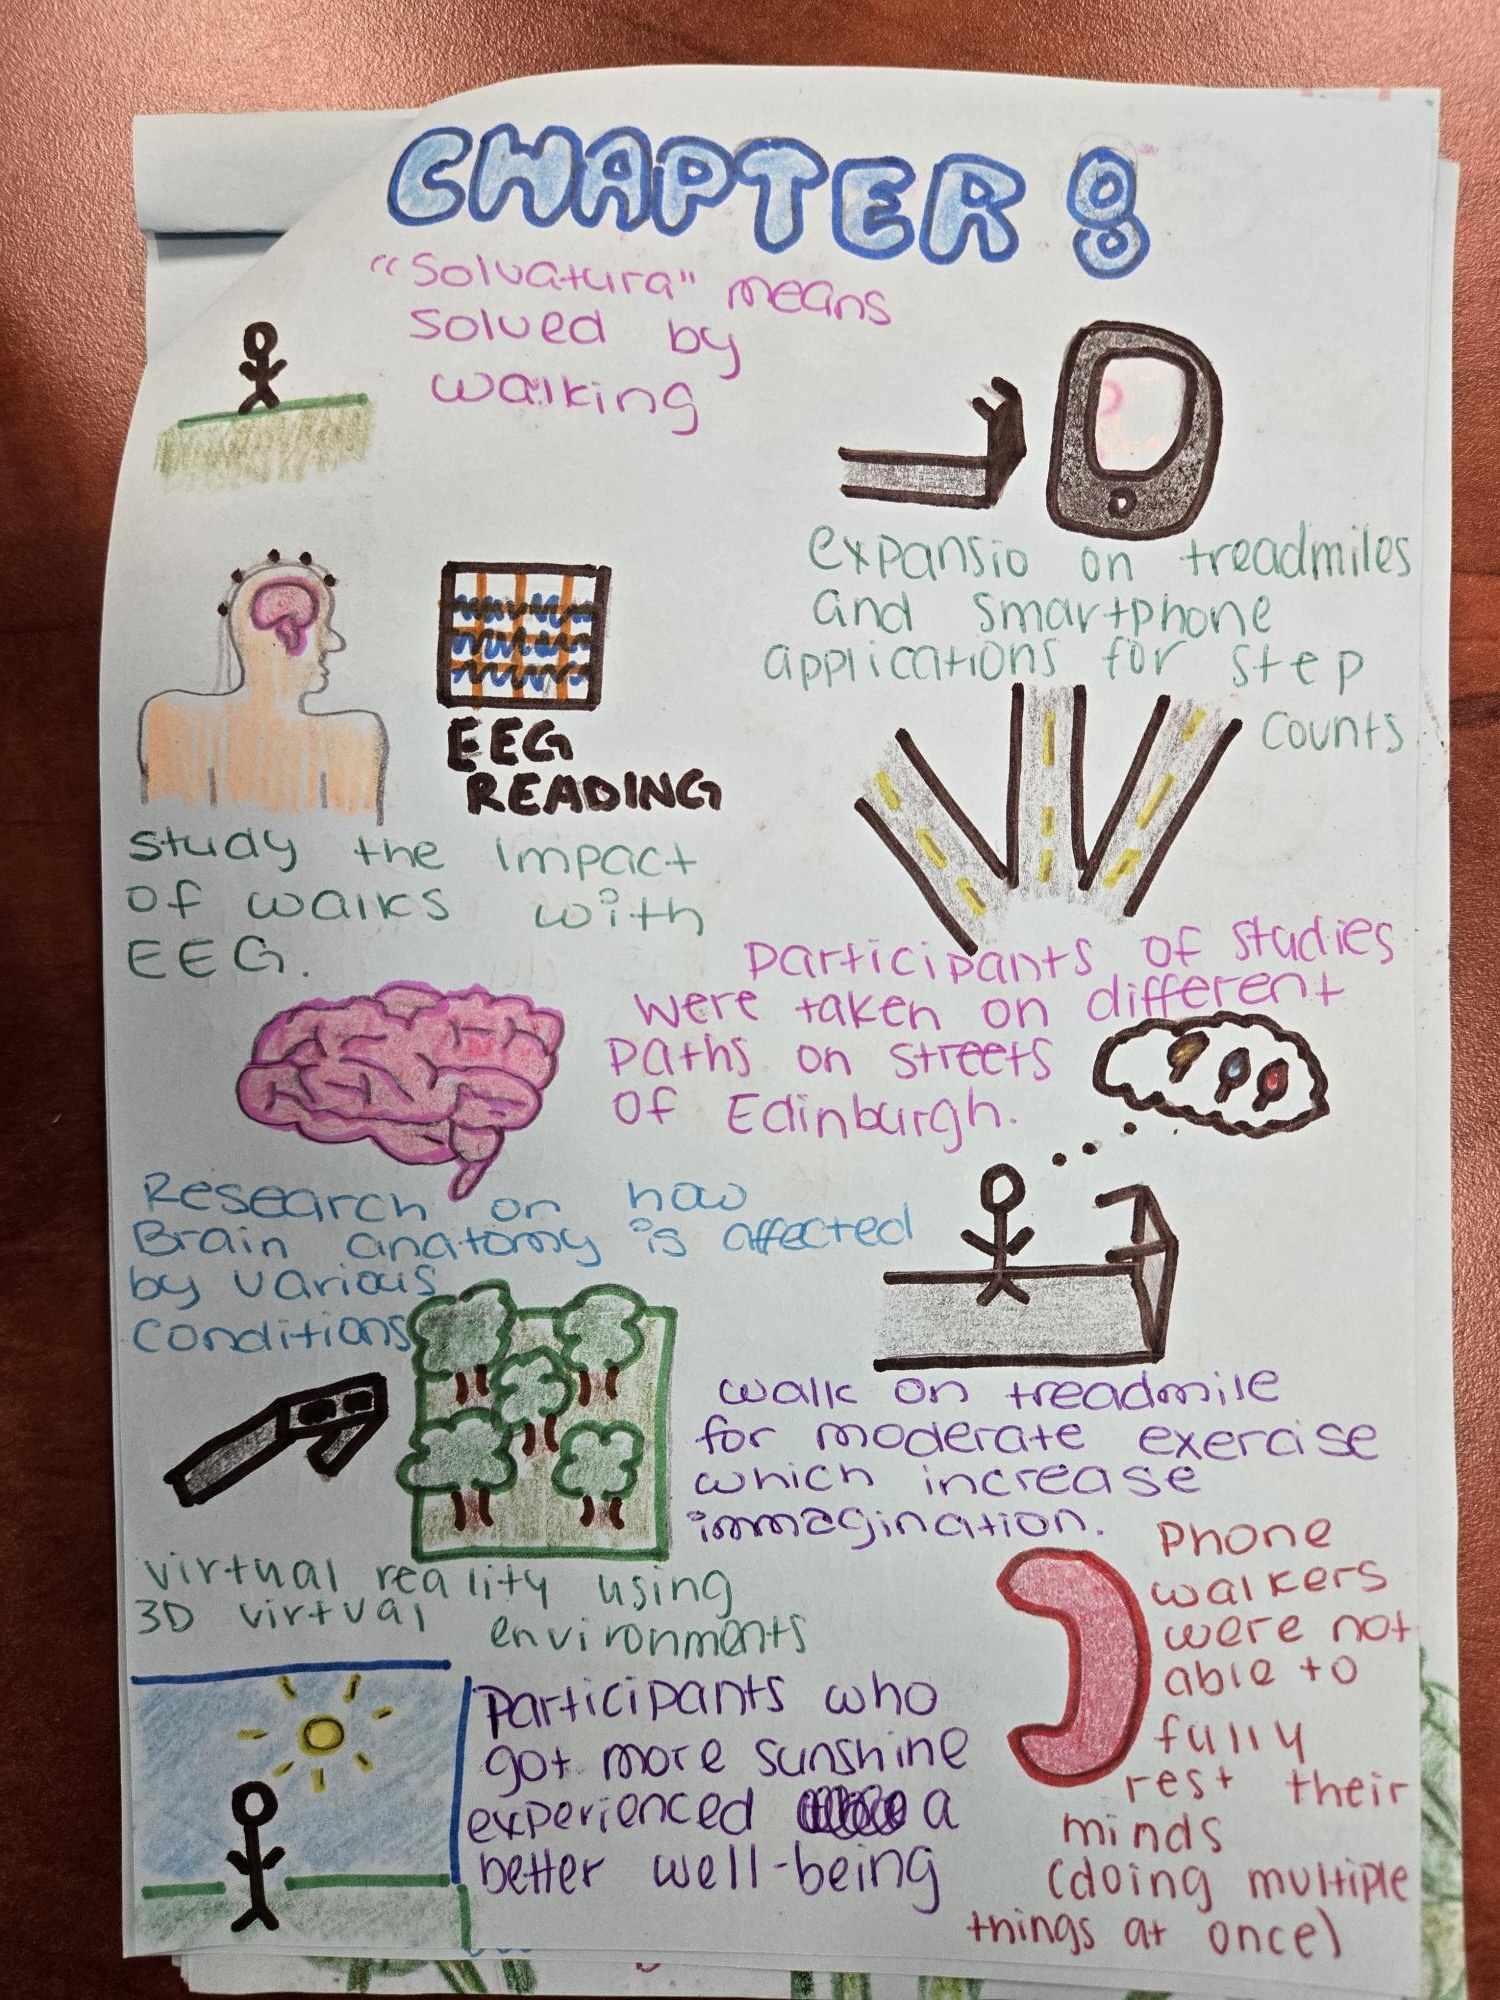
Sketchnoting. For students that best express their understanding visually, sketchnoting is a wonderful tool (Parks, 2022). Sketchnoting involves using images, words, and colors to make thinking visible on paper (or a device). When introduced in class as a worthwhile way to capture understating, students may be more likely to try the method rather than just trying to remember what they read.
Sketchnote
The First 10 Minutes of Class
Even with adequate preparation and readings, students get busy with other obligations between assigned coursework and class time. To help students feel prepared, the first 10 minutes (no more) of class is provided as a focused reflection.
Focused Reflection. During the 10-minute reflection, students may review their SQ3R notes, add to their reading reflections or sketchnotes. Students may also reread (or, for some, read) the assigned pages. For students that have done it all, they are tasked with doodle time. It’s not as unstructured as it seems.
Doodle Time. If a student is reluctant to participate in any of the focused reflections, they are given a doodle paper and three colored pencils. The expectation is to keep the pencils moving during the entire 10-minute period. Some students may start by drawing squiggles or lines, but they do transition into drawing sketches of things they’ve read. Once students believe there is no judgment on their artistic ability and that the focus time is really intended to help them think about the course content, they respond positively to the task. Some have even transitioned from doodling to sketchnoting because, as shared by one student, “it matches the way I think.”
By allowing this 10-minute period to capture thoughts, students have to ability to organize their thoughts and feel confident in their classroom conversation contributions. While it doesn’t level the field completely, and there are still students that do not read, those that do have shared they appreciate the time to refocus their attention on the coursework.
There are only two rules for focused reflection time. The rules are aimed at keeping the classroom distraction free.
No talking (to me or each other). The quiet period allows think-time for all students.
No devices. The device free period encourages students to independently think about the assigned readings without supporting- or competing- interests. Students are told candidly, I care about their input, not a generative AI summary of the reading.
Building a Safe Space for Conversations
Even with adequate preparation, sharing connections to coursework can be daunting. To support students in the process, a small to big approach is beneficial. First, students are assigned, by the instructor, into conversation corner groups. These groups are intentionally small to promote equitable opportunities to speak. With small classes, I create the groups and intentionally separate any groups of friends to provide opportunities for students to interact with others that may bring new perspectives to the conversation. For larger groups, a random group generator such as https://www.randomlists.com/team-generator can be used. After allowing small group conversation, the students are transitioned into whole group discussions in which they share understanding or respond to instructor posed questions as a group.
Getting the Conversation Going
Students may need help starting content-based conversations. Using a ‘fun’ tool engages students and allows all to have a chance to contribute.
Spinning Questions. Pickerwheel (https://pickerwheel.com) or Spin the Wheel (https://spinthewheel.io/#google_vignette) are sites that allow the instructor to enter questions into a spinning wheel. Students spin the wheel and respond to questions in small groups. Students can also create a discussion wheel in their instructor assigned small groups using the questions they created for their SQ3R notes.
Conversation Cards. The use of Conversation Cards can help students engage in focused conversation about course content. Students can either draw random card or review all cards and choose the one that is most appealing to them.
Conversation Card Example 1Conversation Card Example 2Conversation Card Example 3Conversation Card Example 4Conversation Card Example 5
Ending Class
Ending class with an individual account of progress toward mastering course content helps students self-determine their next steps.
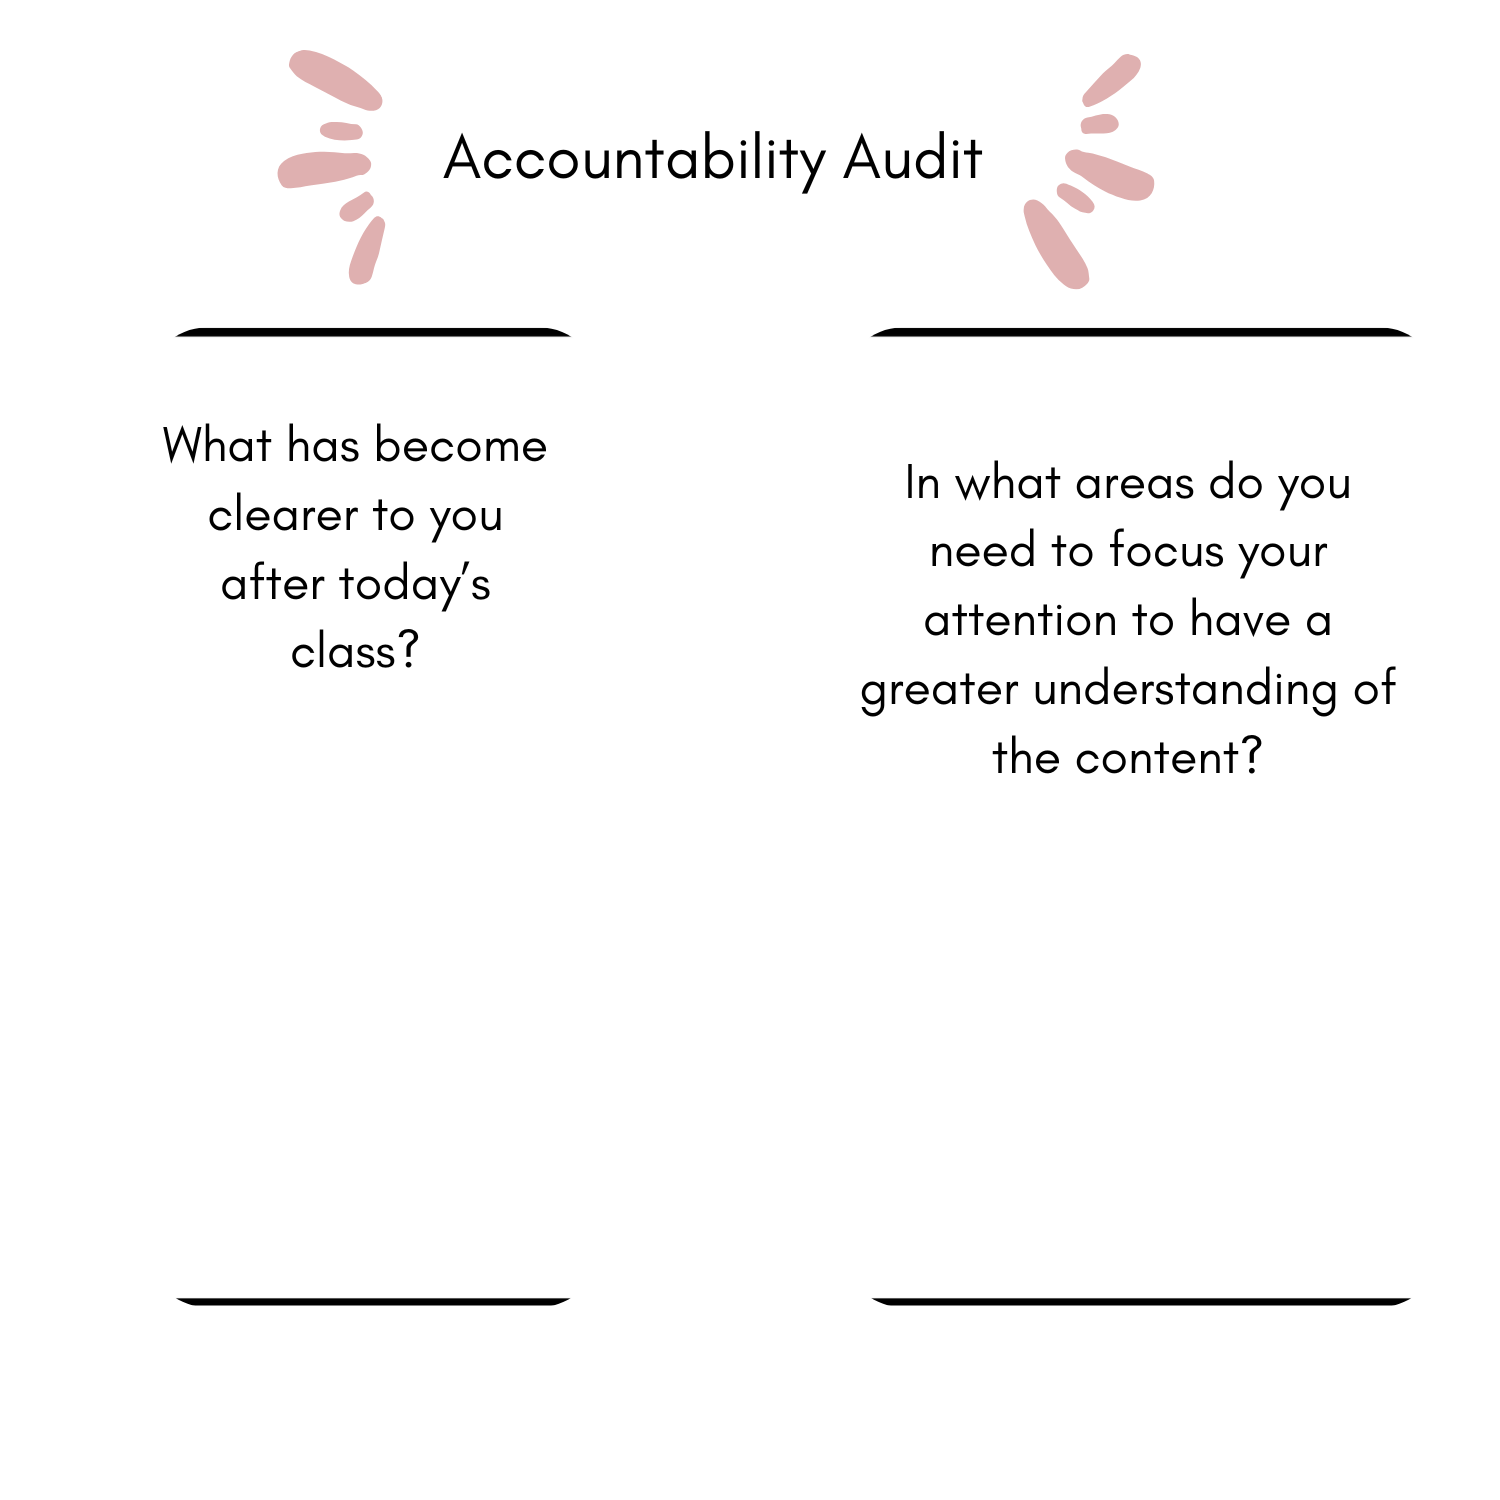
Accountability Audits. As a ticket out the door, students can complete an exit slip capturing their efforts for the day. Instructors may use the exit tickets as participation grades or as formative assessments to determine how students are understanding content. With larger courses, the instructor may elect to review a random sample of the work, telling students the work is about personal reflection and accountability. Exit slips may be handwritten or they may be done electronically.
Accountability Audit
One Last Word. Sometimes extra paper and written work just won’t work. An alternative is to ask individuals, or small groups of students, to suggest one word that sums up the main points of class. The main caveat is no word may be repeated. This one is fun, quick and pushes students to categorize their learning. Please consider a note of caution—this one can quickly turn into a small competition with individuals or groups trying to go first so “their” word is not shared by another group. Don’t worry—it’s all in good fun.
While engaging with content cannot be forced, finding tools that are interesting for students, focused enough for instructors to feel confident valuable class time is used productively and reinforces key points can make learning accessible to all.
Melissa Parks, PhD, is an associate professor of education at Stetson University in Deland, FL. Dr. Parks is an active member of the National Science Teaching Association (NSTA) and is currently a member of the NSTA Early Childhood- Elementary Science Teaching Committee. Her research interests include elementary pedagogies and environmental stewardship.
References
Deale, C. S., & Lee, S. H. (2021). To read or not to read? Exploring the reading habits of hospitality management students. Journal of Hospitality & Tourism Education, 34(1), 45–56. https://doi.org/10.1080/10963758.2020.1868317
Handelsman, M. M., Briggs, W. L., Sullivan, N., & Towler, A. (2005). A measure of college student course engagement. The Journal of Educational Research, 98(3), 184–192. https://doi.org/10.3200/JOER.98.3.184-192
Mizrachi, D., & Salaz, A. M. (2022). Reading format attitudes in the time of COVID. Journal of Academic Librarianship, 48(4), 102552. https://doi.org/10.1016/j.acalib.2022.102552
Parks, M. (2022). Drawing in college: Using sketchnoting to support student engagement. Faculty Focus. Magna Publications.
Severe, E., Stalnaker, J., Hubbard, A., Hafen, C. H., & Bailey, E. G. (2024). To participate or not to participate? A qualitative investigation of students’ complex motivations for verbal classroom participation. PloS one, 19(2), e0297771. https://doi.org/10.1371/journal.pone.0297771
Zepke, N., & Leach, L. (2010). Improving student engagement: Ten proposals for action. Active Learning in Higher Education, 11, 167-177. doi:10.1177/1469787410379680
And analysis suggests campuses are already seeing an influx of applicants from the U.S. itself. Figures from the University and College Admissions Service, UCAS, show that 6,680 U.S. students applied to U.K. courses for 2025–26 by the main deadline at the end of January.
This was a 12 percent increase on the year before and the most since comparable records began in 2006. It surpasses the previous record of 6,670 set in 2021–22 and is more than double the demand in 2017.
Maddalaine Ansell, director of education at the British Council, said she was “delighted” by the 20-year high.
“It’s a testament to the quality of U.K. universities that so many people want to study here. Three-year degrees, lower tuition costs and poststudy work opportunities all increase the attractiveness of the U.K. offer,” she said.
“As well as adding to the vibrancy of their courses, we hope that these students will also take a lasting affection for the U.K. forward into their future careers and stay connected with us for years to come.”
Almost two-thirds (63 percent) of the applicants from the U.S. were 18 years old, and 61 percent were women.
The UCAS data covers undergraduate applicants, but separate figures show an uptick in demand at all levels—even before Trump’s second term began.
Recent Home Office statistics reveal that 15,274 U.S. main applicants were issued sponsored study visas in 2024.
Recent research by the British Council found that more international students would choose the U.K. over the U.S. as a result of Trump’s return to the White House.
Universities UK said the increase in demand to study in the U.K. is positive, following a turbulent period for international student recruitment.
“But it is too early to say whether this is the start of a longer-term trend,” added a spokesperson.
“What is important now is for universities and government to continue to work together to promote the U.K. as a welcoming destination, and to preserve our competitive offer to international students.”
Today’s undergraduate enrollment and recruitment strategies should be data informed and personalized, prioritizing quality over quantity.
“Flipping the funnel” shifts the focus from mass marketing to building meaningful, tailored connections with students, ensuring better matches and higher retention rates.
Student personas and data analytics enable institutions to craft targeted messaging that resonates with individual student goals.
Liaison’s tools empower colleges to use predictive analytics, real-time engagement, and tailored outreach to attract and retain students who are well-suited to their programs.
For today’s higher education institutions, attracting the right students is more important than reaching a high volume of applicants. Traditional enrollment models that rely on casting a wide net and filtering through broad pools of applicants are no longer enough. Colleges and universities must instead adopt data-informed, personalized strategies that focus on quality over quantity.
Liaison’s suite of advanced toolsmakes this possible, offering data-focused insights, real-time engagement capabilities, and tailored outreach options. This approach not only streamlines recruitment but also ensures a stronger match between students and their chosen programs, leading to higher yield and retention rates and ultimately providing a more fulfilling educational journey.
Flipping the Funnel: Moving From Volume to Value
Historically, institutions have used a “funnel” approach to undergraduate admissions and recruitment, beginning with a large pool of prospective students and narrowing the field. But with today’s intensified competition, this model is proving less effective. Rather than expanding the top of the funnel by acquiring more student names, “flipping the funnel” is a strategic approach that begins with the end goal in mind: enrolling and retaining the students who will thrive at your institution.
Flipping the funnel shifts the focus from raw numbers to meaningful connections. Instead of mass marketing, this approach encourages institutions to recruit based on the distinct needs, goals, and interests of each student cohort. Just as each program or field has unique strengths, each student brings unique aspirations and potential. This customized outreach means that a prospective engineering student, for instance, might receive information about hands-on lab opportunities, while a fine arts student sees highlights of campus studios and faculty profiles. Liaison’s Enrollment Marketing and CRM solutions facilitate this tailored approach, allowing schools to reach specific audiences on digital platforms with messages that resonate with individual student interests.
Building Student Personas to Enhance Targeting
Understanding how to recruit undergraduate studentswho are likely to succeed and remain engaged throughout their academic journey requires a clear understanding of those students. Creating detailed student personas—representations of ideal applicants based on real data—lets institutions tailor their outreach with pinpoint accuracy. For example, Liaison’s CRM solutions facilitate this process by analyzing key data points such as academic background, geographic location, and behavioral insights, helping teams identify the students most likely to flourish and stay enrolled.
With clear student personas in mind, institutions can deliver customized messaging that aligns with students’ priorities. For example, a prospective first-generation student may be most interested in affordability and support services, while a STEM-oriented applicant might respond better to information about research facilities and career pathways. Crafting communications based on these personas enhances engagement and strengthens student bonds from the beginning. By sending recruitment messages that truly speak to students’ goals, institutions foster a sense of belonging, which in turn improves retention and satisfaction rates.
Utilizing Data Analytics for Personalized Interactions
Data analytics has become an essential tool for individualizing outreach to connect with the right students with the right message at the right time. Real-time data enables institutions to track student responses, identify prospective students’ preferences, and adapt strategies based on what works best. Liaison’s AI solutions are designed for this agile approach, allowing institutions to monitor interactions and adjust their recruitment efforts dynamically throughout the enrollment cycle.
With predictive and prescriptive analytics, schools can employ advanced tactics like retargeting, which reconnects with students who may have previously shown interest but haven’t yet committed. By capturing students’ attention during “micro-moments” as they browse social media or search online, institutions can stay relevant and timely in their communications. This data-informed approach—using Liaison’s Enrollment Marketing and digital services—increases enrollment numbers and forms trust with students by providing content that aligns with their journeys. The result? Stronger engagement and a greater likelihood of success.
Transforming Enrollment With Data-Informed Precision
In higher education, student recruitment requires a thoughtful, data-centered approach that emphasizes quality over quantity and personalization over generalization. By leveraging tools like Liaison’s Enrollment Marketing, TargetX, Outcomes, Search, and Othot, institutions can move beyond traditional methods and create recruitment strategies that attract students who are well-suited to their programs. By creating tailored recruitment strategies aligned to student cohort needs, you inspire students with a stronger sense of belonging and deeper engagement throughout the enrollment cycle. That, in turn, drives long-term success on your campus.
To discover how Liaison’s technology solutions can transform your recruitment practices, reach out to us today. Our team is ready to help you implement data-backed, individualized outreach strategies that benefit your institution and future students alike. Contact us for a demo or a consultation to see how Liaison’s tools can elevate your enrollment efforts!
About the Author
Craig Cornell is the Vice President for Enrollment Strategy at Liaison. In that capacity, he oversees a team of enrollment strategists and brings best practices, consultation, and data trends to campuses across the country in all things enrollment management. Craig also serves as the dedicated resource to NASH (National Association of Higher Education Systems) and works closely with the higher education system that Liaison supports. Before joining Liaison in 2023, Craig served for over 30 years in multiple higher education executive enrollment management positions. During his tenure, the campuses he served often received national recognition for enrollment growth, effective financial aid leveraging, marketing enhancements, and innovative enrollment strategies.
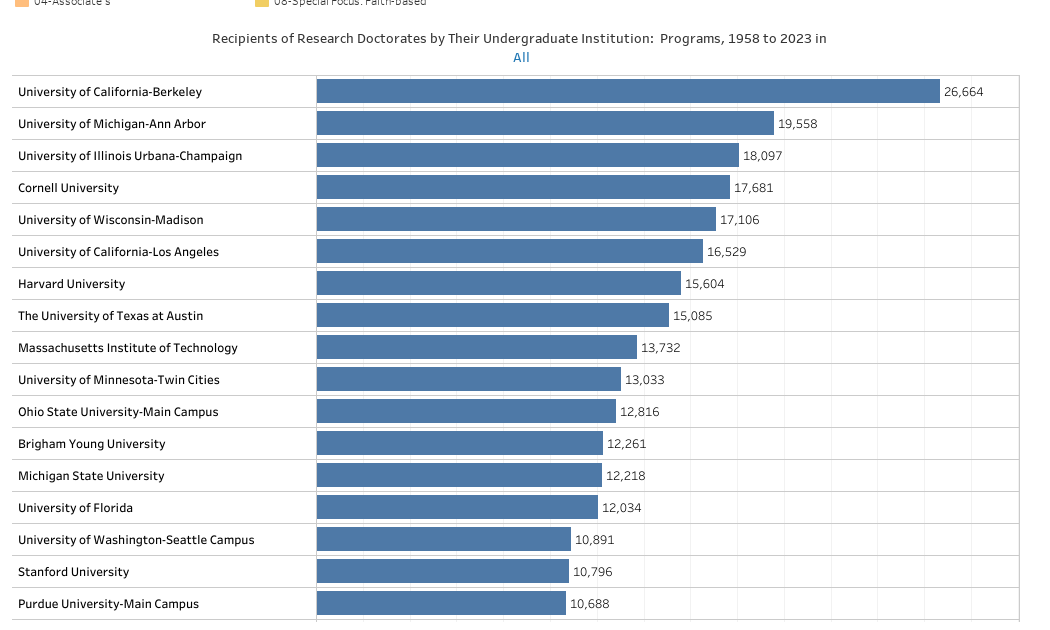
This is a popular post each year with high school and independent counselors working with students who are already thinking about a doctorate. It shows the undergraduate institutions of doctoral recipients from 1958 to 2023. (It does not show where the doctorate was earned, to be clear.)
It’s based on data I downloaded from the National Science Foundation using their custom tool. It’s a little clunky, and–this is important–it classifies academic areas differently before 2020 and after, but with a little (OK, a lot) of data wrangling over the long weekend, we have something for the data junkies out there.
This is for fun and entertainment only, because, as I indicated, the categories are not quite the same, and for the sake of clarity, I had to combine similar (but not identical) disciplines.
There are two views, using the tabs across the top. The “All Data” view allows you to filter to your heart’s content. The purple boxes allow you to limit the type of institution of the bachelor’s degree recipients: You may want to look at Public Universities in the Southeast, for instance, or all Catholic colleges (listed as “Roman Catholic” in the filter, by the way). The tan boxes allow you to specify the doctoral degree area (Chemistry, or Political Science, for instance), and to limit the years. You might want to look at 2017 to 2023, or you might want to get nostalgic and look at 1958 to 1965, for instance.
The bars, which are colored by Broad Carnegie type, display the counts. Us the scroll function at the right to see more data.
The “Top 30” view limits to those places that produce the most students earning doctorates. The labels show you the Rank (in orange), the counts (in blue) and the percent of total (in purple). The percents are only calculated on the group you’ve selected, not the grand totals.
This always generates four questions:
Can you show these as a percentage of the graduates of this institution? No, because not everyone who graduates with a doctorate does it in the same time. I’d have to take lots of data and make some wild guesses.
Can you show what these students majored in at the undergraduate level? No, that’s not available in the public sets, and I don’t want to apply for the restricted use license. If you do, and you want me to work on this, let me know.
Can you crosstab this data to show, for instance, where the Stanvard graduates earned their doctorate? Again, it’s not in the public data set, so no.
What about other doctorates, like MD or Pharm.D or DDS? It’s not included: These are research doctorates only.
If you use this in your business and want to support my time and software and hosting costs, you can do so here. If you’re a high school counselor or a student or parent, just skip that link.


