

The post Emerging leader of the year 2025 – Bimpe Femi-Oyewo appeared first on The PIE News.
Tag: Year
-
Colorado’s 3rd year of Universal Pre-K Gets Off the Ground – The 74
Join our zero2eight Substack community for more discussion about the latest news in early care and education. Sign up now.
Sign up for Chalkbeat Colorado’s free daily newsletter to get the latest reporting from us, plus curated news from other Colorado outlets, delivered to your inbox.
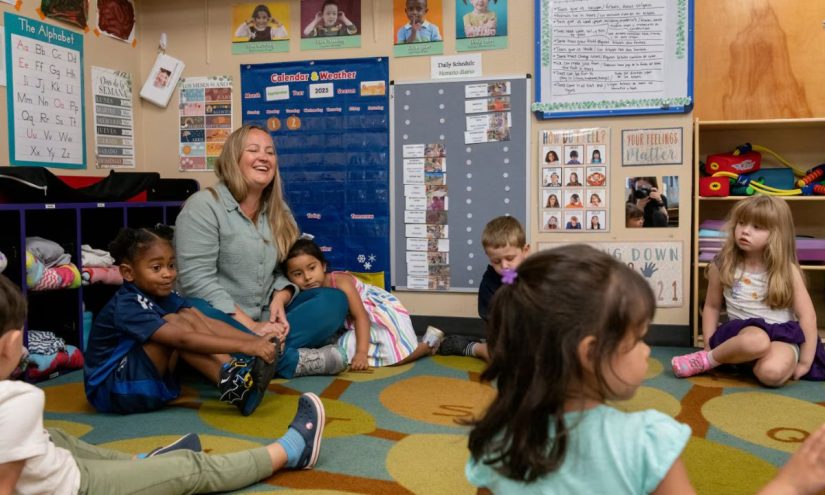
The little boy clung to his mother as she carried him through the wooden half-door of the preschool classroom on Tuesday morning. Tears streamed down his face. It was going to be a tough drop-off.
While other children finished bananas, raisin bagels, and milk, Vraja Johnson, the lead teacher, ushered the mother and son toward a cozy corner in the back of the classroom. She spoke softly in English and Spanish to the nervous preschooler. Several minutes later, when his mother had slipped away, the boy nestled into a large blue beanbag clutching Tucker the Turtle, a stuffed animal that helps preschoolers understand that it’s OK to retreat into your shell — and to come back out when you’re ready.
It was the first day of preschool in the Otters classroom at El Nidito, a bilingual child care program at The Family Center in Fort Collins. The little boy and his 11 classmates are among 40,000 children enrolled in Colorado’s universal preschool program this year. The $349 million program offers tuition-free preschool — typically a half day — to all children in the year before kindergarten.
Now entering its third year, Colorado’s preschool for all program has smoothed out since its rocky rollout in 2023. At the time, application system errors, glitches in the state’s preschool matching algorithm, and last-minute reductions in preschool hours for some children caused widespread confusion and frustration.
A national early childhood group recently ranked Colorado third in the country for the share of children served by state-funded preschool. Around 70% of the state’s 4-year-olds are enrolled in the program, which generally covers about $6,000 a year in preschool costs per child.
But wrinkles remain. The state is still fighting two lawsuits brought by religious preschools that objected to non-discrimination rules protecting LGBTQ children, families, and employees. Both suits are pending in federal appeals court. And the national early childhood group found that Colorado meets only two of 10 benchmarks meant to ensure that preschool classrooms are high quality.
Currently, the “universal preschool” label doesn’t indicate anything about the caliber of classroom a child will join. Rather, it simply indicates the state is paying for 10 to 30 hours of class time. Of about 2,000 preschools participating in the program, some have the state’s lowest rating and meet only basic health and safety standards.
Others, including El Nidito, which has been around for 25 years, have the state’s highest rating.
A morning in Johnson’s classroom makes it easy to see why. She and her co-teacher, an experienced sub named Maria Chavira, are warm, cheerful, and organized. Their young charges are curious, silly, and always in motion.
Maria Chavira, a substitute teacher at the El Nidito child care program in Fort Collins, puts sunscreen on a preschool student before they go outside. (Rachel Woolf for Chalkbeat) During breakfast, two boys held bananas up to their ears like phones.
“Ring, ring, ring. Hi, Henry,” one said as the other burst out laughing.
Nearby at the sensory table, as one little boy poured dried pinto beans through a cardboard tube, he said, “Did you ever watch ‘Boss Baby?’ The baby is a bossssss. Babies can’t be bosses!”
Meanwhile, the little boy who’d struggled to leave his mother was getting braver, slowly testing the waters of group play. One minute he crouched next to a little girl in front of a tree house play set. Later, he tried out bear and leopard hand puppets as the Boss Baby skeptic threw Tucker the Turtle up in the air next to him.
Johnson, who switched from a sales and marketing career to early childhood education in 2007, seems to have a sixth sense for detecting imminent meltdowns, skirmishes, and rule-bending.
She quickly peeled away from a conversation with a visitor when a little girl dressed in head-to-toe pink accidentally got a squiggle of red marker on her new cowboy boots.
“Your mom can get that out. The markers are washable,” Johnson said as tears welled in the preschooler’s eyes.
Then she averted the crisis with five words: “Do you want a hug?”
Chalkbeat is a nonprofit news site covering educational change in public schools.
Get stories like these delivered straight to your inbox. Sign up for The 74 Newsletter
-

Ten Education Issues to Watch at the Start of the School Year – The 74
Get stories like this delivered straight to your inbox. Sign up for The 74 Newsletter
One big budget bill and 181 executive orders into the Trump administration, one thing is clear for those of us checking our crystal balls ahead of the school year.
There is a big difference between policy change aligned to winning an election and disruption for the sake of chaos.
The three-sentence email sent on June 30 that froze billions of dollars of funding across the education continuum in Republican and Democratic counties around the country the night before the funding was anticipated begs the overarching question facing those working in education:
To state the obvious, the review of the federal funding could have been announced and conducted ahead of the date funds are normally made available, and the disruption could have been minimized.
Instead, leaders on the right and the left had to write letters, file lawsuits, and respond to panicking constituents to move money Congress had already approved to be spent.
“The education formula funding included in the FY2025 Continuing Resolution Act supports critical programs that so many rely on. The programs are ones that enjoy longstanding, bipartisan support,” said Republican U.S. Sen. Shelley Moore Capito from West Virginia.
Many leaders on both sides of the aisle, including Superintendent Mo Green, a Democrat, are hoping for “a return to the predictable, reliable federal partnership that our schools need to serve students effectively.”
That remains aspirational as the federal Department of Education begins to be dismantled, more responsibility is handed off to states, and local and state education agencies have to find ways to work with multiple federal agencies moving forward.
Recently at the summer convening of the National Governors Association, when Colorado Gov. Jared Polis asked U.S. Secretary of Education Linda McMahon for clearer communication, she said, “No guarantees from me that we’ll eliminate all the communication gaps that do happen.”
Our top 10 issues are not the ones featuring most prominently in the news cycle right now.
DEI continues to be in the news, and in case you missed it, over the summer EdNC published perspectives on DEI by a policymaker, a former superintendent, and an educator.
Cellphones and AI in classrooms also continue to be highlighted in the media.
And we know there are many, many other issues you care about, including WNC recovery, literacy, youth wellbeing, learning differences, community schools, school safety, vaccines and school health, school performance and the portfolio model, LGBTQ+ youth, the health of teacher and principal pipelines, STEM, arts and education, and more.
As we head back to school, the EdNC team will continue to cover all of those issues, but here are the top 10 issues we think will frame this school year.
Access to education, opportunity, and the American dream
1. Access to education for immigrants without legal status
For more than 40 years, students without legal status to be in the country have been allowed to attend public schools free of charge in districts across the United States, and over time that has included access to early education and postsecondary opportunities.
Federal case law cites reasons for this decision, including:
- Not wanting to penalize children for their presence in the country;
- Recognizing that many students will remain in the country, some becoming lawful residents or citizens;
- Not perpetuating “a subclass of illiterates within our boundaries, surely adding to the problems and costs of unemployment, welfare, and crime;” and
- Concluding that “whatever savings might be achieved by denying these children an education, they are wholly insubstantial in light of the costs involved to these children, the State, and the Nation.”
The 74 recently reported, “From cradle to career, President Donald Trump has launched a comprehensive campaign to close off education to undocumented immigrants, undercutting, advocates say, the very reason many came to the United States: for a chance at a better life.”
Immigrants without legal status have had access to Head Start since a 1998 interpretation of the Personal Responsibility and Work Opportunity Reconciliation Act of 1996 (PRWORA).
“Head Start is the federally funded, comprehensive preschool program designed to meet the emotional, social, health, nutritional, and psychological needs of children aged 3 to 5 and their families,” according to the N.C. Department of Health and Human Services (DHHS).
“The Early Head Start program — established in 1994 — is the companion program created to address the same needs of children birth to age 3, expectant mothers, and their families,” says the DHHS website.
On July 10, the U.S. Department of Health and Human Services (HHS) said via press release, “Head Start is reserved for American citizens from now on.”
“For too long, the government has diverted hardworking Americans’ tax dollars to incentivize illegal immigration,” said HHS Secretary Robert F. Kennedy, Jr.
The policy shift, says the release, aligns with “recent Executive Orders by President Trump, including Executive Order 14218 of February 19, 2025, ‘Ending Taxpayer Subsidization of Open Borders,’ prioritizing legal compliance and the protection of public benefits for eligible Americans.”
An HHS impact analysis finds, “These figures point to approximately 500,000 children under the age of 5 in poverty who have an unauthorized parent or are unauthorized themselves. Combining this estimate with an estimate that Head Start programs serve approximately 26% of the potentially eligible population, we anticipate that approximately 115,000 Head Start children and families could be impacted, or about 16% of total cumulative enrollment in Head Start programs in FY 2024.”
Also on July 10, “The U.S. Department of Education today announced it will end taxpayer subsidization of illegal aliens in career, technical, and adult education programs.”
The department says that postsecondary education programs — “including adult education programs authorized under Title II of the Workforce Innovation and Opportunity Act of 2014, postsecondary career and technical education programs under the Carl D. Perkins Career and Technical Education Act of 2006, and other programs when used to fund postsecondary learning opportunities” — also constitute “federal public benefits” subject to citizenship verification requirements.
“This policy shift threatens to undermine community development, workforce readiness, and economic mobility across the nation,” says a statement issued by The Presidents’ Alliance on Higher Education and Immigration, an alliance of American college and university leaders. “Many of the named programs are a central component of the nation’s community colleges and provide access for continuing and returning adult learners.”
In 1988 — after the U.S. Supreme Court decision that safeguarded access to K-12 but before the 1996 law that expanded access beyond elementary and secondary education — Dallas Herring, beloved and known as the father of North Carolina’s community college system, wrote, “The twentieth century, by every standard of assessment, in the long view of history, must be considered one of the most remarkable in the experience of mankind. It is especially significant in education, for the opportunity to study and to learn has been extended during these times to almost all of the people everywhere in America. Total education is becoming a possibility as the people respond to the challenge of universal opportunity in education. The door, at last, is open.”
Herring also wrote — as the dawn of not just a new century approached but of a new millennium — that “it was clear that the open door is not enough.”
As the open door begins to close, Herring reminds us what is at stake. “Education of the masses of humanity, not only as economic beings, but especially as human beings, will be essential to the achievement of peace and prosperity,” he wrote.
Data from the Census Bureau population estimates indicate that the nation’s population growth rate in 2023-24 was driven mostly by immigration.
Twenty states and the District of Columbia have filed suit. North Carolina is not one of the 20.
2. Pathways to work are more important than ever
It is almost impossible these days to have a conversation about community colleges, postsecondary access, or attainment without the word pathways coming up.
Sometimes leaders are talking about “guided pathways,” which is a college-wide approach to student success. Nationally, that work had been shifting from an outcomes approach to an access approach.
A much anticipated book to be published by Harvard Education Press in August, “More Essential Than Ever: Community College Pathways to Educational and Career Success,” promises guidance for college leaders and state policymakers.
The cliff notes, according to the authors: “Community colleges today will need to make concerted efforts to strengthen pathways to post-completion success in employment and further education and thus ensure that students’ investment of effort, time, and money pays off.”
“Seamless pathways” often refer to agreements between community college and four-year colleges and universities that improve transfer and graduation rates by improving the student experience.
In 24 states, more than 200 community colleges now offer four-year degrees. North Carolina is not one of them, and a recent essay says, “The debate over who and where bachelor’s degrees should be offered is too often driven by institutional priorities and policies set in the past…. Community colleges can play a central role in helping graduates achieve a bachelor’s degree. States and all colleges should support these low-cost, high-value degree pathways.”
But, both across the nation and our state, it is the pathways for students to enlist, enroll, or employ so they have access to a family-sustaining living wage that is the focus for many leaders, organizations, and initiatives.
And, in North Carolina, it is these pathways that are critically important to the state’s attainment goal.
Citing the 4.6 million youth between the ages of 16 and 24 who are neither enrolled in school nor working a job, the National Governors Association (NGA) is focusing this year on getting students ready for jobs.
In partnership with NGA, America Achieves recently launched its Good Jobs Economy initiative, designed to “build a prosperous, competitive nation where everyone has clear pathways to good jobs, employers access the talent they need, and Americans at large scale can reach and stay in the middle class.”
Lumina Foundation recently announced a new initiative called “FutureReady States” with the goal of increasing access to education and credential training that “pays off in the labor market.”
StriveTogether — a national network with the goal of having 4 million more youth in the United States on a path to economic opportunity by 2030 — has an impact fund that identifies opportunities to improve the experiences of students in high school to set them on a path to college and careers.
Much of this leadership at both the national and state level focuses on different experiences that expedite that pathway for students who want to go from high school or community college graduation straight into the workforce.
It is in this work where terms like work-based learning, apprenticeships, internships, co-ops, and credentials of value; approaches like graduation from high school in three years; and innovative initiatives like SparkNC and the NC Works website come in.
In keeping with this trend, the Federal Reserve Bank of Richmond is implementing a new approach to measuring success through its Survey of Community College Outcomes, “which broadens the definition of community college student success to include not only degree attainment, but also attainment of shorter-term credentials, such as certificates or industry licensures, successful transfer to a four-year institution, or persistence in enrollment beyond four years.”
According to a press release from the N.C. Community College System, beginning in July 2026, the new Workforce Pell Grant program will allow eligible students to use federal financial aid for short-term, high-quality training programs — some as short as eight weeks depending on instructional hours and program design. These programs lead directly to jobs in high-demand fields like health care, engineering and advanced manufacturing, trades and transportation, and information technology, says the release.
“This is a major step forward in making higher education more accessible and responsive to today’s workforce needs,” said Jeff Cox, president of the system.
With a community college system that is 58 strong; a nationally watched model for funding community colleges called Propel; Boost, North Carolina’s accelerated college to career program; and a system whose leadership is in transition again, all eyes are on North Carolina.
3. Exposing middle school students to college
A May 2025 headline in the Associated Press asks, “Can middle schoolers handle college?”
When students at Valle Crucis School (VCS) were displaced after Hurricane Helene, Caldwell Community College & Technical Institute stepped up to host Principal Bonnie Smith, her team, and 120 sixth through eighth grade students on the community college’s campus in Watauga County.
President Mark Poarch said the middle school students were exposed through the experience to many positives and had the opportunity to learn more about college programs and how they connect to industries.
“I think there are a lot of silver linings in having them on a college campus,” said Poarch. So many that the community college’s foundation guaranteed a scholarship for all current VCS middle school students.
“It has brought new energy and new life to this campus unlike anything we’ve ever seen before,” said Poarch.
In Haywood County, another model for exposing middle school students to college will launch in 2026-27.
The innovative new middle school, developed in partnership with Haywood Community College, will be academically rigorous and led by Lori Fox, the principal of Haywood Early College. Under her leadership, the early college is among the best in the nation and an Apple Distinguished School.
California has been leading the way with exposing middle school students to college, and the state is now pushing to create access for more students — not just high achievers. In that state, middle school students may enroll in one community college course each semester free of charge.
Recent legislation back here in North Carolina requires all middle and high school students in public schools to have career development plans.
And a recent report using North Carolina data explores a new measure of school quality called “high school readiness.”
“As the name suggests, the basic idea is to capture how well a middle school prepares its students for the next stage of their education by quantifying its effects on high school grades — or to be more precise, ninth-grade grade-point averages,” says this article about the report.
4. Local, state, and philanthropic funding for the safety net for students and families
The different types of investments in pathways all share in common academic and/or social support for students.
The expensive and expansive budget bill recently passed by Congress cuts through the federal safety net that many in North Carolina and across the nation rely on, placing more of the responsibility on local and state governments.
An estimated 520,000 North Carolinians could lose their health insurance, according to this press release.
“When we think about Medicaid, we typically think about health insurance,” says an article published in Forbes about the impact of the policy change on schools. “But Medicaid is also among the largest funding sources for K–12 public schools, providing an estimated $7.5 billion annually to pay for essential services for student learning and development.”
Note that the above data is district data prior to Medicaid expansion in North Carolina.
Cuts to the Supplemental Nutrition Assistance Program (SNAP) are “equally serious,” says Gov. Josh Stein. As many as 1.4 million North Carolinians — including 600,000 children — could lose food assistance. EdNC previously reported the impact of cuts to SNAP by county in North Carolina.
According to reporting by the News & Observer, Stein also said, “the state has to be exceptionally conservative fiscally, meaning that we have to preserve the revenue sources we have to so that we can deal with issues like feeding hungry children, or ensuring that our health care system works for everybody.”
Some counties are waiting to see how the state responds before they consider how to address the gap in federal support. Others counties, like Jackson County, are moving ahead with funding free schools meals for all for the school year.
The advocacy of coalitions like School Meals for All NC has never been more important at every level of government.
School choice and the funding of public education
5. Wordsmithing school choice: Choice vs. fit, uniform vs. plural, quality vs. accountability, and the impact of churn
Choice in the context of “school choice” is a political term. It’s not how parents talk or think. All over the world, parents use the word “fit” to describe how they select a school for their child.
And fit is different for different parents. For some, it is about the teacher or the principal. For others, it is about attending school with kids from the neighborhood. For many, it is has to do with the type of educational experience the school provides.
Public schools continue to provide more opportunities for fit than any other educational sector.
In North Carolina, there are 115 school districts and 2,700 schools, including 208 charters, seven lab schools, three residential schools, and one regional school. Public schools offer an abundance of fit through the following types of school options: year-round, magnet, language immersion, single-sex, early college, career academies, virtual academies, community schools, alternative schools, and more.
Check out how Buncombe County Schools is explaining why parents should choose public schools.
EdNC continues to cover the inter-relationship of those two terms, and the choices parents are actually making to find the right fit for their students.
We monitor enrollment across public schools, private schools, and homeschools. So far, even with school choice expansion fully funded, public school market share is holding steady at 84% — that’s 1,538,563 students.
We track the data on private school vouchers, called Opportunity Scholarships in North Carolina. So far, since school choice expansion, it is estimated that more than 90% of the new applicants for vouchers were already attending private school.
The data will be important moving forward in understanding parent choice and student fit, but there are broader trends to be aware of.
In North Carolina, our state constitution mandates a “general and uniform system of free public schools.” In democracies around the world, according to the leading research on educational pluralism conducted by Ashley Rogers Berner at the John Hopkins School of Education, uniform isn’t the north star and states don’t exclusively deliver education. But where other countries build choice into their systems, they also build in quality control.
Quality, not accountability, is the word of choice.
The legislature has charged the recently established Office of Learning Research — led by Jeni Corn and part of the Collaboratory at UNC — to recommend a nationally standardized test for use in third and eighth grade by private and public schools for 2026-27. For more information, see section 3J.23 of this bill.
A necessary first step, that in and of itself does not guarantee quality or accountability. EdNC joined a delegation from California that was in Boston looking at how the public schools there have more comprehensively partnered with religious schools, including in the areas of testing, professional development, and curriculum.
Berner talks about why school choice isn’t enough, and why academic content needs to change and expectations need to increase regardless of setting.
“To be blunt, a libertarian, let-a-thousand-flowers-bloom approach,” she says, is unlikely to move important data points at scale. She has interesting things to say about curriculum — think of the big bet Jackson County made on the Wit & Wisdom curriculum under the leadership of Superintendent Dana Ayers.
Because fit matters to parents, with school choice comes more “churn,” sometimes also called “swirl.”
“There are real, tangible impacts on a students’ learning and wellbeing at every churn — especially mid-year,” says a recent article titled, “School choice is great, but the churn it allows comes at a cost.” Researchers are calling for educational navigators, formal transfer windows, and better, more accessible information about schools for parents making the decisions.
Ray Gronberg with the NC Tribune first reported on how the race between Phil Berger and Sam Page will feature key differences in school choice between Republican candidates.
Berger favors what he calls “universal school choice.”
Page’s website says he believes school “vouchers should be targeted to families who need them most.” That means, writes Gronberg, “income caps on school voucher eligibility to help working families, not the wealthy” and “policies to prevent private schools from inflating tuition due to vouchers.”
6. The relationship between education spending and teacher pay
Page also favors “raising teacher starting pay to $50,000 to keep North Carolina competitive,” which brings us to the relationship between education spending and teacher pay.
As the wait for the Leandro decision on school funding continues, given the changes at the federal level and the impact of Hurricane Helene, there is going to be even more pressure on state appropriations for education unless and until Republicans come to a different meeting of the minds on tax policy.
The N.C. Department of Public Instruction’s “Highlights” is our go-to source for information on education funding and budgets. North Carolina spent about $12.6 billion on public education in 2024-25, and almost 60% of that goes to instructional personnel and related services.
Nationally, studies find that school spending is up, but teacher salaries are not.
In 2024, the libertarian Reason Foundation published this report that found inflation-adjusted, per-pupil spending had risen across the country — in every state except North Carolina. “North Carolina’s inflation-adjusted education revenue grew from $10,806 per student in 2002 to $10,790 per student in 2020, a −0.1% growth rate that ranked 50th in the U.S.,” says the report.
Meanwhile, writes Chad Aldeman, an education analyst, “pay for other college-educated workers has risen steadily, leaving teachers behind.”
One consequence is that teachers are increasingly being priced out of housing in their district, finds Aldeman, citing research by the National Council on Teacher Quality.
BEST NC has advocated for teacher pay as well as advanced teaching roles that are already leading to higher pay for educators. Leah Sutton, who used to work for BEST NC, now leads the advanced teaching roles program for DPI.
The Public School Forum of North Carolina has been convening a working group to study a weighted-student funding formula. While that organization’s leadership is in transition, the work is ongoing, led by Lauren Fox and Elizabeth Paul. A recent grant from the Kellogg Foundation — in addition to other funding — will support the study moving forward with the working group next scheduled to meet in September.
The support of legislators continues to be important.
In 2023, Senators Michael Lee, Amy Galey, and Lisa Barnes sponsored a bill that would convert North Carolina’s funding formula to a weighted student funding (WSF) model. In early 2025, Lee led a discussion about school funding at the Hunt Institute’s Holshouser Retreat.
“This is an incredibly important issue for education in North Carolina,” Lee said to his fellow legislators. “We have to move forward to get something done, and that will require us to work in a bipartisan way with Superintendent Green and the governor.”
Nationally, 41 states use student-based funding in their formula, and in some Republican states, more than $1 billion has been invested in the shift.
This issue is not new: One of WestEd’s supporting reports in the Leandro case addressed cost adequacy, distribution, and alignment of funding. It’s more than five years old now, but you can find it here.
7. The health of district fund balances
The Local Government Commission — a commission within the state treasurer’s office — annually collects fund balance data for North Carolina’s 115 school districts. In an email to EdNC from the LGC back in 2020, fund balances were described as “a savings account that schools can use” if they have unanticipated expenses or opportunities.
In Durham County Public Schools and Winston-Salem/Forsyth Public Schools, fund balances have been in the news as districts cope with accounting errors, highlighting the important of the CFO role.
In western North Carolina, fund balances have been in the news as school districts rely on them to make ends meet given the decline in local revenue from the loss of tourism.
An interesting realization emerging from Hurricane Helene is that community colleges don’t have fund balances — which is a different problem.
Last year, EdNC published a 10-year look at fund balances for school districts.
Here is updated data through June 30, 2024, which is before both the Sept. 30, 2024 end of federal funding for COVID and Hurricane Helene. We are anxiously waiting to see the hit on fund balances that we anticipate in the June 30, 2025 data, which will likely be ready in early 2026.
The state of messaging and advocacy
In these polarized, politicized times, both messaging and advocacy are changing across party lines.
When school choice expansion was announced in spring 2023, then-Gov. Roy Cooper reacted by declaring a state of emergency for public education. By January, he had iterated his language, declaring 2024 the year of public schools. He visited more than 60 child care centers, schools, community colleges, and businesses to highlight public education statewide.
The N.C. School Boards Association launched this “public education matters” website.
Higher Ed Works changed its name to Public Ed Works and launched a billboard campaign for teacher pay.
Parents for Educational Freedom in NC (PEFNC) recently celebrated its 20th anniversary, including a fireside chat with Secretary McMahon. Their website links to this school choice website to help parents navigate, and PEFNC now has a team of 13 parent liaisons, including some who speak Spanish.
Charter schools are having to navigate being both public schools and part of the school choice movement.
A poll by The Carolina Journal in January 2025 found that 55.2% of those surveyed were dissatisfied with the quality of K-12 education students receive in local public schools, and it also found that 56.8% of those surveyed were comfortable sending their students to local public schools.
Now draft pillars of Superintendent Mo Green’s strategic plan will include “Celebrate Why Public Education is the Best Choice” and “Galvanize Champions to Fully Invest In and Support Public Education.”
What’s the right mix of messaging, advocacy, and lobbying across all lines of difference to ensure adequate funding and continuous improvement at all schools for all students?
Sen. Kevin Corbin, R-Macon, tells constituents, “I can promise you what you won’t get. You won’t get things you don’t ask for.”
Cross-partisan strategies addressing the following key elements continue to hold promise at the local, state, and federal level, according to the Aspen Institute:
- Challenges and solutions must be easy to communicate and appeal to a broad base,
- Solutions are responsive to local context and garner local support,
- Parents, teachers, the business community, or politicians in higher office are willing to provide political cover for policymakers,
- Both sides can walk away claiming a win — even if each side’s “win” is different, and
- Using the media as an accelerant.
This year, we are paying close attention to how three important constituencies talk to the public and talk to policymakers: educators, business leaders, and parents.
8. From grass roots to grass tops, educators are finding different ways to lean in
Here are some examples of how educators at the local and state level are finding different ways to lean in to advocate with both the public and policymakers.
On Aug. 20, 2025, North Carolina’s educator-in-chief, Superintendent Green, will launch his strategic plan for public education, including community members, leaders, parents, and educators.
The North Carolina Principal of the Year Network is dedicated to showcasing the exemplary work occurring within North Carolina’s public schools, fostering a culture of excellence, and advocating for the advancement of school leaders and public education across the state. Their strategy is working: They have a new website, host regional trainings, and POY Elena Ashburn is now senior advisor for education policy to Gov. Stein.
In early 2024, the North Carolina Association of Educators (NCAE) released a strategic plan whose first priority is “Grow Our Union.” The organization’s goal is to have 30,000 members by 2030.
A principal in Madison County is circulating a proposal for teacher-storytellers to help us “better understand the state of every school system in WNC and eventually the state.”
9. Will business leaders come together and align on issues that matter?
When I was growing up, it seemed to me like business leaders — think Hugh McColl, Eddie Crutchfield, Rolfe Neill — had a bat line to both the governor and legislative leadership.
At the young age of 90, McColl recently said if he worries about something, it is about education.
The NC Chamber plays a critical role in education and workforce advocacy.
BEST NC is a nonprofit, nonpartisan coalition of business leaders committed to improving the education system through policy and advocacy.
The North Carolina Business Committee for Education (NCBCE) — a nonprofit that operates out of the office of the governor — works to make the critical connection between North Carolina employers and school districts through work-based learning.
The Public School Forum of North Carolina hosted a summit and continues to convene and inform business executives about the future of public education.
Nationally, the Business Roundtable is an association of more than 200 CEOs. Jim Goodnight, their website says, “spearheaded the creation of a national Business Roundtable report calling on business leaders to support and advocate for efforts to improve early learning and third-grade reading proficiency. In North Carolina, he rallied a group of CEOs to the cause.”
What if these leaders and organizations worked together, stood together more?
An example exists in philanthropy. Invest Early NC is an early childhood funders collaborative focused on outcomes for children and families prenatal to age 8 so children are healthy, safe, nurtured, learning, and ready to succeed by the end of third grade. The collaborative has adopted a bipartisan approach with public-private partnerships, lifting community voice to inform decision-making. The collaborative has staff, conducted a statewide landscape analysis, collectively weighs in on issues, and is now beginning to develop a 10-year plan.
This state loves being #1 for business. Longer term, we need to strive to be #1 for students and workers for that trend to hold.
10. This era for parent rights is complicated for students
No doubt we are living in a political era that values parents’ rights.
“Parents are the most natural protectors of their children. Yet many states and school districts have enacted policies that imply students need protection from their parents,” said Secretary McMahon. “These states and school districts have turned the concept of privacy on its head –prioritizing the privileges of government officials over the rights of parents and wellbeing of families. Going forward, the correct application of FERPA will be to empower all parents to protect their children from the radical ideologies that have taken over many schools.”
For students, it’s more complicated than the politics.
Schooling is compulsory in North Carolina, and teachers stand in loco parentis, or in the place of parents, for the 1,025 hours that children are in our public classrooms each year.
But our students spend the other 7,735 hours of their year outside the classroom and the school.
In data from 2015-23, you can see that one in 100 children in North Carolina now experience substantiated abuse or neglect by their parents, guardians, or caretakers.
And, in 2024, North Carolina’s chronic absenteeism rate was 25%, up from 15% in 2018.
The Hechinger Report finds, “Absenteeism cuts across economic lines. Students from both low- and high-income families are often absent as are high-achieving students.”
North Carolina law urges and requires consideration of what is in the best interests of the child, prioritizing child wellbeing, safety, and development.
Ensuring their best interests has historically required a comprehensive approach across all settings where they spend time — home, school, faith, and community — with teachers, parents, ministers, and community leaders all serving as checks on each other.
This article first appeared on EdNC and is republished here under a Creative Commons Attribution-NoDerivatives 4.0 International License.
Get stories like these delivered straight to your inbox. Sign up for The 74 Newsletter
-

Podcast: Year ahead, international, governance
This week on the podcast we examine the challenges facing UK higher education as another tough academic year begins with government finances stretched and the sector languishing at the bottom of political priorities.
With the post-16 education white paper still pending and rumours swirling about tuition fee increases and international student levies, what does the year ahead hold for universities already struggling with funding pressures?
Plus we discuss the latest crackdown on international students as 130,000 are warned about visa overstaying and further restrictions on dependants loom, and ask whether new governance recommendations – from paying board members to live-streaming meetings – can restore confidence in university leadership after high-profile failures.
With Anton Muscatelli, Principal at University of Glasgow, Dani Payne, Head of Education and Social Mobility at the Social Market Foundation, James Coe, Associate Editor at Wonkhe, and presented by Jim Dickinson, Associate Editor at Wonkhe.
What’s coming up for HE policy in 2025–26
For student leaders, it’s been a Cruel Summer
Enhancing higher education governance will require agility and accountability
From where student governors sit, Dundee isn’t the only institution with governance challenges
The exploitation of international students begins before they enrol
What’s happened with dependants since the PGT ban?
International students and asylum claims
Home Office Eyes More Restrictions On International Student Visas
-

Predictions for Governance This Academic Year (opinion)
The start of the new academic year has all eyes looking ahead. As we all know, prediction is very difficult, particularly about the future, as physicist Niels Bohr cheekily put it. At the same time, the future is already here—it is just unevenly distributed, as writer William Gibson said. In other words, while predictions are difficult, we have evidence of what we might expect. This essay applies those logics to higher education governance.
If predictions about the future are difficult, predictions about the future of governance might be outright foolish. Nevertheless, it is worth speculating and preparing.
On the Board’s Radar
Since higher education is in the headlines—if not the headline in the news—boards are likely to be more aware and informed of the issues and trends in higher education than they were in the past. This is particularly true because of federal action (I once would have said “policy,” but we are not seeing policy being made or even discussed) making news in The Wall Street Journal, The New York Times and other outlets read by trustees. Boards read about the Trump executive orders, drastic and devastating reductions in federal research funding, and attacks on institutional autonomy, as well as on specific universities: Harvard, Penn, Columbia, George Mason. The attacks on inclusion and student support for underrepresented groups (even the phrase “underrepresented groups”), DEI or its dismantling, and antisemitism are all subjects of conversations among trustees. Many are having parallel conversations in their corporate and law offices.
The demographic cliff—the long-foretold decline in the numbers of traditional-age students—has only gotten closer. Boards are worried about enrollment. There is concern over international students who are expected to seek alternatives other than the U.S.
For those universities with Division I athletics, there are complexities associated with name, image and likeness rights; the coaching hiring carousel; the transfer portal; and direct student athlete compensation. Boards like to be associated with winning.
Inflation over the past few years has made costs higher and budgets tighter. This means not only that there are fewer operational resources, but fewer dollars have gone into infrastructure. Therefore, deferred maintenance is growing and worrying many.
Then there is AI. As a Princeton University professor wrote in a recent article in The New Yorker, “The White House’s chain-jerk mugging feels, frankly, like a sideshow. The juggernaut actually barreling down the quad is A.I., coming at us with shocking speed.”
Underlining all of this is finances. For boards, particularly those at tuition-dependent institutions as well as those at research funding–dependent institutions, financial well-being is still king. It can and will continue to dominate board conversations. And in extreme cases, it risks becoming the only thing these boards care about.
Governance Crystal Ball
What does the above mean regarding the near-term future for governance? Before answering that question, I need to acknowledge the tremendous variation in boards and their composition as well as in the mission and geographic contexts in which they are operating. Governance generally is not governance locally. At the risk of overgeneralizing:
- Expect more anxiety and energy in the board room. Board members feel the pressure on higher education and their institutions. Some boards will amplify that pressure and others will help dissipate it. Nevertheless, expect boards to be 1) well-read on higher education because it’s in the national headlines and 2) animated about what they are reading and how they are translating that into the institutional context.
- Anticipate activist trustees and activist boards. In some instances, activism will be instigated by individual board members. Activist trustees as well as donors will likely continue to borrow approaches from their corporate brethren, driving agendas, trying to influence board composition, leveraging philanthropy and working behind the scenes. Ten years ago, the Harvard Business Review published an article about corporate activism. While there are clearly lessons to be learned and translated, the most striking part was that one named example of a corporate activist is now a familiar name to many in higher education after playing a key role in forcing the leadership change at Harvard University.
In other instances, the boards themselves (or at least a majority of members) may be activist. We have seen such examples in Florida, Idaho, Texas and Virginia. This is a different conversation altogether, when it is the full board as compared to individuals.
- Increased questioning of the role if not value of faculty governance. Many more boards are likely to openly question the value of faculty governance and how it can be improved. They may have done this privately in the past, but don’t expect quiet conversations about faculty decision-making. Given the enrollment and other external pressures and the “entrenched problems” with higher education (real and perceived, thus the quotation marks), boards may increasingly ask what faculty governance has contributed and in extreme instances why it exists. Most do not have it, or anything substantially similar, in their professional lives.
- A desire to consolidate power in the presidency. When the chips are down, corporate leaders may see their roles as being about making hard decisions, leading change and making unpopular choices to right their organizations. Captains of industry steer the ships under their charge. In higher education boardrooms, they then wonder why the college president—the institutional CEO—seems to have such comparatively little power in relation to their corporate peers. Often without realizing the differences in organizational contexts, they think that their approach to leadership, which typically works for them because they are successful (otherwise they most likely would not be trustees) should apply to colleges and universities. Presidents will be presented with corporate playbooks.
- Increased focus on what is taught. The idea of viewpoint diversity will likely gain increased weight this year in board rooms. Boards may see it as part of their oversight role to ensure a range of ideas is being taught. This means that boards may be focusing on the curriculum and in some instances on the content of individual courses. This also means that boards may want to create new structures and centers, particularly those focused on conservative thought. This too requires much unpacking. Some boards will likely approach this issue with a genuine sense of inquiry and interest, with student learning at heart. Other boards—not so much.
- Increased focus on how the curriculum is taught. Boards may be asking new and more pointed questions about how teaching and learning is conducted. The AI conversation may be driving some of this focus, but not all. Instructional costs, program enrollments, challenges of postgraduation employment and strained resources may also be behind their interest in curriculum.
- More time on campus issues and on campus. I sense that all of these will mean that board members will be increasing their engagement with higher education trends and issues and also spending more time on or in close contact with the campus. I anticipate calls and texts to presidents and possibly others on campus will increase—first in response to the day’s headlines. And second because they will simply have more questions or solutions.
Near-Term Action Agenda for Campus Leaders
While the above are predictions, solid and careful preparation may suit presidents well. It’s best to take that umbrella rather than get caught out in the rain.
- Make more time for governance. We all know the complexities and demands of presidential schedules. Yet, be prepared to increase the time dedicated to the board. Board engagement is something that for the most part only presidents can do. That will mean delegating other tasks and responsibilities to the team. One might consider extending the time of board meetings and creating ways to meet with the board between meetings (briefings and updates are good strategies). There will likely be more governance work to do; don’t let old meeting structures impede good governance.
- Increase communication with board leaders and with the board as a whole. It’s better to shape the narrative of information rather than constantly respond. Increase regular communications; send out special messages. Be sure to spend more time helping the board understand what they need to know and appreciate.
- Prepare the board for crises. We don’t know what will happen this year, but one can safely assume there will be crises of some magnitude across a range of institutions. Have a clear communications plan—know who speaks for the campus and who speaks for the board. Clarify the process for the board of how messages get crafted and vetted. Be clear on who will communicate to the individual trustees. Set expectations for which trustees will know what and when. Remind trustees of the importance of confidentiality. Finally, consider conducting tabletop activities in which the board can work through a crisis before one occurs.
- Lay the foundation for discussions about faculty governance. Be prepared to explain and possibly defend the idea, its structures and the culture of shared decision-making. A simple point to remind the board is that making decisions and actually implementing them are two different things. While shared governance may result in slower decision-making processes, it expedites implementation and ensures a greater likelihood of success because faculty were involved and have a sense of ownership. Bring faculty into board conversations as experts and contributors. Demonstrate their value, which is more powerful than explaining their value.
- Invest in board education. Board members will want to engage. So it’s best to prepare them to do so from the point of knowledge and information. If boards are going to question academic freedom, for example, get ahead of the inquiries.
- Bolster the board chair. Chairs play exceedingly important roles in effective governance. These are volunteer roles in which they manage the board and its personalities; set governance expectations and run interference, when need be; facilitate meetings (again running interference when need be); and support the president and serve as a strategic thought partner.
- Ensure you have a top-notch board professional. Just as chairs play pivotal roles, so do board professionals. Good ones are worth their weight in gold, as they work mostly behind the scenes on governance, but they also engage directly with trustees. And speaking of gold, do your best to ensure they have the resources needed to do their jobs.
- Spend more time on the development of committee and board meeting agendas. Boards do much of their work through meetings. Make sure the president and the senior team are intentional about the content of the agendas, the anticipated outcomes of each meeting and the materials boards need to have informed discussions. This point should go without saying, but too many board agendas are rote, poorly framed and lack focus.
- Finally, intentionally address issues of finances—again particularly for those tuition-dependent and research funding–dependent institutions. Boards will be concerned and want action: By addressing financial well-being intentionally, you can then get the board to focus on other strategic priorities without being distracted. Attending to trustee priorities is important, but ensuring a balanced board agenda will better play the long game needed right now.
Conclusion
This calendar year has been one like no other. A safe bet is to predict that this academic year will be no different. The ideas above may be alarmist. Many boards will continue to govern effectively and do so in ways consistent with past practices. For that be thankful. Other boards may take it upon themselves to look in the mirror and move forward in new, positive and more constructive ways. Be even more thankful for that. As one experienced general counsel said to me, “If trustees truly want to guide their institutions and make sure that their problem-solving and future planning decisions are the best they can be, they need to keep their governance blades sharp.”
-

A Teaching Mantra for the New Year (opinion)
As professors, we naturally talk a lot about teaching—and I’ve certainly benefited from public discussions at workshops and panel presentations. But we can also have more intimate moments of instructional insight, private moments we may initially keep to ourselves until over time we come to appreciate more fully their value.
Here’s my hitherto secret bit of pedagogic wisdom.
It’s my teaching mantra. For many years before teaching each class, I took a moment and silently repeated to myself: Be clear. Be engaging. Be honest. Be kind.
As a beginning teacher, it was a simple tactic to calm my nervousness before class. But as philosophers since Aristotle have recognized, daily choices become persistent habits that evolve into enduring character. It worked. As I strove to embody these values, they enabled me to bring the self I hoped to become into the classroom.
Clarity. Engagement. Honesty. Kindness. Simple teaching virtues, yet I’ve come to believe they have a larger salience in the turbulent academic world of today.
Be Clear
Students today are coming to college with their own share of inner turmoil. Unsettled by the disruptions of COVID, facing an uncertain job market, and inundated with social media skepticism about the value of college, there’s a vulnerability to them that’s new.
With their perceptions of a topsy-turvy world, students are understandably looking for clarity, elusive though it may be. Well-designed syllabi and clear directions help, but the clarity they’re looking for is something more than straightforward course formalities. The clarity they’re looking for is a more deeply rooted certainty that they can count on you.
Thus, providing the clarity students are hoping for today involves the self you bring to the classroom. It is more a matter of character than of course planning. Are you someone they can depend on, confide in and trust? Demonstrating these personal qualities hinges on the kind of outreach you make to students from the start.
Be Engaging
Tentative and uncertain as they often are, I can’t expect students to come to me. Personal outreach today means I have to make the first move. It also means doing so by beginning wherever they are. Only by beginning wherever they are can you hope to take them where you might want them to go.
While I dearly love my students, I don’t expect them to be like me. In my teaching, it has been important to remind myself of this as effective engagement depends on knowing your audience well. Particularly as I’ve gotten older, I’ve had to ensure my cultural references, case choices and even language use have a resonance for students decades younger than I am. I am regularly grateful to my daughter, a recent college graduate, for exposing me to the current lingo of “crashing out,” the delights of matcha and the talents of Billie Eilish.
Be Honest
Honesty is hard as a teacher, particularly when reading students’ less-than-laudatory evaluations. I’ve certainly had my share of such evaluations and they can discourage extending yourself in personal outreach. But I’ve taken heart from an entrepreneur friend who has counseled openness on my part. See such student comments simply as information, he said, just as he does in reflecting upon investor critiques after pitching a business plan.
Honesty is especially hard when enduring criticism of an unfair or even hostile nature, something that in the classroom can be especially painful. But taking criticism as simply information, as a source for developing my own deeper reflection and critical faculties, enables a self-honesty that I’ve come to realize I need not fear. In teaching law, I am regularly reminded of John Stuart Mill’s insight: “He who knows only his own side of the case knows little of that.”
Be Kind
Sometimes, the personal outreach you offer matters more than even the latest teaching strategies you might employ. Kindness toward students can make a decisive difference. Once, while suffering from a bad cold and struggling with a lecture, I noticed that a student coughing in the front row was struggling with her own respiratory ailment. While continuing with the lecture, I offered her a few throat lozenges from the packet that was giving me relief. From the thankful look she gave me, I saw that simple unplanned gesture had a greater impact on her than any of the legal theories I espoused that day.
The turmoil of students’ inner lives mirrors the unsettled state of professors’ professional lives today. Many external forces are currently upending the established norms of academic life. From politicians who act to defund us to AIs that threaten to replace us to a public that increasingly distrusts us, the traditional foundations of academic culture are at risk. With such larger external threats to these traditional foundations, little tips for strengthening our relationships with students may appear to have negligible relevance or sway.
But such little ideas do matter, even if only because of the way they contribute to the cultural resilience colleges will need in the coming days. In a deeper sense, we as individual professors are the academy’s foundations, the strength in which its future resides. And the future begins with the values embedded in the teaching choices we make each day.
-

5 ways to infuse AI into your classroom this school year
Key points:
As artificial intelligence (AI) continues to reshape the educational landscape, teachers have a unique opportunity to model how to use it responsibly, creatively, and strategically.
Rather than viewing AI as a threat or distraction, we can reframe it as a tool for empowerment and efficiency–one that allows us to meet student needs in more personalized, inclusive, and imaginative ways. Whether you’re an AI beginner or already experimenting with generative tools, here are five ways to infuse AI into your classroom this school year:
1. Co-plan lessons with an AI assistant
AI platforms like ChatGPT, Eduaide.ai, and MagicSchool.ai can generate lesson frameworks aligned to standards, differentiate tasks for diverse learners, and offer fresh ideas for student engagement. Teachers can even co-create activities with students by prompting AI together in real time.
Try this: Ask your AI assistant to create a standards-aligned lesson that includes a formative check and a scaffold for ELLs–then adjust to your style and class needs.
2. Personalize feedback without the time drain
AI can streamline your feedback process by suggesting draft comments on student work based on rubrics you provide. This is particularly helpful for writing-intensive courses or project-based learning.
Ethical reminder: Always review and personalize AI-generated feedback to maintain professional judgment and student trust.
3. Support multilingual learners in real time
AI tools like Google Translate, Microsoft Immersive Reader, and Read&Write can help bridge language gaps by offering simplified texts, translated materials, and visual vocabulary support.
Even better: Teach students to use these tools independently to foster agency and access.
4. Teach AI literacy as a 21st-century skill
Students are already using AI–let’s teach them to use it well. Dedicate time to discuss how AI works, how to prompt effectively, and how to critically evaluate its outputs for bias, credibility, and accuracy.
Try this mini-lesson: “3 Prompts, 3 Results.” Have students input the same research question into three AI tools and compare the results for depth, accuracy, and tone.
5. Automate the tedious–refocus on relationships
From generating rubrics and newsletters to drafting permission slips and analyzing formative assessment data, AI can reduce the clerical load. This frees up your most valuable resource: time.
Pro tip: Use AI to pre-write behavior plans, follow-up emails, or even lesson exit ticket summaries.
The future of AI
AI won’t replace teachers–but teachers who learn how to use AI thoughtfully may find themselves with more energy, better tools, and deeper student engagement than ever before. As the school year begins, let’s lead by example and embrace AI not as a shortcut, but as a catalyst for growth.
Latest posts by eSchool Media Contributors (see all) -

6 higher education trends to watch for in the 2025-26 academic year
This audio is auto-generated. Please let us know if you have feedback.This year has already brought big challenges to the higher education sector, from major shifts in federal policy to massive cuts in government research funding.
As college leaders gear up for the 2025-26 academic year, they’re staring down even more change ahead.
The U.S. Department of Education is undertaking massive regulatory changes, the Trump administration is ramping up investigations into colleges, and Republican lawmakers are continuing their crackdown on diversity, equity and inclusion.
Below, we’re rounding up six trends we’re keeping tabs on.
Trump and Republicans usher in a new era of financial retrenchment
Last year, colleges slashed spending on staff, faculty, programs and more in response to difficult enrollment realities and rising costs. The budget pressures have only intensified for many in the higher education world since President Donald Trump took office in January.
The Trump administration has targeted about $3.3 billion in grant funding for termination at public and private universities nationwide — about $206 per student — according to an analysis by the Center for American Progress.
In addition to contractions in research spending, institutions are juggling myriad changes to federal policy by Trump and congressional Republicans that could have significant effects on institutional budget planning. This includes a more fraught environment for international students, cuts to federal student lending and a higher endowment tax, to name just a few.
As they brace for a painful new era of higher ed, institutions of all kinds — from Stanford University to the University of Nebraska — are freezing hiring, offering buyouts, laying off faculty and staff, and pulling back on capital projects.
The new legal minefield
The Trump administration’s legal and financial warfare against Harvard University has grabbed an outsized share of headlines, and arguably for good reason. Harvard is the richest and oldest college in the U.S. If the administration succeeds in a multi-agency, omnidirectional attack on the institution, where does that leave the rest of the nation’s colleges?
Facing this question, some institutions have already made deals with the Trump administration as they attempt to maintain their federal funding and stay out of legal battles. Others are reported or confirmed to be in negotiations with the federal government. And many colleges are facing a difficult balancing act between mission and compliance.
In its attacks on colleges, the Trump administration has introduced novel and aggressive readings of civil rights laws and U.S. Supreme Court cases, as well as threatened vast sums of funding for colleges it considers out of compliance with federal statute.
For instance, the Education Department deemed the University of Pennsylvania in violation of civil rights law for prior policies allowing transgender women to play on sports teams aligning with their gender identity. Penn became one of the first colleges to strike a deal with the administration rather than risk the sort of multi-agency attack — complete with prolonged litigation — being deployed against Harvard.
Meanwhile, federal agencies suspended nearly $600 million in funding from the University of California, Los Angeles over allegations that it violated civil rights law because it didn’t do enough to respond to a pro-Palestinian protest encampment on its campus in spring 2024. Police cleared the encampment at the university’s request after less than a week.
Among other legal risks under Trump, policies meant to support transgender students or diversity programs can now potentially prompt prosecution of a college under the False Claims Act, a federal law dealing with fraud in government contracting. That’s according to a May message from Deputy Attorney General Todd Blanche introducing the Civil Rights Fraud Initiative that specifically listed colleges as potential False Claims Act targets.
New regulations coming down the pike
The Education Department has its work cut out for it over the next year. That’s because the agency must craft regulations to carry out the higher education-related provisions of the sweeping domestic policy bill passed by Republican lawmakers this summer.
The changes under the One Big Beautiful Bill Act — which has been slammed by many higher education advocates — are vast.
They include phasing out Grad PLUS loans, which allow graduate and professional students to borrow up to the cost of their college attendance. The legislation also caps lifetime borrowing limits at $100,000 for most graduate students and $200,000 for those pursuing professional degrees, and it will consolidate a handful of repayment plans into just two options. And it opens up Pell Grants to programs as short as eight weeks.
Colleges will also face new regulations.
Under the legislation, their programs will lose federal student loan eligibility if they can’t prove their students get an earnings boost. For undergraduate programs, that means showing that at least half their graduates earn more than workers with only a high school diploma in their state.
The Education Department is devising the new regulations through a process called negotiated rulemaking. Under this process, the agency convenes representatives who will be impacted by the regulations — such as colleges, student loan borrowers and state officials — to hash out policy details.
If they agree on language, the Education Department is largely bound to adopt their rules as written for its regulatory proposal. If they don’t, however, the agency is free to come up with its own regulations.
The Education Department kicked off the process earlier this month and will hold meetings with negotiated rulemaking committees through January.
A shifting landscape for federal research funding
Legal battles over threatened federal research funding are likely to heat up in the months ahead.
Under the Trump administration, at least four major federal agencies have announced plans to cap reimbursement for indirect research costs — which support expenses like laboratory and facilities maintenance — at 15% for colleges. Many major research universities have negotiated rates hovering around 50% to 60%, meaning these policies threaten vast sums of their federal research funding.
So far, courts have blocked or paused each of the caps. The Trump administration has appealed three of the rulings, and one case is still playing out in federal district court.
Meanwhile, the Supreme Court recently dealt a major blow to research universities by pausing a lower court order that would have restored $783 million in cut funding from the National Institutes of Health under the agency’s anti-DEI policy. While the high court preserved the ruling against the anti-DEI directives, it said the plaintiffs would have to pursue their claims to restore the cut grant funding in the U.S. Court of Federal Claims, which hears monetary claims against the federal government.
Massachusetts Attorney General Andrea Campbell, who has led a coalition of states suing over the NIH cuts, indicated in a statement that the fight was not over.
“Even if accountability is delayed, we won’t stop fighting to protect this funding, our residents, and our rule of law,” Campbell said.
The battle over in-state tuition for undocumented students
At least 25 states and Washington, D.C., started the year with policies allowing eligible undocumented students to pay in-state rates at some or all of their public colleges. But since Trump began his second term, Republicans and his administration have prioritized reducing undocumented students’ access to higher education.
Florida first spurred the shift during a January special legislative session, repealing a law that made certain undocumented students eligible for in-state tuition rates at its public colleges.
Then, following an executive order from Trump, the U.S. Department of Justice sued Texas in June over its decades-old law — the first of its kind in the country — making undocumented students eligible for in-state tuition if they meet certain residency criteria and other requirements.
Despite the attack on the state statute, officials within Texas’ attorney general’s office quickly sided with the DOJ and filed a joint motion with the Trump administration to end the policy. A federal judge overseeing the case struck down the law only hours after the DOJ first filed its lawsuit.
Texas’ cooperation gave the Trump administration an early win and an example to cite as precedent as it moved on to target less amenable states.
U.S. Attorney General Pam Bondi has since filed lawsuits in rapid succession against Minnesota, Oklahoma and Kentucky over their in-state tuition policies for undocumented students. Like Texas, Oklahoma leaders partnered with the DOJ and filed a joint motion to end its policy. The request has not yet been approved by a federal judge.
Bondi argued in multiple, nearly identical statements that in-state tuition rates for undocumented students illegally provide benefits not offered to all U.S. citizens. One higher education attorney has argued that the Texas policy has the same requirements for participation for U.S. citizens and undocumented residents.
The American Civil Liberties Union of Texas and other groups have sought to intervene in the state’s case and asked a federal court to set aside the order declaring Texas’ in-state tuition policy unconstitutional. The same federal judge that struck down the law ruled against them earlier this month, though the groups have already appealed.
Enforcement of new DEI restrictions
For years, conservatives have led coordinated efforts to eliminate diversity, equity and inclusion efforts in higher education. The campaign only grew following Trump’s return to office and his administration’s push to crack down on diversity initiatives.
To comply with new federal directives and state laws, colleges have sprinted to cut programs, cancel events, restructure student services and reassign or lay off DEI-focused employees. In Ohio and Kentucky — two of the most recent states to enact DEI bans at public colleges — some higher education leaders read the writing on the wall and began cutting DEI work prior to the new laws’ passage.
Colleges are now being increasingly singled out for alleged violations of DEI bans. One method is through secretly recorded and heavily edited videos of employees. The videos, shared online and via conservative media outlets, appear to depict college officials talking about how to avoid DEI restrictions.
The dean of students at the University of North Carolina Asheville is “no longer employed” there after one such recording went viral, according to a university official. And in the same state, Western Carolina University announced it would close its Office of Intercultural Affairs, following a widely-shared video of a former employee who suggested DEI work be embedded across campus.
Two of Iowa’s three public universities — the University of Iowa and Iowa State University — are under state scrutiny after similar videos surfaced of their staff. The state attorney general is investigating the incidents at the University of Iowa at the behest of Iowa’s governor.
Two University of Iowa employees have been put on leave, with the Republican chair of the Legislature’s House higher education committee calling for them to be fired. Iowa State University told local media outlets that a video showing one of its administrators discussing DEI work appeared to be filmed a year prior to its release and featured a former employee who had not worked there since 2024.
GOP lawmakers from conservative-led states have also been calling on the Trump administration to investigate colleges over their DEI efforts.
In Texas, a Republican state representative requested the Trump administration to investigate Texas A&M University over allegations the institution “engaged in DEI courses and discriminatory ‘targeted recruiting’ practices.”
Two states over, a congressional representative from Tennessee similarly called for a federal investigation into Belmont University, alleging the private Christian college’s restructuring of its DEI office was “an intentional effort to deceive federal authorities and continue promoting discriminatory programming under a new name.”
Some colleges — particularly public ones in conservative states — are cracking down on behavior that could draw lawmaker attention.
Tarrant County College, in Texas, fired two administrators over the inclusion of DEI content in a mandatory training video, according to The Collegian, the institution’s student newspaper.
The community college also disciplined two employees over DEI-related offensives — one for conducting a workshop on “Microaggressions & Mental Health” and the other for gifting women co-workers a bouquet of flowers with a “Happy International Women’s Day” card.
-
These 4 trends are shaping the 2025-26 school year
This audio is auto-generated. Please let us know if you have feedback.A new school year is upon us — and as with any year, the return to the classroom brings with it an array of challenges both novel and familiar.
Shifting enrollments alone present existential challenges for many school systems as declining birth rates result in lower student populations, which public schools are now in greater competition to attract and retain. Compounding those challenges are newer hurdles like artificial intelligence and a changing federal policy landscape that are impacting approaches to teaching and learning.
To help you unpack the obstacles and opportunities on the table this fall, here are four trends to watch in the 2025-26 school year.
Enrollment crucial as budgets tighten
As the new school year begins, fall enrollment numbers will be crucial for district budgets, said Marguerite Roza, a research professor and director of Georgetown University’s Edunomics Lab.
Due to federal COVID-19 emergency relief funds, many districts appeared to ignore the realities of their declining enrollment, she said. However, when relief funding dissipates and budgets tighten, districts need to keep a very close eye on their fall enrollment: Even if it’s just 1% lower or higher than forecasted, that will be “super important” for schools’ bottom lines, Roza said.
For some districts, an influx of migrant students has offset declines in non-migrant student populations, Roza said. But that kind of enrollment growth is worth keeping an eye on, she said — especially amid the Trump administration’s heightened immigration enforcement policies. Though schools cannot record a student’s immigration status, a drop in English learners could be a signal of that change, she said.
Additionally, districts should look for declines in kindergarten or at secondary grade levels, Roza said. If a district has fewer kindergarteners but strong high school enrollment, for instance, then it has a birthrate problem, she said. But if it’s a more widespread issue, it may be that people are moving out of the area.
Growing school choice policies may also have an impact on enrollment down the line, Roza said.
Some districts with significant and ongoing enrollment drops will also have to make tough decisions this school year about the future of their schools. For instance, district leaders in Atlanta, Austin and St. Louis public schools are all currently considering whether they should close or consolidate school buildings due to budget challenges and enrollment declines.
Federal policy whiplash persists
Schools continue to face the whiplash of the Trump administration’s drastic shift in and rapid enforcement of federal policies, which have included the withholding of federal funding in some cases. That’s especially true for districts’ policies related to LGBTQ+ issues as well as diversity, equity and inclusion.
Whereas the Biden administration encouraged the inclusion and protection of transgender students, for instance, the Trump administration quickly and forcefully reversed course. Federal officials have so far made an example out of multiple education agencies — including in Maine, California, Minnesota and major districts in Northern Virginia — for what it says are violations of Title IX. Those violations have included allowing transgender students to play on women’s and girls’ sports teams.
Schools have also been under the microscope for practices meant to level the playing field for Black and brown students, which the administration says are discriminatory against White and Asian students in some cases. In April, for example, the department launched an investigation into Chicago Public Schools for its “Black Students Success Plan.”
Many civil rights organizations, teacher organizations and sometimes even school districts, however, have challenged the Trump administration’s policies, which they say have been made in some cases without going through the proper legal channels and violate students’ rights. As those cases work their way through the courts, policies continue to shift. In one case, key efforts by the administration to roll back DEI measures — including a requirement from the administration that asked districts to certify they are not incorporating DEI in their schools — were blocked by a judge in August, at the launch of the 2025-26 school year.
Technology, relationships drive special ed improvements
Despite persistent special educator shortages, funding gaps and uncertainty about federal-level support to states and districts, the special education field is optimistic about the progress students with disabilities will make this school year as more attention is focused on boosting family engagement and expanding the use of technology to support students with disabilities, according to experts in the field.
Advances in technology, including artificial intelligence tools, are easing paperwork burdens for special educators. Improvements in augmentative and alternative communication and other technology are strengthening personalized learning for students with disabilities. Additionally, evidence-based practices, such as universal design for learning and positive behavioral interventions and supports, are helping schools meet individual student needs.
Relevant professional development on tech tools, however, is only one part of helping a student succeed, said Kelly Rudyk, director of pupil personnel services for New York’s North Salem Central School District, in a recent post on AASA, The School Superintendents Association’s website. Relationships between administrators and special educators, and between schools and families, are also essential, Rudyk said.
“To truly move the work forward, we need to set clear district goals in partnership with special education leaders,” Rudyk said. “These goals should: reflect instructional priorities, support the meaningful use of technology and improve outcomes for students with disabilities.”
AI spreads its footprint in schools
School leaders will enter the 2025-26 school year with encouragement from the U.S. Department of Education to use existing federal grants to integrate artificial intelligence in classrooms. Over the summer, U.S. Education Secretary Linda McMahon sent a “Dear Colleague” letter to state and district leaders informing them that they can use federal funds to bolster AI’s use in improving high-quality curriculum tools, high-impact tutoring, and college and career pathway advising.
Still, there’s little research available on the impacts AI technology has on student outcomes, particularly with increasingly popular AI tutoring tools.
AASA also expressed some concerns over the Education Department’s latest full-speed push for AI tools in schools.
In response to a proposed rule on priorities for using discretionary grant programs to support AI use in schools, which was published in the Federal Register in July, AASA submitted a comment on Aug. 20 asking for a greater focus on the educator workforce within AI initiatives. AI cannot be a “substitute,” the association said, for “the human relationships and professional expertise at the heart of student learning.”
On top of that, AASA warned against “framing AI as a silver bullet,” and that any “thoughtful national strategy must include clear guardrails, sustainable funding that does not come at the expense of other high-priority federal programs, and ongoing evaluation of what works in practice.” As school leaders approach the fourth academic year since ChatGPT launched, researchers also recommend that districts develop their own acceptable AI use policies if they haven’t already.
Meanwhile, 30 states have issued their own AI guidance for schools as of June, according to TeachAI, a national coalition focused on AI in education.
-
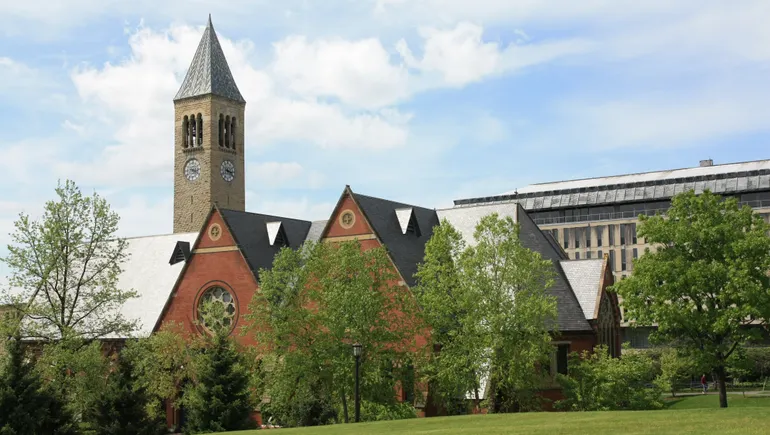
Cornell University plans to restructure later this year amid federal funding declines
This audio is auto-generated. Please let us know if you have feedback.Dive Brief:
- Cornell University leaders expect to begin restructuring the institution’s operations and workforce in phases beginning late this year and continuing into 2026.
- In a community update Friday, senior leaders echoed a June message warning of job cuts. “Reducing costs will mean reconsidering how we handle all of our processes, from procurement to technology, and rethinking, in fundamental ways, how we allocate our resources,” they said Friday. “It will also, inevitably, mean reducing our workforce.”
- The officials cited inflation, historical staff growth, contractions in federal funding, “significant legal and regulatory expenses,” and “an uncertain and unprecedented federal landscape.”
Dive Insight:
In June, the same group of Cornell leaders — President Michael Kotlikoff, Provost Kavita Bala, Chief Financial Officer Chris Cowen and Provost for Medical Affairs Robert Harrington — told the university community that disruption in the higher education world would “require financial austerity.”
“The spring semester was unlike anything ever seen in higher education, with hundreds of millions of dollars in federal research contracts at Cornell terminated or frozen, and serious threats to future research funding, federal financial aid, medical reimbursement, and research cost recovery, along with an anticipated tax on our endowment income, and rapidly escalating legal expenses,” they wrote at the time.
The June message also brought news of a hiring freeze. On Friday, the leaders said hiring restrictions would continue “indefinitely” with “rare exceptions” determined by campus committees.
Cornell was among the 60 institutions that the Trump administration warned in March could face potential sanctions over allegations related to antisemitism.
In April, the administration reportedly froze $1 billion in federal research funding for the university. Administrators said then that they hadn’t received official word from the government about the frozen funds but were hit with dozens of stop-work orders on grant projects. This summer, Bloomberg reported that Cornell was nearing a deal with the Trump administration to restore grant funding that could involve a $100 million payment.
Even before the Trump administration’s actions, Cornell faced budget pressure from rising expenses. For fiscal 2024, the Ivy League institution posted a $175.5 million operating deficit, compared to $23 million surplus the year before.
Cornell’s senior leaders said that to save costs, the university is looking to consolidate operations where it can, seeking “new efficiencies and reducing duplication of work.” And while part of the university’s tradition, its decentralized structure is also a source of significant administrative inefficiencies, they added.
“Part of our task is identifying opportunities to scale and regularize our academic support systems across units with unique characteristics and needs without compromising our institutional excellence,” they said.
That means centralizing operations that are duplicated across colleges and units, which will ultimately lead to a smaller workforce, leaders said. They didn’t note whether those losses would be primarily through layoffs, buyouts, attrition or other means.
Cornell didn’t immediately respond to a request for comment Monday.
The leaders said they expect to complete an analysis and planning process around the university’s operations this fall.
“These changes will be difficult for our community but are vital for our future,” they added, describing the steps they are taking as “necessary to ensure that Cornell pursues its academic mission sustainably for generations to come.”

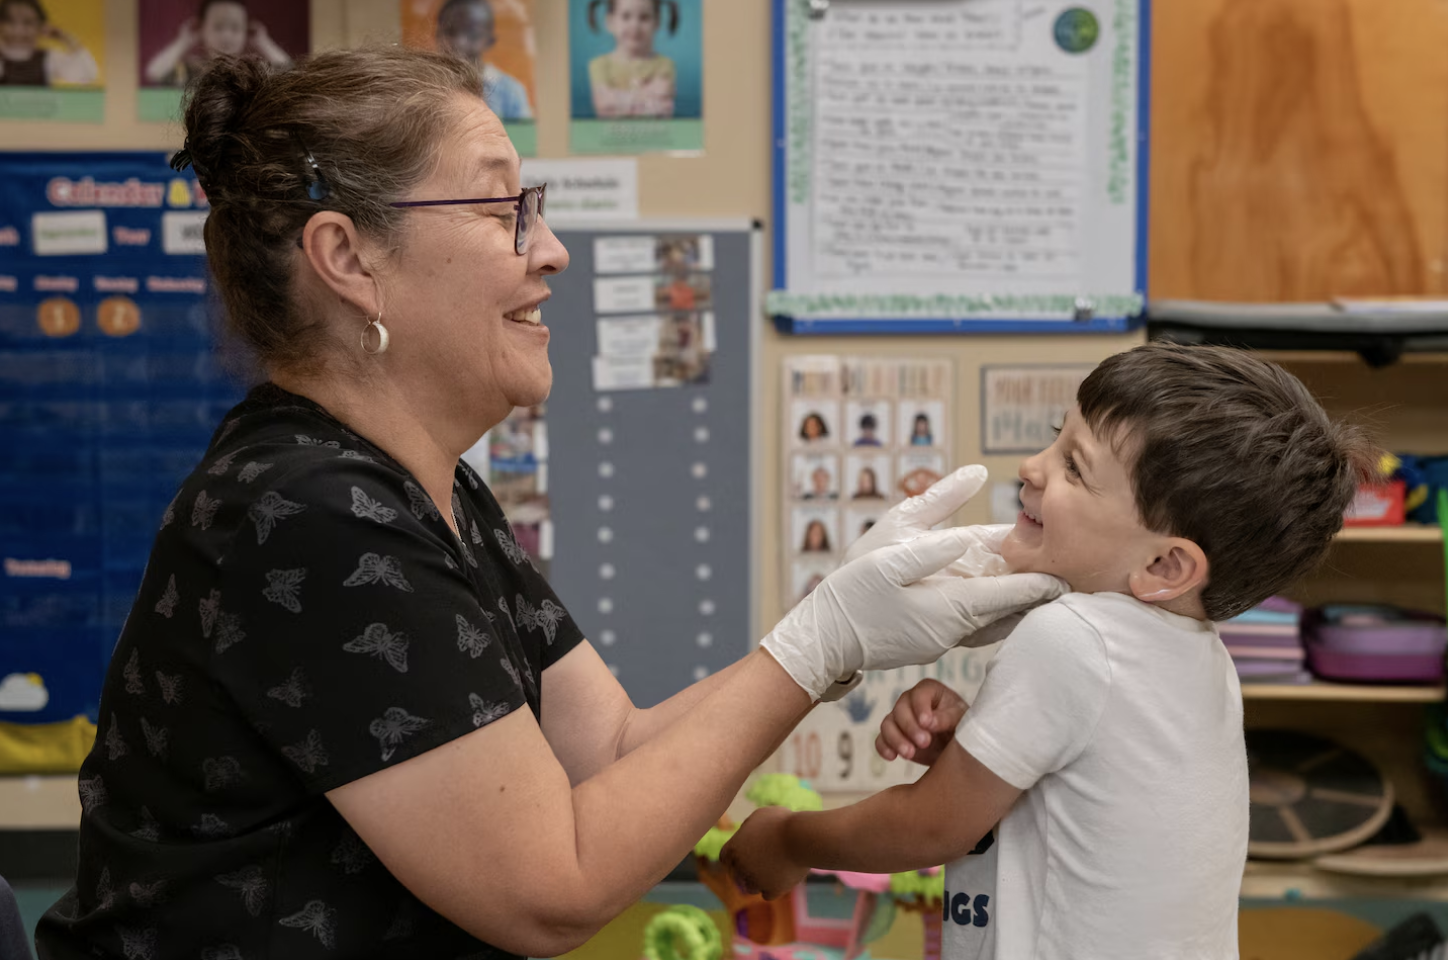