Category: Compensation

  • The Non-Exempt Staff Workforce in Colleges and Universities Is Shrinking

    The Non-Exempt Staff Workforce in Colleges and Universities Is Shrinking

    by CUPA-HR | April 8, 2025

    New research from CUPA-HR shows that the number of non-exempt* staff employees in higher education has been on a steady decline for the past several years. In the newest workforce trends report, The Non-Exempt Higher Education Staff Workforce: Trends in Composition, Size, and Equity, CUPA-HR examines the makeup of and trends in the higher ed non-exempt staff workforce from 2016-17 to 2023-24.

    One of the more notable findings: Since 2017, there has been a 9 percent decrease overall in the full-time non-exempt staff higher ed workforce. Part-time staff employee numbers have also fallen — down 8 percent in that same time period. The most significant downward trend began in 2020 (the onset of the COVID-19 pandemic), with decreases for both full-time (-3.3 percent) and part-time (-17.2 percent) staff.

    Some of the other key findings highlighted in the report:

    • Fewer non-exempt staff are age 55+. Non-exempt staff are slightly younger than they were pre-pandemic, and the proportion that is age 55+ has steadily declined from a high of 34% in 2019-20 to 31% in 2023-24.
    • Women make up 59% of the non-exempt staff workforce. They are best represented among office and clerical staff. Women in non-exempt positions are paid $.96 for every dollar White men are paid. Pay equity is lowest for Black ($0.92) and Hispanic ($0.94) women.
    • People of color make up 33% of the non-exempt workforce. This representation is much higher than in any other segment of the workforce, including administrators, faculty and professionals.
    • Women and Black staff experience multiple layers of inequity among non-exempt staff. They are better represented in the lowest-paying positions (e.g., dishwasher, custodian) than among the highest-paying positions (e.g., metalworker, electrician lead). They also have lower representation in lead positions than in non-lead positions.

    Read the report and explore this data with interactive graphics.


    *A non-exempt employee is one that is covered by (not exempt from) the Fair Labor Standards Act. As such, they are required to be paid overtime for every hour worked over 40 hours per week. Non-exempt staff must track their hours and be paid at least the federal minimum hourly wage. Examples of non-exempt staff in higher education include electricians, police officers, photographers, custodians, office assistants and food service workers.


    Source link

  • Most Higher Ed Employees Received Raises This Year, but Salaries Still Fall Short of Pre-Pandemic Pay

    Most Higher Ed Employees Received Raises This Year, but Salaries Still Fall Short of Pre-Pandemic Pay

    by CUPA-HR | April 8, 2025

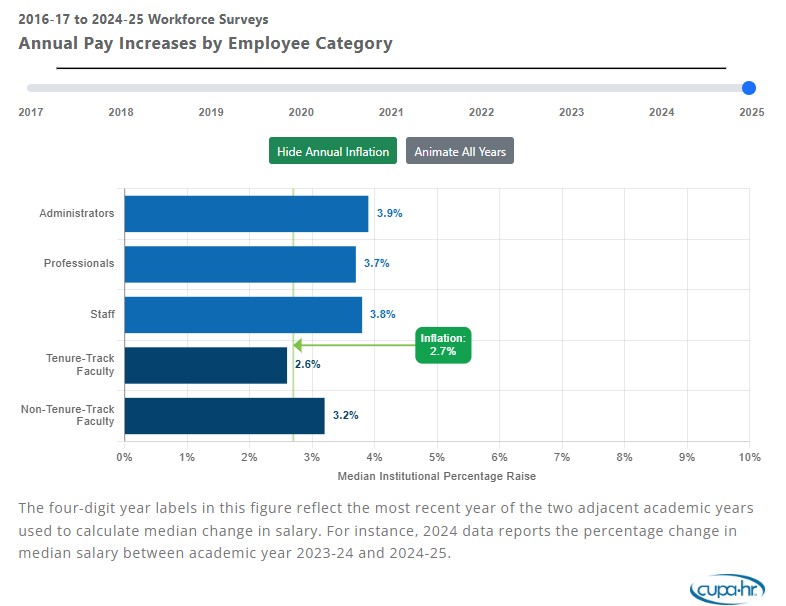
    New research from CUPA-HR shows that median pay increases for most higher education employees in 2024-25 remained strong, although they have dropped from the historically high increases seen in the previous two years. And although raises this past year for most employees outpaced inflation, they are still being paid less than they were in 2019-20 in inflation-adjusted dollars.

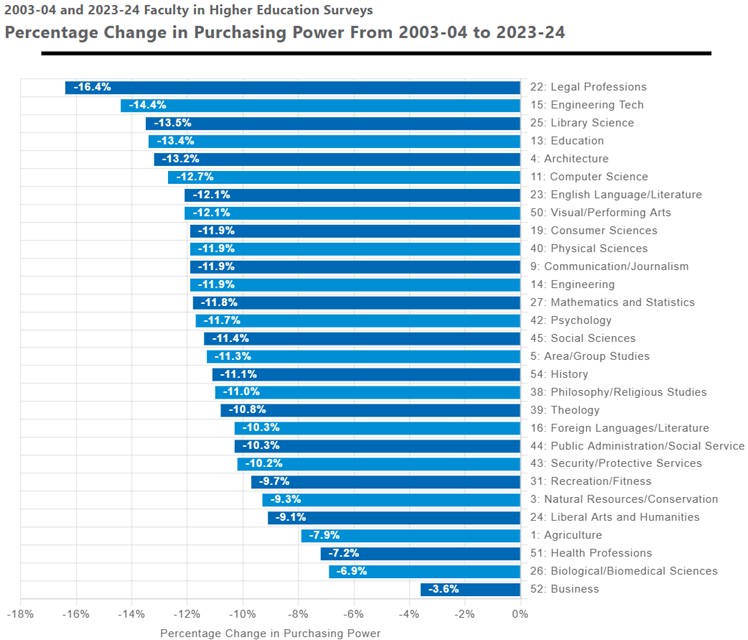
    The largest gap between pre-pandemic inflation-adjusted salaries and current salaries is for tenure-track faculty (who are paid 10.2% less), followed by non-tenure-track teaching faculty (paid 7.6% less). The smallest gap is for staff (paid 2.8% less).

    Some of the other key findings from an analysis of CUPA-HR’s higher ed workforce salary survey data from 2016-17 to 2024-25:

    • Staff employees continued to receive some of the highest pay increases compared to other workforce areas.
    • Non-tenure-track teaching faculty received a 3.2% salary increase, which is lower than last year’s high but still among the largest increases seen in recent years.
    • For the third consecutive year, tenure-track faculty received the lowest salary increase of all employee categories (2.6%). Across the nine years of data analyzed, tenure-track faculty salaries have not once exceeded the rate of inflation. This essentially means that — in real dollars — they have received salary decreases for the past decade.

    Explore this data and more in CUPA-HR’s newest interactive graphic.


    Source link

  • Equal Pay Day Data: On Average, Women in Higher Ed Are Paid 82 Cents on the Dollar

    Equal Pay Day Data: On Average, Women in Higher Ed Are Paid 82 Cents on the Dollar

    by Christy Williams | March 5, 2025

    Since 1996, the National Committee on Pay Equity has acknowledged Equal Pay Day to bring awareness to the gap between men’s and women’s wages. This year, Equal Pay Day is March 25 — symbolizing how far into the year women must work to be paid what men were paid in the previous year.

    To help higher ed leaders understand, communicate and address gender pay equity in higher education, CUPA-HR has analyzed its annual workforce data to establish Higher Education Equal Pay Days for 2025. Tailored to the higher ed workforce, these dates observe the gender pay gap by marking how long into 2025 women in higher ed must work to make what White men in higher ed earned the previous year.

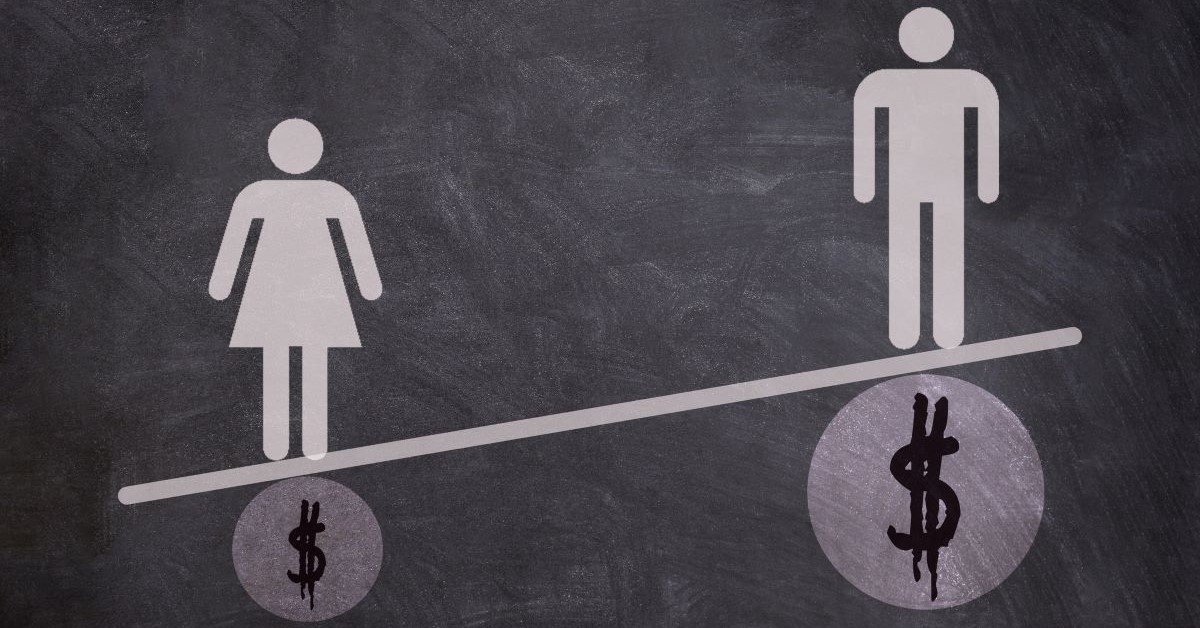
    Higher Education Equal Pay Day falls on March 8, 2025, for women overall, which means that women employees in higher education worked for more than two months into this year to gain parity with their White male colleagues. Women in the higher ed workforce are paid on average just 82 cents for every dollar a White man employed in higher ed makes.

    Highlighting some positive momentum during this Women’s History Month, some groups of women are closer to gaining pay equity. Asian American women in higher ed worked only a few days into this year to achieve parity on January 4 — an encouraging jump from January 14 in 2024.

    But the gender pay gap remains for most women, and particularly for women of color. Here’s the breakdown of the gender pay gap in the higher ed workforce, and the Higher Education Equal Pay Day for each group.* These dates remind us of the work we have ahead.

    • March 8 — Women in Higher Education Equal Pay Day. On average, women employees in higher education are paid 82 cents on the dollar.
    • January 4 — Asian Women in Higher Education Equal Pay Day. Asian women in higher ed are paid 99 cents on the dollar.
    • March 5 — White Women in Higher Education Equal Pay Day. White women in higher ed are paid 83 cents on the dollar.
    • March 29 — Native Hawaiian/Pacific Islander Women in Higher Education Equal Pay Day. Native of Hawaii or Pacific Islander women in higher ed are paid 76 cents on the dollar.
    • April 4 — Black Women in Higher Education Equal Pay Day. Black women in higher ed are paid 75 cents on the dollar.
    • April 11 — Hispanic/Latina Women in Higher Education Equal Pay Day. Hispanic/Latina women in higher ed are paid 73 cents on the dollar.
    • April 24 — Native American/Alaska Native Women in Higher Education Equal Pay Day. Native American/Alaska Native women are paid just 69 cents on the dollar.

    CUPA-HR research shows that pay disparities exist across employment sectors in higher ed — administrators, faculty, professionals and staff — even as the representation of women and people of color has steadily increased. But with voluntary turnover still not back to pre-pandemic levels, not addressing pay disparities could be costly.

    CUPA-HR Resources for Higher Education Equal Pay Days

    As we observe Women’s History Month and Higher Education Equal Pay Days for women, we’re reminded that the quest for equal pay is far from over. But data-driven analysis with the assistance of CUPA-HR research can support your work to create a more equitable future.

    CUPA-HR’s interactive graphics track the gender and racial composition of the higher ed workforce, based on data from CUPA-HR’s signature surveys. The following pay equity analyses control for position, indicating that any wage gaps present are not explained by the fact that women or people of color may have greater representation in lower-paying positions:


    *Data Source: 2024-25 CUPA-HR Administrators, Faculty, Professionals, and Staff in Higher Education Surveys. Drawn from 707,859 men and women for whom race/ethnicity was known.


    Source link

  • Data Show Women and People of Color Have Lower Representation Among the Highest-Paying Higher Ed Professional Jobs – CUPA-HR

    Data Show Women and People of Color Have Lower Representation Among the Highest-Paying Higher Ed Professional Jobs – CUPA-HR

    by CUPA-HR | July 17, 2024

    New research from CUPA-HR on the state of the professional workforce in higher education shows that women and people of color are not only being paid less than White men in the same position, but also are less likely to hold higher-paying positions.

    CUPA-HR’s research team analyzed data from the Professionals in Higher Education Survey, a comprehensive data source that collects salary and demographic data on more than 293,000 professionals in 409 positions from approximately 985 higher ed institutions, to evaluate representation and pay equity for women and professionals of color from 2016-17 to 2023-24.

    The Findings

    Women and people of color have lower representation among the highest-paying professional jobs. Women and people of color have lower representation among six-figure (i.e., paid more than $100,000) jobs in comparison to all other professional jobs. White men held 40% of six-figure jobs but held 28% of jobs paying less than $100,000.

    Pay equity has improved slightly for women over the past eight years, but women of most races/ethnicities are still paid less than White men. Except for Asian women, women of all other examined races/ethnicities were paid less than White men in 2023-24.

    Over the past eight years, the representation of people of color increased among higher ed professionals; the increase in the representation of women of color was more than double the increase in the representation of men of color. The representation of people of color increased from 22% of professionals in 2016-17 to 26% of professionals in 2023-24. During this time, women of color had more than two times the increase in their representation than did men of color (26% increase for women versus 10% increase for men).

    Older women experience greater pay gaps than younger women. Women over age 42 had larger pay gaps relative to White men than did women age 42 or younger.

    Explore the interactive graphics and read the full report, The Higher Ed Professional Workforce: Composition and Pay Equity by Gender and Race/Ethnicity From 2016-17 to 2023-24.


    Source link

  • More Than Half of Financial Aid Employees Likely to Seek Other Employment Within the Next Year – CUPA-HR

    More Than Half of Financial Aid Employees Likely to Seek Other Employment Within the Next Year – CUPA-HR

    by CUPA-HR | May 13, 2024

    A majority of those who work in financial aid at the nation’s colleges and universities are job hunting, according to new research from CUPA-HR and the National Association of Student Financial Aid Administrators (NASFAA). What are they looking for? Better pay, opportunities to work remotely and a more flexible schedule.

    A new report examining pay, pay equity, staffing, representation and retention in the higher ed financial aid workforce outlines several findings from analyses of data of financial aid employees from CUPA-HR’s 2022-23 higher ed workforce surveys and the 2023 Higher Education Employee Retention Survey. Positions included in the analyses are chief student financial aid officers, deputy heads of financial aid and student financial aid counselors.

    The analyses found that more than half (56%) of financial aid employees are at least somewhat likely to seek other employment opportunities within the next 12 months, with 1 in 3 (33%) being likely or very likely to do so. Four in 5 (79%) rank a pay increase as one of the top three reasons they would seek other employment opportunities, while 3 in 5 (59%) rank an opportunity to work remotely as one of the top three reasons they would seek other employment opportunities. The desire for a flexible schedule is also ranked as a top reason for seeking other employment by nearly 2 in 5 (37%) financial aid employees.

    Other Findings

    • Institutions with the highest number of FAFSA applications have far more student financial aid counselors than institutions with the lowest number of FAFSA applications. At each increase in FAFSA application quartile, the median number of student financial aid counselors per institution doubles (or nearly doubles). Institutions with the greatest number of FAFSA applications on median have six more student financial aid counselors than institutions with the least number of FAFSA applications.
    • On median, institutions have four financial aid employees working in one of the three examined positions. Thirteen percent of institutions have a one-person financial aid office. Even the institutions that process the lowest number of FAFSA applications tend to have need for more than one person working in their office – over half of these institutions have at least three people in their financial aid office.
    • The representation of people of color declines as the level of financial aid position increases. The representation of people of color is almost two times higher among student financial aid counselors than among chief student financial aid officers. The representation of women overall among chief student financial aid officers is lower than the representation of women within the lower-level financial aid positions, but the difference is much smaller than the declines seen for people of color.
    • Pay equity is lower among chief student financial aid officers than among lower-level financial aid positions. Black women and Hispanic or Latino men are paid equitably within student financial aid counselor and deputy head of student financial aid positions, but not within the chief student financial aid officer position. At each increase in position level, White women’s pay relative to White men in the same position decreases. White women are paid equitably to White men in student financial aid counselor positions but are paid only 94 cents per $1 paid to White men in chief student financial aid officer positions.
    • Among financial aid employees, years in position is lowest among student financial aid counselors. Of all financial aid positions, student financial aid counselors have the highest concentration of people who have been in their position for fewer than two years (43%). Retention is better among deputy heads of student financial aid and chief student financial aid officers; one-third have been in their position for 10 years or longer.

    Read the full report, The Higher Education Financial Aid Workforce: Pay, Representation, Pay Equity, and Retention, and explore the interactive graphics.


    Source link

  • Voluntary Turnover in the Higher Ed Workforce Is Trending Downward – CUPA-HR

    Voluntary Turnover in the Higher Ed Workforce Is Trending Downward – CUPA-HR

    by CUPA-HR | May 8, 2024

    The workforce retention challenges higher education has been experiencing post-pandemic might just be letting up. A recent trend analysis of turnover data collected in CUPA-HR’s annual higher education workforce surveys found that in 2023-24, voluntary turnover rates for faculty and staff trended downward for the first time in three years.

    CUPA-HR began collecting turnover data in 2017-18. In the three years prior to the pandemic, there was little variability year to year in voluntary turnover (voluntary separations not due to retirement), and in the year immediately following the pandemic’s onset (2020-21), there were slight dips in voluntary turnover for each category of staff and faculty, likely due to the economic uncertainty that characterized that year. However, voluntary turnover trended upward in 2021-22 and again in 2022-23, with the highest voluntary turnover occurring in 2022-23.

    The largest decline in voluntary turnover rates was for part-time non-exempt staff (down 6.4 percentage points, from 21.4% in 2022-23 to 15.0% in 2023-24). However, there were notable declines in voluntary turnover for full-time exempt staff and full-time non-exempt staff as well.

    Findings on Overall Current Turnover

    • In considering turnover from all types of separations (i.e., voluntary and involuntary), overall turnover of faculty and staff combined in 2023-24 was 14%. Turnover in 2023-24 was higher than pre-pandemic rates (approximately 12%), but lower than the 16% high of 2022-23.
    • In 2023-24, overall turnover was highest for part-time non-exempt staff (22%) and lowest for faculty (7% for tenure-track and 11% for non-tenure-track faculty).
    • Involuntary turnover rates were highest for full-time non-exempt staff (2.1%) and full-time exempt staff (1.4%). Retirement rates were highest for tenure-track faculty (2.2%) and full-time non-exempt staff (2.0%).

    Explore the Higher Ed Workforce Turnover interactive graphics.


    Source link

  • Data Show Women and People of Color Aren’t Advancing to Higher Faculty Ranks at the Same Rate as White Men – CUPA-HR

    Data Show Women and People of Color Aren’t Advancing to Higher Faculty Ranks at the Same Rate as White Men – CUPA-HR

    by CUPA-HR | May 2, 2024

    New research from CUPA-HR on the state of the faculty workforce in higher education shows that despite some growth in representation among tenure-track women and faculty of color in new hires, advancement to higher faculty ranks remains a barrier. What’s more, these promotion gaps are found in every faculty discipline.

    CUPA-HR’s research team analyzed data from the Faculty in Higher Education Survey, a comprehensive data source that collects salary and demographic data by tenure status, rank, and faculty discipline, to evaluate representation and pay equity for women and faculty of color from 2016-17 to 2022-23.

    In addition to the finding that women and faculty of color are not being promoted to senior faculty ranks at the same rate as White men, the data also show that women, Black, and Hispanic or Latina/o faculty are better represented in non-tenure-track than in tenure-track positions, and that pay gaps in non-tenure-track positions persist for these groups. Combined with the fact that these groups are less likely to be promoted to higher ranks in tenure-track positions, the result is that a substantial segment of faculty, primarily women and people of color, are employed in positions that pay lower salaries throughout their careers.

    Other Findings

    Tenure-track faculty positions are on the decline. There has been a decline in tenure-track positions and a corresponding increase in non-tenure-track positions over the past seven years. In 2016-17, tenure-track roles accounted for 73% of faculty, but by 2022-23, this proportion fell to 66%, with a marked increase in non-tenure-track positions over the last two years. Additionally, the percentage of new tenure-track assistant professor hires dropped in recent years, indicating a trend toward more new non-tenure-track hires.

    The representation of women and people of color in tenure-track faculty positions is increasing, yet challenges remain. There was a notable increase in the representation of tenure-track (TT) women and faculty of color from 2016-17 to 2022-23. In 2022-23, more than one-fourth (26%) of TT faculty were people of color. This marks a 28% increase over the span of seven years, compared to 2016-17, when faculty of color constituted closer to one-fifth (21%) of all TT faculty. However, the growth in racial/ethnic representation still lags when compared to the demographic composition of U.S. doctoral degree holders. Further, despite strides toward pay equity for tenure-track faculty of color, White women in tenure-track positions still face persistent pay gaps in 2022-23.

    Explore the interactive graphics and read the full report, Representation and Pay Equity in Higher Education Faculty: A Review and Call to Action.


    Source link

  • Senators Introduce Bill to Implement 32-Hour Workweek – CUPA-HR

    Senators Introduce Bill to Implement 32-Hour Workweek – CUPA-HR

    by CUPA-HR | April 3, 2024

    On March 14, Senator Bernie Sanders (I-VT) and Senator Laphonza Butler (D-CA) introduced the Thirty-Two-Hour Workweek Act, which would amend the Fair Labor Standards Act to reduce the standard workweek from 40 hours to 32 hours, while also providing that workers do not lose pay as a result of the reduced hours. A nearly identical bill was introduced in the House earlier this Congress.

    According to the Senate version of the bill, the FLSA would be amended to reduce the standard workweek from 40 hours to 32 hours by requiring overtime payment for any work done in excess of 32 hours in a given week. The bill includes a new requirement to provide overtime pay at the standard rate of one-and-a-half times the regular rate for any workday that is longer than eight hours but shorter than 12 hours, and it requires employers to pay an overtime rate of double the regular rate for any workday longer than 12 hours. The bill also stipulates that employers subject to the shortened workweek requirements may not reduce the total workweek compensation or any other benefit of an employee due to the employee being brought into the purview of the legislation. The 32-hour workweek would be phased in over a four-year period.

    The same day the bill text was introduced, the Senate Health, Education, Labor, and Pensions (HELP) Committee held a hearing on the need for a 32-hour workweek. Senator Sanders serves as the chairperson of the committee and led the Democrats’ arguments for shortening the workweek without reducing pay. He argued that new technology has increased the productivity of American workers, therefore decreasing the need for a 40-hour workweek as was enacted in the FLSA over 80 years ago. Republicans, on the other hand, argued that shortening the workweek without decreasing pay would hurt small businesses and would result in increased prices for goods and services and more automated jobs. They argued against a law mandating the 32-hour workweek and preferred flexibility for employers to choose to make that change if appropriate for their business operations.

    Given the partisan divide shown during the hearing, the bill is unlikely to move in the Senate anytime soon. Even if the bill passed out of the HELP Committee, it appears unlikely that it will garner the 60 votes necessary to bypass the filibuster if brought to the floor for a vote. The House version of the bill faces a similar fate, as the House Republicans currently have the majority. With the upcoming election in November, it will be interesting to see if power shifts in favor of Democrats in either chamber, which will likely be the only way the bill could pass in the House or Senate.

    CUPA-HR will keep members apprised of any updates as it relates to this legislation and future policy related to a shortened workweek.


    Source link

  • Higher Education Pay Increases in 2023 Exceeded Inflation for the First Time Since the Pandemic – CUPA-HR

    Higher Education Pay Increases in 2023 Exceeded Inflation for the First Time Since the Pandemic – CUPA-HR

    by CUPA-HR | March 27, 2024

    New research from CUPA-HR has found that median pay increases for most higher education employees in 2023-24 continued the upward trend seen last year (and exceeded the inflation rate for the first time since 2019-20). However, the findings also show that most higher ed employees are still being paid less than they were in 2019-20 in inflation-adjusted dollars.

    The largest gap between pre-pandemic inflation-adjusted salaries and current salaries is for tenure-track faculty (earning 9.7% less), followed by non-tenure-track teaching faculty (earning 8.2% less). The smallest gap is for staff (earning only 0.3% less).

    Other key findings from an analysis of CUPA-HR’s higher ed workforce salary survey data from 2016-17 to 2023-24 include:

    • Non-tenure-track teaching faculty received their highest raise in the past eight years.
    • Staff (generally non-exempt employees) received the highest increase in pay in comparison to other employee types. This was true last year as well.
    • Tenure-track faculty continued to receive the lowest pay increases (and were the only group of employees whose raise did not surpass inflation).

    Across higher ed, employees are still being paid less than they were in 2019-20 (pre-pandemic) in inflation-adjusted dollars. Tenure-track faculty are the group with the largest gap between median salaries in 2019-20 adjusted to 2023-24 dollars and actual median salaries in 2023-24, earning 9.7% less. This is followed by non-tenure-track teaching faculty (earning 8.2% less). The smallest gap is for staff (earning only 0.3% less).

    High inflation has only exacerbated the gaps in pay increases faculty (particularly tenure-track faculty) experience in relation to other higher ed employees. Further, even though most higher ed employee groups received raises that beat inflation in 2023-24, these raises did not reverse the erosion of higher ed employee purchasing power that has been occurring since 2019-20.

    Explore this data and more in CUPA-HR’s newest interactive graphic.

    CUPA-HR Research

    CUPA-HR is the recognized authority on compensation surveys for higher education, with its workforce surveys designed by higher ed HR professionals for higher ed HR professionals and other campus leaders.


    Source link

  • CUPA-HR’s Equal Pay Day Data for Higher Education: Women in Higher Ed Are Paid Just 82 Cents on the Dollar, Most Women of Color Are Paid Even Less – CUPA-HR

    CUPA-HR’s Equal Pay Day Data for Higher Education: Women in Higher Ed Are Paid Just 82 Cents on the Dollar, Most Women of Color Are Paid Even Less – CUPA-HR

    by Julie Burrell | March 12, 2024

    Since 1996, the National Committee on Pay Equity has acknowledged Equal Pay Day to bring awareness to the gap between men’s and women’s wages. This year, Equal Pay Day is March 12 — symbolizing how far into the year women must work to be paid what men were paid in the previous year.

    To help higher ed leaders understand, communicate and address gender pay equity in higher education, CUPA-HR has analyzed its annual workforce data to establish Higher Education Equal Pay Days for 2024. Tailored to the higher ed workforce, these dates observe the gender pay gap by marking how long into 2024 women in higher ed must work to make what White men earned the previous year.

    Higher Education Equal Pay Day fell on March 5, 2024, for women overall, which means that women employees in higher education worked for more than two months into this year to gain parity with their White male colleagues. Women in the higher ed workforce make on average just 82 cents for every dollar a White male employed in higher ed makes.

    Highlighting some positive momentum during this Women’s History Month, some groups of women are closer to gaining pay equity. Asian American women in higher ed worked two weeks into this year to achieve parity on January 14 — not ideal, but by no means insignificant. In fact, during the academic year 2022-23, Asian American women administrators in particular saw better pay equity than most other groups, according to CUPA-HR’s analysis.

    But the gender pay gap remains for most women, and particularly for women of color. Here’s the breakdown of the gender pay gap in the higher ed workforce, and the Higher Education Equal Pay Day for each group.* These dates remind us of the work we have ahead.

    • March 5 — Women in Higher Education Equal Pay Day. On average, women employees in higher education are paid 82 cents on the dollar.
    • January 14 — Asian Women in Higher Education Equal Pay Day. Asian women in higher ed are paid 96 cents on the dollar.
    • March 1 — White Women in Higher Education Equal Pay Day. White women in higher ed are paid 83 cents on the dollar.
    • March 12 — Native Hawaiian/Pacific Islander Women in Higher Education Equal Pay Day. Native of Hawaii or Pacific Islander women in higher ed are paid 80 cents on the dollar.
    • March 28 — Black Women in Higher Education Equal Pay Day. Black women in higher ed are paid 76 cents on the dollar.
    • April 12 — Hispanic/Latina Women in Higher Education Equal Pay Day. Hispanic/Latina women in higher ed are paid 72 cents on the dollar.
    • April 22 — Native American/Alaska Native Women in Higher Education Equal Pay Day. Native American/Alaska Native women are paid just 69 cents on the dollar.

    CUPA-HR research shows that pay disparities exist across employment sectors in higher ed — administrators, faculty, professionals and staff — even as the representation of women and people of color has steadily increased. But with voluntary turnover rising, not addressing pay disparities could be costly.

    CUPA-HR Resources for Higher Education Equal Pay Days

    As we observe Women’s History Month and Higher Education Equal Pay Days for women, we’re reminded that the fight for equal pay is far from over. But data-driven analysis with the assistance of CUPA-HR research can empower your fight for a more equitable future.

    See our interactive graphics that track gender and racial composition, as well as pay, of administrative, faculty, professional, and staff roles, collected from CUPA-HR’s signature surveys:


    *Data Source: 2023-24 CUPA-HR Administrators, Faculty, Professionals, and Staff in Higher Education Surveys. Drawn from 633,020 men and women for whom race/ethnicity was known.


    Source link