by Kate Ayres
For many years, the fair access agenda in UK HE has emphasised more transparent and consistent admissions processes that are underpinned by clearer criteria and targeted support. As a qualified accountant and training in Lean Six Sigma, I’ve always been drawn to efficiency, clarity, and measurable improvement – principles that shaped much of my work in HE. However, as I moved into more senior roles and worked more closely with institutional decision-makers, I started to ask a different kind of question: why do some reforms, even when implemented well, seem to make little real difference?
That question sits at the centre of my doctoral research. Despite significant reforms the social composition of Durham University’s student body has felt largely unchanged. From within the institution, it was evident that fairer offer-making was not translating into meaningful shifts in the home-student entrant profile. This revealed an uncomfortable truth: so far, no amount of investment or policy reform can, by itself, reshape the social forces that determine who sees a Durham degree as desirable.
To understand why, we need to stop looking only at what universities do, and start looking at how students behave, and how the wider customer base, or audience, signals who belongs where.
Why aren’t internal reforms enough?
The limited shift in Durham’s home-student body prompts a key question: are our current metrics assuming universities can control demand, when in fact they can only affect the choices of applicants already in their pool?
My research used fourteen years of UCAS admissions data for Durham University to analyse how applicant characteristics, predicted attainment, school type, and socio-economic background intersect with admissions decisions and outcomes. Using multivariate logistic regression and Difference-in-Differences (DiD) analysis, I examined the impact of Durham’s 2019 move from decentralised to centralised admissions.
Results
Since the centralisation of admissions in 2019:
- Contextual students are now 72% more likely to receive an offer, reflecting a major shift in offer-making behaviour.
- Contextual applicants to selecting departments remain 40% less likely to get offers than those applying to recruiting ones.
- No improvement is seen in firm-acceptance rates, suggesting culture or fit still shape applicant choices.
- Insurance-acceptance has risen 21%, showing Durham is increasingly seen as a backup option for these students.
- Contextual students are now 2% less likely to enrol after receiving an offer, raising concerns about deeper barriers to entry.
Trend Analysis


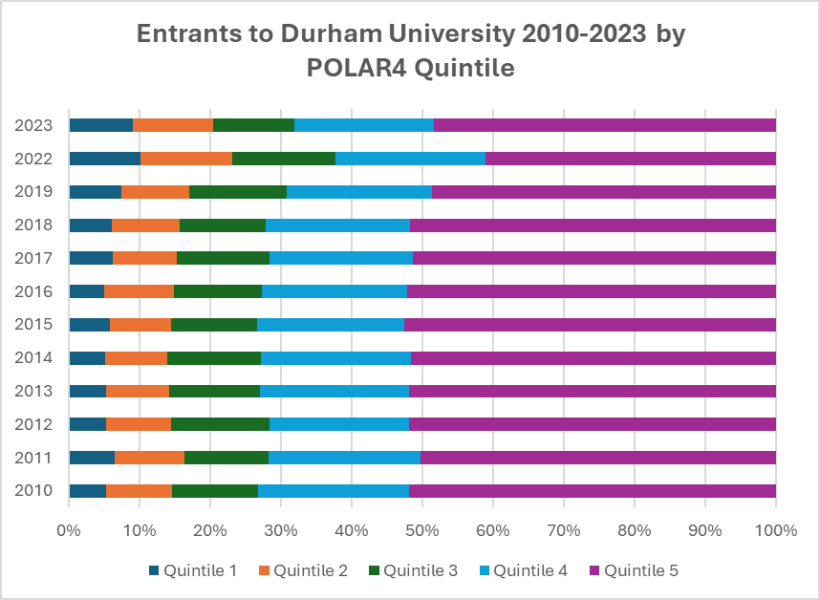
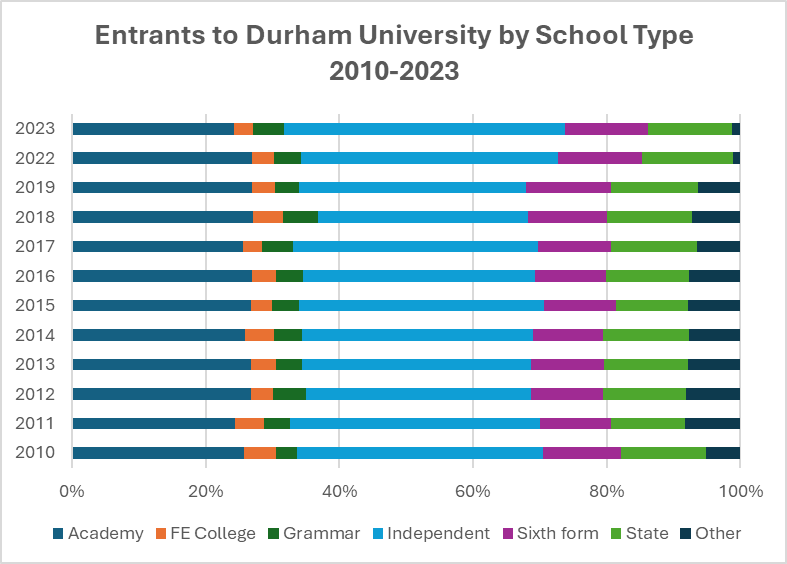
The findings were initially encouraging with Contextual applicants became more likely to receive an offer after centralisation. However, the increased offer rate had very limited effect on who actually enrolled. Contextual applicants were increasingly likely to accept alternative universities before Durham. Meanwhile, the proportion of entrants from higher parental SES groups increased, and independent-school students (already overrepresented) continued to make up around one-third of Durham’s home undergraduate intake in 2023.
Who is in control of demand?
While Durham has a history of taking affirmative action for contextual students, these findings illustrate that the OfS-set POLAR4 ratios will never be achievable for somewhere like Durham because these measures assume that universities themselves control demand. Drawing on Organisational Ecology, I argue that this assumption is flawed.
To understand why improved offer-making did not shift entrant composition, we need to look beyond institutional behaviour and examine the ecosystem dynamics that shape demand. Just as ecosystems rely on diversity, so does HE. No institution can appeal to every audience, nor should it. Organisations operate within ecosystems shaped by social, economic, and political forces, and crucially by their audiences, who ultimately determine demand. Therefore, it is the audience that defines an organisation’s niche. In HE, applicants gravitate toward universities that align with their social tastes, expectations, and sense of belonging. Therefore, the most powerful forces shaping demand are the social networks and information transmissions within and these influence applicants long before they apply: what they hear at school, family expectations, and what peers believe “people like us” do—and where “people like us” go.
Currently, wider systemic shifts are reinforcing and entrenching Durham’s niche, especially among white independent-school applicants:
- As Oxbridge intensifies its widening participation initiatives, applicants who traditionally succeed (predominantly white students from independent schools) are increasingly less likely to secure offers.
- These applicants seek the closest alternative to the Oxbridge experience, with Durham emerging as a preferred option.
- Durham is increasingly accepted as a firm choice because of its perceived “fit” with these applicants’ identity and expectations (as seen in this research).
- These applicants typically achieve their predicted grades, making entry more likely.
- Their growing presence reinforces existing social narratives about Durham’s student profile.
- Consequently, the entrant composition remains socially narrow, and these dynamics may intensify.
- The narrative of Durham as a socially exclusive institution persists.
- Applicants from non-traditional backgrounds thus perceive a lack of belonging.
- As a result, these applicants are less likely to select Durham as their firm choice.
While these dynamics may prompt questions about whether Durham could or should shift away from its position as an “almost-Oxbridge” institution, the evidence suggests that only limited movement is structurally possible. Organisational Ecology predicts that Durham’s niche will remain relatively stable over time and there are many benefits of sticking with a niche approach. The university may be able to broaden its appeal slightly at the margins, drawing in more students from POLAR4 Q3 and Q4 backgrounds, but POLAR4 Q1 and Q2 students are likely to remain outliers. The real question is therefore not whether Durham can radically transform its appeal, but whether it can create the conditions in which those who do apply feel they can belong and thrive. This is where the OfS should take action because, rather than holding universities accountable for applicant pools (which they do not control), it should focus on the areas where institutional agency is strongest. Improving the lived experience of contextual students, strengthening narrative and cultural inclusion, and raising offer-to-acceptance conversion rates are all within Durham’s sphere of influence. Current patterns, particularly the relatively low acceptance and entry rates among contextual applicants, suggest that cultural barriers remain. Regulators should therefore attend less to the composition of the total entrant pool and more to how effectively institutions support, retain, and attract those who already see themselves as potential members of the community.
Taken together, the wider systemic effects detailed above reinforce, rather than shift, Durham’s niche. Only a proportion of applicants will ever feel an affinity with the institution, which is entirely natural in a diverse HE ecosystem where students gravitate toward environments that resonate with their identities and expectations.
These systemic forces lie largely outside Durham’s control, and changing the feedback loop requires more than procedural reform. It demands narrative change within the social networks where ideas of belonging are first formed, and a commitment to ensuring that the lived experiences of contextual students at Durham are positive and affirming. Building stronger partnerships with schools can help shift these early perceptions, while amplifying the stories and experiences of students from diverse backgrounds can offer powerful, alternative points of identification. Applicants make decisions based not just on information, but on a deep, intuitive sense of whether a place feels like it’s for “people like us”. This cannot be achieved through admissions policy, strategy, or marketing alone. Institutions can also look to examples such as the University of Bristol, which has reshaped its entrant pool through doing exactly this. Their efforts have influenced not only who feels able to apply, but who can genuinely imagine themselves thriving within the institution, resulting in a gradual shift in their niche.
Proposal for new metrics
If we evaluate universities on metrics that assume they control demand, we will misread both the problem and the solution. In the short term, universities cannot determine who chooses to apply, but they can influence who feels confident enough to accept an offer, which may, as seen with Bristol, create gradual shifts in the entrant pool over time. Universities can and should work to broaden their niches, yet Organisational Ecology reminds us that institutions rarely move far from their point of peak appeal, meaning Durham’s niche is likely to remain relatively stable and only widen at the margins. Expecting rapid transformation would be like assuming a population adapted to the Arctic could swiftly relocate to the Caribbean. That’s not saying it’s not possible, but it is not fast. Any substantial change in who feels an affinity with Durham will likewise unfold slowly, as cultural experiences and social narratives evolve. In the meantime, improving the lived experience of contextual students, and seeing this reflected in rising conversion rates, is the most realistic and meaningful early sign of movement within the niche. This stability also means that proportion-based performance measures will continue to make the University appear as though it is underperforming, even when it is behaving exactly as expected within its ecological position. Durham has added complexities in that it will always occupy a relatively small share of the HE market because the physical constraints of Durham City limit expansion. This adds presents further broadening of the niche simply because they can’t change by admitting more students.
Therefore, metrics focused solely on broad institutional demand will never fully capture the dynamics of access or institutional “progress”. However, rising conversions – from offer to firm acceptance or offer to entry – among contextual students would signal a growing sense of fit, belonging, or affinity. And even if these students never form a majority, improving conversion is a meaningful and realistic way to measure widening participation progress, because it focuses on what an institution can actually influence, the student experience.
To take these social forces seriously, and to acknowledge that a healthy HE system depends on a diversity of institutions meeting the diverse needs of students, we need metrics that reflect audience attraction and demand dynamics. Current proportion-based measures, fail to capture these realities. Instead, I propose:
- Because Russell Group institutions occupy a similar position in the Blau Space (they attract applicants with comparable social, cultural, and educational characteristics), organisational ecology theory suggests they compete in neighbouring overlapping niches. This means that isolated widening participation initiatives at a single institution may simply redistribute socially advantaged applicants across the group rather than increase diversity overall. Coordinated widening participation strategies across the Russell Group would therefore reduce competitive displacement and support genuine, sector-wide broadening of access.
- Introduce regulatory metrics that reward successful conversion, for example offer-to-firm-acceptance rates for underrepresented groups, rather than focusing solely on offers or entrant proportions. This would bring cultural belonging into WP evaluation by capturing the fact that where these students accept an offer and enter, there is likely be a greater sense of affinity, a place where they feel they can “fit”, belong, and succeed.
- Measure and report the impact of cross-institution outreach among universities with similar audience profiles, recognising that widening participation is driven by sector-level dynamics rather than isolated institutional efforts.
- Track behavioural demand patterns (such as firm-choice decisions) across groups of institutions to reveal how social signalling influences applicant preferences.
The future of access lies in changing what we measure—and what we tell ourselves
Universities often feel they are held solely accountable for widening access, yet my research demonstrates that applicant perceptions, social networks, and systemic hierarchies play an equally powerful role. The most important conclusion of this research is that access outcomes are co-produced. Universities are not solely responsible for entrant composition; applicants are active agents whose perceptions and choices shape institutional realities. To make meaningful change, we need approaches that reflect this distributed responsibility. To make real progress, we must rethink both the metrics we prioritise and the narratives we reproduce.
Fair admissions processes matter – but without addressing the social dynamics shaping applicant behaviour, procedural fairness alone will never deliver equitable outcomes. By shifting the sector’s focus to behavioural metrics and narrative change, we can begin to challenge the feedback loops that sustain exclusivity and move toward a system where access is genuinely a collaborative effort.
Durham University may never appeal to more than a small share of the applicant pool, but perhaps the real measure of success is ensuring that those who do not fit the perceived mould feel confident enough to accept and enter. Ecosystems flourish through diversity, and so does HE; no single institution can – or should – meet every need. Our responsibility is to keep access fair, to reshape the narratives that limit choice, and to support those who want to join us to feel that they truly belong. In focusing on this conversion (from offer to entrant) we move toward a more honest and sustainable understanding of what widening participation success looks like. We cannot control the applicant pool, but we can influence the student experience, the narratives that spread through their networks, and their confidence in imagining themselves belonging here.
Dr Kate Ayres is a Chartered Management Accountant (CIMA) with a DBA from Durham University, where her research explored market niches and widening participation in UK HE through organisational ecology using quantitative methods. She has worked across finance, academic, and project management roles in UK Higher Education, including positions at Durham University and the University of Oxford. Kate currently serves as an Academic Mentor on the Senior Leaders Apprenticeship at Durham University Business School. Her work brings together analytical insight, organisational experience, and a commitment to improving HE culture. She also co-manages and sings with the Durham University Staff Chamber Choir, which she founded.


