Wrapping up a recent course, one of my students approached and asked to talk. It turns out she wasn’t there to review an assignment or clarify a grade. Instead, she was seeking my advice on her future career: what were my thoughts on job prospects for her major; what professional pathways made sense, given our rapidly changing world.
As the conversation touched on search strategies, market forces, and even the shifting nature of work itself, I was struck by how the moment represented a growing phenomenon in higher education: helping students succeed beyond the academic setting is a shared responsibility, particularly as the call for post-academic success continues to grow.
Dedicated career centers lead the way for student success beyond campus, but when students seek guidance on their future professional roles, chances are it will be an instructor to whom they turn. That’s good news for those of us committed to academic success. When students reach out to faculty for career advice, it’s an opportunity to deepen trust and strengthen learner confidence–principles that correlate with learning success. It also allows us to link learning with purpose, while helping us more deeply understand the evolution of our disciplines.
Integrating career readiness into our courses benefits us all. Here are some simple steps to get started:
Instructors Are Career Influencers—Whether We Know It or Not
Classroom instructors are the most consistent professional mentors that students encounter throughout their college years. A passing comment about your own career trajectory, or a few minutes spent discussing potential paths in your field, can expand a student’s sense of what’s possible, particularly for those whose backgrounds lack the types of professional networks that can impact professional success. Inviting professionals into the classroom–whether through alumni networks, or local industry—is an opportunity to provide students with professional roadmaps. Sharing examples of the different ways your discipline shows up in the world can likewise orient students towards a meaningful future in which they will likely change careers multiple times. To help guide conversations, invite students to explore so-called “clusters” of careers using tools such as the U.S. Department of Labor’s Occupational Information Network which provides data on growing fields and industries.
Relevance Drives Engagement
When students understand how their academic work connects to real-world applications, their engagement deepens. They’re more likely to push through a complex assignment when they see how it builds toward the type of skills they can apply to future employment. Not every lesson needs to turn into a job training session but connecting the “what” of our teaching to the “why” that students are so often seeking strengthens outcomes and can also improve student satisfaction. Studies indicate that students gain motivation when they can see how the skills they’re developing serve a purpose beyond the classroom, so canvassing students about their future career goals and integrating conversations and activities that help them map content to careers can be highly effective.
Every Discipline Includes Transferable Skills
Supporting students with future career goals means guiding them to recognize key competencies that develop across disciplines and that are prioritized across professional fields. Key among these are the skills of critical thinking, communication, teamwork, cultural fluency, and ethical decision-making. Students won’t always recognize these as in-demand skills unless we name them, so consistently referencing their utility is an impactful step. That might mean pointing out that a history paper builds research skills; a biology lab fosters analytical reasoning; and a group project in any discipline develops collaboration and leadership skills that are prized in the workplaces of today. By drawing attention to these connections, we help students value the breadth of what they’re learning while helping them understand how to showcase these skills to future employers.
Hybrid Skills Define the Modern Workforce
Today’s employers seek graduates who bring both depth and versatility, meaning team members who know the specifics of their field, but can also communicate, adapt, and think creatively. These hybrid profiles are in demand across sectors and instructors can support their students by embedding assignments that mirror real-world demands. Case studies, presentations, simulations, along with reflective writing, all offer chances to practice skills that matter in professional life. When we give students opportunities to apply knowledge in dynamic ways, we prepare them not only for jobs, but for the type of lifelong learning these professional positions will demand.
Helping students prepare for their careers doesn’t dilute academic rigor; it strengthens it by affirming that education matters in the world beyond academics. That day in the classroom, as I listened to my student’s questions about her future, I realized she wasn’t looking for certainty, but rather the opportunity to engage in the very skills we’ve always valued in teaching: critical questioning, reflection, and the ability to envision new ways to advance. Faculty are in a unique position to offer this type of guidance. Embracing and integrating career readiness into our teaching supports the pedagogical goals of the classroom while helping students succeed well beyond them.
Juli S. Charkes, EdD, is a former Director of a Center for Teaching and Learning where she led faculty development across 100 academic programs. She has been a classroom instructor for the past 14 years, teaching organizational leadership, communications, and media studies at both the undergraduate and graduate levels.
Pleschová, G., Sutherland, K. A., Felten, P., Forsyth, R., & Wright, M. C. (2025). Trust-building as inherent to academic development practice. International Journal for Academic Development, 30(1), 1–13. https://doi.org/10.1080/1360144X.2025.2454704
Fish, N., Bertone, S., & van Gramberg, B. (2025). Improving student engagement in employability development: recognising and reducing affective and behavioural barriers. Studies in Higher Education, 1–16. https://doi.org/10.1080/03075079.2025.2461271
When students of different years of study share a common class, their levels of experience and confidence differ. Students from lower years of study may hesitate to speak up in the presence of those in higher years, while more experienced students may contribute more freely. These dynamics are common and, if left unaddressed, can reinforce a power imbalance that discourages active learning.
The same challenge shows up at the start of a semester. When students meet a lecturer for the first time, the unfamiliarity often makes them cautious. Most hold back. It is not because they lack curiosity, but because they are unsure how their answers or questions will be received.
This hesitation can hold back meaningful participation. I have come to learn that all it takes is a simple, intentional tool to change the energy of a room and give every student the confidence to contribute.
One such tool that has had a lasting impact on my teaching is the “Parking Lot.”
Discovering the Parking Lot
The Parking Lot is a simple but powerful active-learning tool: a dedicated space, physical or digital, where students can “park” their questions, comments, or reflections for later discussion. This allows a session to keep its flow while assuring students that their contributions will be acknowledged.
I first encountered this tool during a two week professional development course on Competency-Based Education and Training (CBET) delivery organized by my university.
I left the training with many ideas for making my teaching more interactive, but the Parking Lot stayed with me as a practical, low-cost strategy I could implement immediately.
A few months later, in early September 2025, I have the privilege of leading an inaugural 40-Hour Mediation Training and Certification program, a capacity-building initiative for students and staff members.
As project lead, I handled admissions and could tell from the applications that we had a mix of students from different years and one staff member. I worried that students from lower years might hold back and that quieter voices might be lost. I wanted every participant to feel their questions, comments, and opinions mattered.
During the pre-training meeting, I asked the trainers if I could introduce the Parking Lot as a way to encourage engagement, and they graciously agreed.
Bringing the Parking Lot to Life
On the first day of the training, I wrote PARKING LOT on a manila sheet, taped it to the front wall near the exit, and placed sticky notes on each participant’s table. The trainers invited me to explain how it worked.
I explained the purpose of the parking lot and encouraged participants to write their questions on sticky notes at any point in the day, during sessions, breaks, or even early the next morning, if they were not ready to raise their hand.
The results were immediate and encouraging. By the end of the first day, the Parking Lot had several notes posted. The trainers reviewed and addressed them the following morning, and participants continued to engage with it throughout the week.
Some who started by writing anonymous notes eventually became confident enough to ask questions aloud. The trainers later confirmed that the Parking Lot had improved participation and enriched the discussions.
This success made me curious to see what would happen if I tried it in my regular semester classes, which were about to begin the following week.
Applying the Parking Lot in My Classes
It was my first class of the semester, and I wanted to set the tone for participation. I was teaching a fourth year second semester class on Alternative dispute Resolution.
This time, I didn’t use the Parking Lot just to collect questions — I used it to invite feedback and spark discussion.
The first question I asked was “What rules should govern our class this semester?” Students wrote their suggestions on sticky notes, and we created a “social contract” for the semester, another active learning technique I am experimenting with.
I read the suggestions aloud and asked students, “What does this rule mean for us as a class?” or “How might we apply this rule in practice?” Their answers led to rich discussion, and I saw the power of shared responsibility as play when we agreed on the class rules, their application and consequences for both the students and the teacher.
I then used the Parking Lot to ask questions to introduce the course I was teaching that semester: “What do you think is conflict?”, “What do you think is a dispute?”, “What is the difference?” Reading their answers helped me identify and gently correct misconceptions without putting anyone on the spot. The class became so interactive that students were surprised when time was up.
Motivated by the positive results, later that same day, I used the Parking Lot in my first-year, second-semester on Legal Research & Writing class.
I asked students to write down on the sticky notes why they chose to study law and what they hoped to do with their degree. I told them that their reasons could serve as a compass something to help them find direction, stay true to their path, and never lose sight of their reason for being in law school when the journey becomes challenging.
I read their answers aloud, offered encouragement, and connected their aspirations back to the course outcomes. For example, I reminded them that to become a defender of human rights, one must not only know how to find the correct law but also be capable of writing clearly and persuasively.
This exercise gave even the quietest students a voice and set a tone of openness and shared purpose for the rest of the semester.
Lessons Learned
In the three instances I have applied the Parking Lot with different groups of students, I have seen it:
Activate students’ thinking early as they process the material and reflect on what they are learning.
Open up discussion by creating a safe space where every student’s voice can be heard.
Reveal misconceptions and allow them to be addressed gently, without putting anyone on the spot.
Connect student contributions to learning outcomes, helping them see why what they wrote matters to the course.
Encourage students to take ownership of their learning, which builds confidence and keeps them engaged.
Create opportunities for mentorship, by affirming students’ ideas, encouraging them, and guiding them as they think about their future career paths.
Reflection
This experience brought me to the realization that innovation in teaching, even in public universities where resources are often limited, does not need complicated technology or big budgets.
A manila paper sheet, some sticky notes, and a willingness to listen can transform the classroom.
Most of all, this experience affirmed why I teach: to create spaces where every student, confident or quiet, can grow.
Seeing students engaged, sharing openly, and losing track of time because they are so absorbed in the conversation is one of the most rewarding experiences I can have as an educator.
What You Can Do Tomorrow
Bring a manila sheet and sticky notes to class, tape the sheet where students can see it as they leave, and invite them to post their questions, answers or reflections.
Review and address a few notes immediately or at the start of the next class. You may be surprised how quickly even the quietest students start to contribute.
J. Muthoni Mwangi, LL.B, PGDip Law, LL.M, is an Assistant Lecturer at JKUAT School of Law – Karen Campus, an Advocate of the High Court of Kenya, an Associate Member of CIArb, and an Accredited Mediator with SDRC. She served as Project Lead for the inaugural JKUAT 40-Hour Mediation Training & Certification and is passionate about learner-cantered legal education, mentoring the next generation of mediators, and promoting access to justice.
Interpersonal communication theories not only help students navigate personal and professional relationships but also strengthen teacher-student connections. Drawing on Orón (2018) and Orón Semper & Blasco (2018), we encourage instructors to use this one-day activity to shift from a “student-centered” to an “interpersonal relationship-centered” pedagogy. This approach views instructor-student relationships as essential to learning and as a space for students to apply theory with relational intent. The activity promotes self-reflexivity, theory analysis, and collaborative dialogue, resulting in improved theory comprehension, stronger rapport, and communication practices that respect classroom diversity.
Student and instructor diversity in higher education has grown significantly in recent years (Li & Koedel, 2017), with over a million international students enrolled in U.S. universities (Urban, 2016). This diversity—across culture, gender, race, ability, and socioeconomic status—shapes classroom dynamics and presents unique challenges related to language, identity, and cultural differences (Jones et al., 2021). Instructors must respond by creating inclusive learning environments that support all students (Downing & Billotte Verhoff, 2023). Diversity also presents an opportunity to apply communication theories to foster intercultural empathy and improve collaboration. Students may initially struggle to understand and respect differing perspectives, affecting group work and engagement (Gray et al., 2020), but these challenges can become learning opportunities that deepen classroom inclusivity.
Communication scholars often apply interpersonal communication theories in the classroom to strengthen student–teacher relationships (Xie & Derakhshan, 2021). This single class activity integrates uncertainty management, self-disclosure, and communication accommodation theory (CAT) for undergraduate students to (a) to understand and (b) apply these theories to facilitate an inclusive and self-reflexive classroom. Teachers are the leading actors during everyday interaction and play a significant role in shaping communication and enhancing the teaching and learning process (Almas Rizkika Nabila, 2020). This activity encourages students to actively co-create a meaningful learning experience, highlighting the reciprocal nature of classroom interaction (Anyichie & Butler, 2023; Kong, 2021).
Self-disclosure: Communication Privacy Management
Self-disclosure is “any conversation about the self that a person communicates to others” (Ampong et al., 2018). Communication Privacy Management (CPM) theory helps students understand how they set and manage privacy boundaries with peers and instructors (Petronio et al., 2021). The intersection of privacy boundaries and the learning space is complicated as students and instructors navigate privacy. Instructors deliver the lecture and explain the course content, but they also intentionally and willingly share their personal stories (Liu & Zhu, 2021). For instance, the first author, an international graduate assistant, connects class discussions to experiences from his home country, helping students relate and engage. Such instructor self-disclosure encourages student participation and fosters more meaningful classroom communication (Goldstein, 1994) (Liu & Zhu, 2021).
However, instructors and students rarely critically examine the disclosure norms in the classroom and their role in learning and relationship building. For example, disclosure boundaries (i.e., how far instructors can go to share their experiences) (Cayanus, 2004). Additionally, while students may attend to how much information they share in the classroom, this activity challenges them to apply CPM theory to examine their disclosure practices, expectations, and privacy boundary negotiations.
Communication Accommodation Theory
Communication Accommodation Theory (CAT) explains how individuals adjust their communication such as speech, tone, pace, gestures, or body language—to interact effectively with others. Instructors can use CAT to enhance student understanding during lectures (Howard Giles, 2023).The theory outlines two key strategies: convergence, where a speaker adapts to another’s communication style (e.g., simplifying vocabulary, repeating phrases, pausing, smiling, nodding), and divergence, where a speaker maintains differences by avoiding shared cues (e.g., using complex words, changing topics, or not adjusting speaking pace) (Marko Dragojevic, 2016) (Pardo et al., 2022).
Drawing on this research, the goal of this activity is 1) to understand the theories and analyze how they facilitate the teaching process, 2) to explore the perceptions of students about these theories and their inclusion in the classroom, 3) to determine the expectations of students related to characteristics of these theories.
The Activity
This single-class activity applies to various undergraduate courses, such as public speaking, communication among cultures, communication in interpersonal relationships, argument analysis and advocacy, and persuasion. Instructors can do this activity during introduction week as they begin navigating disclosures about themselves and student expectations. Moreover, planning this activity at the beginning will challenge students to examine their positionalities, norms, and expectations critically.
Step 1: Personal Reflection
Before implementing the activity, instructors should familiarize themselves with relevant communication theories and reflect on how their own identities shape their teaching assumptions (Nabila, 2020, Downing & Billotte Verhoff, 2023). We recommend engaging in self-reflexive questions, such as: What disclosure boundaries do I set and why? What uncertainties do I face around privacy or accommodation in teaching? What expectations exist between me and my students regarding communication and flexibility? Instructors should identify what personal information they’re willing to share, why they’re sharing it, and how it might impact classroom relationships. For example, the first author reflected on cultural and linguistic differences and adjusted his teaching by using simpler language, acknowledging English is not his first language, and setting shared guidelines to support mutual understanding and accommodation. This reflective process helps align instructional practices with inclusive, theory-informed pedagogy.
Step 2: Students’ Perceptions About Components of Theories
This activity takes approximately 30 to 40 minutes and is best suited for a full class session. Instructors should introduce the key theories with examples and explain the activity’s purpose and timing. For advanced courses, assigning theory readings beforehand can deepen analysis, making it more effective to conduct the activity later in the semester rather than at the start. During the session, students should be divided into groups of four and asked to write their expectations for the course and the instructor. To guide discussion, instructors can pose prompts such as:
What expectations do you have for your instructor when it comes to using different communication accommodation strategies?
How do you manage your own self-disclosure in the classroom? Where do you draw the line on what you choose to share?
What are your thoughts on instructors’ self-disclosure? What types of disclosures have a positive or negative impact on your learning experience?
How comfortable are you with classroom communication? What strategies could reduce uncertainty or discomfort?
How do you plan to engage with and accommodate diversity in terms of culture, race, gender identity, and sexual orientation in your classroom interactions?
Can you connect your responses to the core ideas of the communication theories we’ve discussed? How do these theories help explain disclosure and accommodation in the classroom context?
These questions will provide space for students to reflect on their experiences. Moreover, during that time, the instructor will also answer these questions from the instructor’s perspective and enlist the convergence techniques they perceive to accommodate. Instructors can give 15 to 20 minutes to answer the provided questions briefly.
Step 3: Describing the Theories and Their Impact
Instructors will invite each group to share their responses, followed by the instructor’s own disclosure of planned strategies—such as accommodation, anticipated uncertainties, and boundaries around self-disclosure. A comparison table with two columns (students vs. instructor) can be used to visually display both perspectives. Instructors then lead a discussion with prompts like: Why do these expectations exist? What differences or overlaps emerge? How do these perspectives interact? This activity encourages students to (a) practice perspective-taking shaped by diverse identities, (b) apply key concepts like co-creating privacy boundaries (CPM), and (c) see how theory fosters a supportive learning environment. Since student familiarity with these theories may vary, instructors should first assess their basic understanding.
Debriefing
At the end of the activity on the same day. Instructors can initiate the debriefing by including the Q&A sessions such as:
How did this activity impact, how you view self-disclosure and accommodation?
What do you understand about embedding these theories in the classroom?
How can this activity help to build a good student-teacher relationship and create an inclusive environment in the classroom?
Appraisal
In the second week, I (the first author) compiled all responses into a table and presented it to the class. I briefly discussed both student and instructor perspectives, then posted reflection prompts on Blackboard for feedback. Students responded positively, noting that the activity was enjoyable and helped them get to know one another. Many emphasized the importance of communication accommodation, agreeing that in a diverse classroom, convergence strategies are essential for fostering inclusion and mutual respect. One student highlighted that accommodation is key to ensuring understanding and promoting respectful interaction (see Table 1).
Table 1: Responses of Students and Instructor
Communication Accommodation
Self-disclosure
Uncertainty
Students
-Speaking slower during a speech even when anxious** -Staying away from slang words to avoid language barriers -Clear annunciation -Respectful of each other’s speaking language** -Appropriate tone/voice -In class participation -Speaking clearly and loudly**** -Visual cue images if doing a speech. -Articulation -Be patient -Stay engaged -Ask him to repeat
-Disclose how comfortable you are speaking in front of a group, so the professor understands your anxiety or emotion towards speech presentation ** -Disclosing where you are from, what languages you, speak, and how much you understand a topic will be very important to critiquing your peers on their speeches -Safe space -No personal information**** -No social media -Should disclose important and relevant events that could affect quality -Establish boundaries
-Topics that peers choose to speak about throughout the semester may be understood less or more by others -How to write a speech -How we will be graded -How heavy the workload will be -Fear of asking questions -Ask for help when needed -Talking in front of people preparation -Speech topics (Range of issues) -Comfort -What is expected of us from the professor -Memorizing speeches -Deadlines -Clear instructions for assignments -Reminders of important dates -Remember to submit assignments -Nervous
Instructor
-Speak slowly -Use clear words -Allow students to ask questions -Repeat my words without asking -Take a break during lecture and ask students if they have any concern or not -Making good eye contact -Listen everyone carefully -Give everyone chance to speak
-If you are comfortable to share your personal information you can, we can make a rule that whatever you share in this class will stay in this class
-How do you feel when I show attendance sheet on BB -How do you feel about forgetting your name -What do you think when it takes time to respond to your email -How you think when you meet me outside of class at court street on weekends
One limitation of this activity is the time required to develop and implement it during the first week of the semester, making early planning essential. Second, the activity is best suited for small classes; in larger classrooms, it may be difficult to follow all steps without modification. Lastly, delayed feedback or response-sharing may reduce the activity’s impact, as students may forget key details over time.
Athar Memon, MBBS, MSPH, is a graduate student in the PhD program in the Scripps School of Communication Studies at Ohio University. Athar Memon research interest is related to health communication specifically health care access, behaviors to access healthcare services among marginalized population, barriers related to patient-provider interpersonal communication, health literacy and its relationship with health outcomes and healthy behaviors. His work has been published in various journals including Professional Medical Journal, Journal of Pakistan Medical Association, Pakistan Journal of Public Health, PEC Innovation, and Eastern Mediterranean Journal.
China C. Billotte Verhoff, PhD, (Purdue University) is an Assistant Professor in the School of Communication Studies at Ohio University. Dr. Billotte Verhoff’s research agenda lies at the intersections of interpersonal and organizational communication. Specifically, she explores how individuals with marginalized and stigmatized identities navigate self-disclosure and social support processes to identify the associated relational, career, and health outcomes. Dr. Billotte Verhoff’s work has been published in peer-reviewed journals such as Communication Monographs, the Journal of Language and Social Psychology, Communication Studies, Sex Roles, Women and Language, and Health Communication.
References
Almas Rizkika Nabila, A. M., Syafi’ul Anam. 2020. “TEACHER’S MOTIVES IN APPLYING COMMUNICATION ACCOMMODATION STRATEGIES IN SECONDARY ELT CLASS. Linguistic, English Education and Art (LEEA) Journal, 3(2), 373-384.”
Ampong, G. O. A., Mensah, A., Adu, A. S. Y, Addae, J. A., Omoregie, O. K., & Ofori, K. S. 2018. “Examining Self-Disclosure on Social Networking Sites: A Flow Theory and Privacy Perspective. Behav Sci (Basel), 8(6).”
Anyichie, A. C., & Butler, D. L.. 2023. Examining culturally diverse learners’ motivation and engagement processes as situated in the context of a complex task. Frontiers in Education,
Cayanus, J. L.. 2004. “Effective Instructional Practice: Using Teacher Self-Disclosure as an Instructional Tool. Communication Teacher, 18(1), 6-9.”
Downing, S. S., & Billotte Verhoff, C. C. 2023. “Incorporating mini lessons on the hidden curriculum in communication classrooms. Communication Teacher, 37(3), 246-253.”
Ewa Urban, L. B. P.. 2016. “International Students’ Perceptions of the Value of U.S. Higher Education Journal of International Students, 6(1), 153-174.”
Gray, D. L., McElveen, T. L., Green, B. P., & Bryant, L. H.. 2020. Engaging Black and Latinx students through communal learning opportunities: A relevance intervention for middle schoolers in STEM elective classrooms. Contemporary Educational Psychology, 60, 101833.
Howard Giles, A. L. E., Joseph B. Walther. 2023. Communication accommodation theory: Past accomplishments, current trends, and future prospects.
Jones, B. D., Krost, K., & Jones, M. W.. 2021. Relationships between students’ course perceptions, effort, and achievement in an online course. Computers and Education Open, 2, 100051.
Kong, Y. 2021. The Role of Experiential Learning on Students’ Motivation and Classroom Engagement. Front Psychol, 12, 771272.
Li, D., & Koedel, C. 2017. “Representation and salary gaps by race-ethnicity and gender at selective public universities. Educational researcher, 46(7), 343-354.”
Liu, X., & Zhu, L. 2021. The Role of EFL Teachers’ Self-Disclosure as Predictors of Student’s Willingness to Communicate and Their Engagement. Front Psychol, 12, 748744.
Marko Dragojevic, J. G., Howard Giles. 2016. Accommodative Strategies as Core of the Theory. Communication Accommodation Theory: Negotiating Personal Relationships and Social Identities across Contexts, 36-59.
Pardo, J. S., Pellegrino, E., Dellwo, V., & Möbius, B. 2022. Special issue: Vocal accommodation in speech communication. Journal of Phonetics, 95, 101196.
Petronio, S., Child, J. T., & Hall, R. D. 2021. Communication privacy management theory: Significance for interpersonal communication. In Engaging theories in interpersonal communication (pp. 314-327). Routledge.
Xie, F., & Derakhshan, A. 2021. A Conceptual Review of Positive Teacher Interpersonal Communication Behaviors in the Instructional Context. Front Psychol, 12, 708490.
In my classroom, students increasingly ask for relevant content. Students want to know how what they are learning in school relates to the world beyond the classroom. They want to be engaged in their learning.
In fact, the 2025-2026 Education Insights Report vividly proves that students need and want engaging learning experiences. And it’s not just students who see engagement as important. Engagement is broadly recognized as a key driver of learning and success, with 93 percent of educators agreeing that student engagement is a critical metric for understanding overall achievement. What is more, 99 percent of superintendents believe student engagement is one of the top predictors of success at school.
Creating highly engaging lesson plans that will immerse today’s tech-savvy students in learning can be a challenge, but here are two easy-to-find resources that I can turn to turbo-charge the engagement quotient of my lessons:
Virtual field trips Virtual field trips empower educators to introduce students to amazing places, new people and ideas, and remarkable experiences–without ever leaving the classroom. There are so many virtual field trips out there, but I always love the ones that Discovery Education creates with partners.
I also love the virtual tours of the Smithsonian National Museum of Natural History. Together as a class or individually, students can dive into self-guided, room-by-room tours of several exhibits and areas within the museum from a desktop or smart device. This virtual field trip does include special collections and research areas, like ancient Egypt or the deep ocean. This makes it fun and easy for teachers like me to pick and choose which tour is most relevant to a lesson.
Immersive learning resources Immersive learning content offers another way to take students to new places and connect the wider world, and universe, to the classroom. Immersive learning can be easily woven into the curriculum to enhance and provide context.
One immersive learning solution I really like is TimePod Adventures from Verizon. It features free time-traveling episodes designed to engage students in places like Mars and prehistoric Earth. Now accessible directly through a web browser on a laptop, Chromebook, or mobile device, students need only internet access and audio output to begin the journey. Guided by an AI-powered assistant and featuring grade-band specific lesson plans, these missions across time and space encourage students to take control, explore incredible environments, and solve complex challenges.
Immersive learning content can be overwhelming at first, but professional development resources are available to help educators build confidence while earning microcredentials. These resources let educators quickly dive into new and innovative techniques and teaching strategies that help increase student engagement.
Taken together, engaging learning opportunities are ones that show students how classrooms learnings directly connect to their real lives. With resources like virtual field trips and immersive learning content, students can dive into school topics in ways that are fun, fresh, and sometimes otherworldly.
Leia J. DePalo, Northport-East Northport Union Free School District
Leia J. (LJ) DePalo is an Elementary STEM and Future Forward Teacher (FFT) in the Northport-East Northport School District with over 20 years of experience in education. LJ holds a Master of Science in Literacy and permanent New York State teaching certifications in Elementary Education, Speech, and Computer Science. A dedicated innovator, she collaborates with teachers to design technology-infused lessons, leads professional development, and choreographs award-winning school musicals. In recognition of her creativity and impact, DePalo was named a 2025 Innovator Grant recipient.
Latest posts by eSchool Media Contributors (see all)
Quality education must go beyond textbooks and lectures. It should connect students with current events and equip them with skills for real-world engagement. When teaching a theoretical framework, for example, educators should demonstrate to students how that framework applies in real-life scenarios (Jeffrey von Freymann 2025). Similarly, lessons on historical events should include the context and consequences of those moments, linking the past to the present in ways that resonate with students’ lived experiences. Results from the 2023 National Survey of Student Engagement indicate that students benefit from high-impact educational activities, reporting deeper learning and increased retention (NSSE 2023).
In today’s changing academic and political climate, many fields—including education and healthcare—are experiencing the effects of administrative shifts and funding uncertainties. Students are vulnerable to these changes and may feel the weight of decisions made beyond their control (Cynthia Vitters et al. 2024). I have discovered that some of my students are not sufficiently educated or engaged in political matters, resulting in their ignorance of the potential consequences these decisions could have on their future careers. Faculty must consider how these broader changes affect their students and the future of their education and careers. I believe the future of education may be impacted on a scale larger than the sum of our individual experiences.
Fortunately, students bring energy, big ideas, and a passion for change. Throughout history, many transformative movements in the U.S. were student-led—from the Civil Rights Movement to recent climate strikes. Faculty should empower students with knowledge and resources to continue this tradition. Civics education is common in specific higher education fields; however, students pursuing careers in healthcare may not have as much familiarity with the process. Faculty have an opportunity to empower students by equipping them with the tools and confidence to participate in public life. It begins with acknowledging the reality: that the political process can be confusing, overwhelming, and discouraging, especially when students are already stretched thin and inundated with grim news. Disengagement is understandable—but it’s not the only option. Future healthcare professionals have a duty to remain engaged in the political process in order to advocate for our patients and ensure the continued accessibility of healthcare services.
By integrating advocacy into the classroom, educators can normalize civic participation and demonstrate how they can contribute to meaningful change. Faculty should first assess their current attitudes and knowledge and then guide them to apply their energy constructively, participating in our civic processes. One effective method is through structured classroom projects that engage students through real advocacy processes. Educators can use established frameworks to guide this process and offer credible models. Three great models identified for the activity discussed below were from the Centers for Disease Control, the deBeaumont Foundation, the American Public Health Association, and the Association of Public Health Nurses (https://www.cdc.gov/nceh/clearwriting/docs/health-comm-playbook-508.pdf, https://www.phnurse.org/advocacy-toolkit, https://phern.communitycommons.org/advocacy/taking-action-advocacy-for-public-health/getting-started-advocacy/).
In a public health nursing course, I recently applied this method with nursing students over a duration of three weeks. Collaborating in small groups, the students selected a topic of interest, conducted research on the issue, and developed potential interventions. The topics chosen by the students were diverse, including vaccine policies, environmental safety, access to healthy food, Medicare funding, and the conflict in Gaza. The groups researched their topics to identify relevant data, current and proposed policies impacting the issue, and organizations currently involved. At this point, they presented their peers with an outline of their findings to begin testing their messaging on the issue at hand and receive constructive feedback. Next, they developed communication materials to promote their intervention and identified potential community partners with whom to form a coalition to achieve shared goals. Their communication options included letters to the editor, media pitches, and social media campaigns. These were designed to inform the public and build support.
Additionally, each group identified an elected official with the power to affect change and wrote a letter outlining the problem and recommended solutions. For extra credit, the student groups were encouraged to schedule a meeting with them or their staff to present their recommendations. Throughout the process, faculty mentored their progress and encouraged deeper engagement and growth. Students periodically paused to present their work to peer groups, and they used this real-time feedback to refine their advocacy and communication strategies. A structured framework gave them direction and confidence. This process teaches students the importance of communication and teamwork, and provides them with real-world experience in advocacy and civic action. In the future, I plan to include a meeting with legislative staff as a required part of this activity based on feedback from students who elected to do the extra credit. They benefited tremendously and reported increased confidence with the process.
Ultimately, teaching the civic process is not about politics—it’s about empowerment. By showing students how to engage thoughtfully, speak confidently, and act collaboratively, we are not only educating them—we are preparing them to shape the future.
Lyndsay Anderson, MSN, FNP-BC, PHN is a clinical faculty member at University of the Pacific. She is a nurse educator, clinician, and researcher with experience in oncology, public health, and nursing education. Lyndsay’s research has focused on reducing cancer disparities among Latina and African American populations and has co-authored numerous peer-reviewed publications in oncology and public health. She holds a Master of Science in Nursing from Georgetown University and a BSN from the University of Virginia. She is currently pursuing her Doctorate of Health Sciences from University of the Pacific.
Dr. Julia VanderMolen is a Professor for the Public Health program at Grand Valley State University and a Visiting Assistant Clinical Professor with the University of the Pacific, School of Health Sciences. Her research examines the benefits of assistive technology for individuals with disabilities in public health. She serves as a board member of the Disability Advocates of Kent County and is an active member of the Disability Section of the American Public Health Association (APHA). Her current research focuses on exploring the health and medical services available to individuals with intellectual and developmental disabilities.
References
APHN Public Health Policy Committee Association of Public Health Nurses. Public Health Policy Advocacy Guidebook and Toolkit. APHN Public Health Policy Committee Association of Public Health Nurses 2021. https://www.phnurse.org/advocacy-toolkit
As educators, we must stay current. What could be more current than Artificial Intelligence? Our students are using this tool at an unprecedented rate, and every technological tool we have is guided by it. We are taking classes to learn how to use it in the classroom and how to teach our students to use it. Grammarly is editing this very article! You are not alone if you feel a bit reticent to jump on the bandwagon. Will it ultimately replace us as educators? As people?
“Artificial Intelligence”. The issue is embedded right in the name: Artificial means not real. Is it here to stay, and can we even fight it? One of our generation’s premier philosophers, Dr. Yuval Harari, said that if we hope to survive, we better fight it (2015). Technology has been hypothesized to be an evolutionary mismatch (Li & Colarelli, 2017). This term implies that behaviors that once supported a species have become injurious. An example of a mismatch is sugary foods. Our nomadic ancestors struggled to procure enough daily calories to sustain life. When they found sugary food, they filled up on it and stored it. In our modern day, too much sugar leads to issues related to early mortality.
Technology can be used as a tool to keep us connected. Unfortunately, it has also slowly evolved into a system that answers every question, educates, and can now act as a companion, moving us slowly away from one another, like the frog in the hot water who realizes too late it is boiling.
The Hidden Costs of Disconnection
What is the cost of this instant ‘answerer of all questions’ and constant companion? It is hard to quantify, but the loss of human interaction is vast and far-reaching. Humans, with their higher cognitive functioning, can live on their own and survive thanks to technology. But should they? The longest social science studies suggest that healthy aging is directly related to meaningful and supportive relationships (Bosworth, & Schaie, 1997; Waldinger, & Schulz, 2023).
Additionally, humans are creatures who are, to simplify, guided by neural stimulation. When we are stressed, or trying to manage life alone, the stress hormone cortisol increases (Doane, L. & Adam E. 2009). High cortisol levels are directly related to inflammation, aging, and many other ailments, and we know that loneliness leads to early mortality (Holt-Lunstead & Layton, 2010). The most efficient home-grown remedy to combat an increase in cortisol is face-to-face meaningful engagement, which will release oxytocin, called the ‘love drug’. Our bodies, meant to be social, will release oxytocin when we engage, which will help to mitigate the system that manages cortisol. Unfortunately, artificial intelligence does not release meaningful amounts of oxytocin, and no pills exist to take because they do not cross the blood-brain barrier (Young-Kuchenbecker, Pressman, Celniker, Grewen, Sumida, Jonathan, Everett, & Slavich, 2021). We are left with the innate and evolutionary need for connection.
If we are to believe Darwin, then the fittest will make it, and most of us know what fitness entails. Fitness is about the mind, the body, and the demands (either placed on you or by you) of your environment. Recent MIT findings suggest that AI has a deleterious impact on our memory and has a high cognitive cost. Participants in the study could not even quote their own work (Kosmyna, Hauptmann, Yuan, Situ, Liao, Beresnitzky, Braunstein, & Maes, 2025).). As we are living longer than any previous generation, our sophisticated society necessitates that we maintain our cognitive fitness for as long as possible. AI certainly appears to be a mismatch in healthy long-term aging.
Educators as Builders of Connection
As educators, our job is to teach the topic at hand along with the soft skills of connection, engagement, community, teamwork, and the power that can be harnessed by more than one mind. Our college-age students suffer the most from loneliness and all the physical and psychological challenges inherent in that experience (Caccioppo & Caccioppo, 2018). In a classroom study, my students investigated loneliness on our campus and found that out of 100 students, 99 of them reported feeling lonely, and it influenced their use of technology (2024).
Artificial Intelligence brings information to our fingertips that might otherwise be unobtainable. It can teach, educate, partner, and save us a lot of time, but we need to learn to use it as a tool and not have it use us. We used to ask questions of experts, older or wiser, which invited connection. Now we ask our device questions, which invites disconnection in that how we phrase our questions to AI will determine the breadth and depth of the answer. In our digital age, the user curates their information (Kjerstin & Wells, 2016). Without another person to offer insight and possible opposing views, the user will often be left with tremendous confirmation bias.
Evolution has taught us that an organism has the best chance of survival if it is connected to others. The Pando in Utah is an ideal example. In Fish Lake National Forest’s 106-acre area, almost 50,000 aspen trees are interconnected with one root system. What infects one tree infects them all. So, how can we help our students connect and use AI effectively while keeping the detrimental effects of AI at bay?
This educator has gone back to a bit of paper and pencil. In the classroom, the students work in small groups that vary weekly on a homework assignment. They can partner for a test and have several out-of-class projects that require a little time to have a conversation. One of the assignments is to record a video of their group talking over a sensitive topic, one that they might not have been comfortable discussing in class. Yes, it takes a bit more time to plan and to grade. However, most of us are teaching a topic that does not lead to a qualifying test or credential so we can afford to cut a bit of material in lieu of helping our lonely students. If the results of the MIT study are to be believed (Kosmyna, 2025), if we don’t do something different, those same students will leave without the knowledge we hoped they would gain or the comfort of connection a classroom can provide. We can do better and need to if we, as educators, are to stay relevant.
Jennifer Smith, PhD, CFLE, is an Assistant Teaching Professor at Kansas State University in the Department of Psychological Sciences. Jennifer received her bachelor’s degree in both psychology and human development from the University of Wisconsin and her master’s degree in counseling from Lakeland University. Additionally, she obtained her PhD in Lifespan Human Development from Kansas State University, with her dissertation focusing on the intersection of technology and relationships. Jennifer is also a CFLE (Certified Family Life Educator) from the National Council on Family Relations. She describes her perspective on all things as “contextual” and approaches her teaching through this lens. Jennifer loves teaching above all else. Her teaching philosophy is “empathic teaching engenders curious learners.”! When not with students, she enjoys traveling with her husband of 30 years, time with her two daughters, serving in her community and naps with her cats!
References
Bosworth, H. & Schaie, K. (1997). The Relationship of Social Environment, Social Networks, and Health Outcomes in The Seattle Longitudinal Study: Two Analytical Approaches. The journals of gerontology. Series B, Psychological sciences and social sciences. 52. P197-205. 10.1093/geronb/52B.5.P197.
Cacioppo, J. T., & Cacioppo, S. (2018). The growing problem of loneliness. The Lancet; the Lancet, 391(10119), 426. doi:10.1016/S0140-6736(18)30142-9
Doane, L. & Adam E.( 2009) Loneliness and cortisol: momentary, day-to-day, and trait associations. Psychoneuroendocrinology. 2010 Apr;35(3):430-41. doi: 10.1016/j. PMID: 19744794; PMCID: PMC2841363.
Harari, Y. N. (2015). Sapiens: A brief history of humankind. HarperCollins Publishers.
Holt-Lunstad, J., Smith, T., & Layton, J. (2010). Social relationships and mortality risk: A meta-analytic review (social relationships and mortality). PLoS Medicine, 7(7), e1000316. doi:10.1371/journal.pmed.1000316
Kosmyna, N., Hauptmann, E., Yuan, Y. T., Situ, J., Liao, X., Beresnitzky, A. V., Braunstein, I., & Maes, P. (2025). Your Brain on ChatGPT: Accumulation of Cognitive Debt when Using an AI Assistant for Essay Writing Task. ArXiv. https://arxiv.org/abs/2506.08872
Li, N., van Vugt, M. & Colarelli, S. (2017) The evolutionary mismatch hypothesis: Implications for psychological science. Current Directions in Psychological Science, 27, 38-44. doi:10.1177/0963721417731378.
Kjerstin, T., Wells, C. (2016) Curated Flows: A Framework for Mapping Media Exposure in the Digital Age, Communication Theory, Vol. 26, (3), p. 309–328. https://doi.org/10.1111/comt.12087
Waldinger, R., & Schulz, M. (2023). The Good Life: Lessons from the World’s Longest Scientific Study of Happiness. Simon & Schuster.
Young Kuchenbecker, S., Pressman, S. D., Celniker, J., Grewen, K. M., Sumida, K. D., Jonathan, N., Everett, B., & Slavich, G. M. (2021). Oxytocin, cortisol, and cognitive control during acute and naturalistic stress. Stress (Amsterdam, Netherlands), 24(4), 370–383. https://doi.org/10.1080/10253890.2021.1876658
As students and teachers prepare for a new school year, it’s important to remember that success in the classroom isn’t just about academics; it’s about supporting the whole child. From motor skills and posture to organization, focus, and sensory regulation, the right strategies can make the learning process smoother and more enjoyable for everyone.
While occupational therapy (OT) is often associated with special education, many OTs like me use and share the supportive tips and tools described below in general education settings to benefit all learners. By integrating simple, classroom-friendly strategies into daily routines, teachers can help students build independence and confidence and see long-term success.
Motor skills
One of the most crucial areas to address is motor skills. Many children entering kindergarten have not yet fully mastered tasks such as cutting or forming letters and shapes correctly. Simple strategies can encourage independence, such as using a “scissor template” taped to a desk to guide proper finger placement or offering verbal cues like “thumbs up” to remind children how to hold the tool correctly. Encouraging the use of a “helper hand” to move the paper reinforces bilateral coordination.
For writing, providing small pencils or broken crayons helps children develop a mature grasp pattern and better handwriting skills. Posture is equally important; children should sit with their feet flat on the floor and their elbows slightly above the tabletop. Adjustable desks, sturdy footrests, or non-slip mats can all help. Structured warm-up activities like animal walks or yoga poses before seated work also prepare the sensory system for focus and promote better posture while completing these tasks.
Executive function
Equally important are executive function skills–organization, planning, and self-regulation techniques–that lay the foundation for academic achievement. Teachers can support these skills by using visual reminders, checklists, and color-coded materials to boost organization. Breaking larger assignments into smaller tasks and using timers can help children manage their time effectively. Tools such as social stories, behavior charts, and reward systems can motivate learners and improve impulse control, self-awareness, and flexibility.
Social-emotional learning
Social-emotional learning (SEL) is another vital area of focus, because navigating relationships can be tricky for children. Social-emotional learning helps learners understand their emotions, express them appropriately, and recognize what to expect from others and their environment.
Traditional playground games like Red Light/Green Lightor Simon Says encourage turn-taking and following directions. Structured programs such as the Zones of Regulation use color-coded illustrations to help children recognize their emotions and respond constructively. For example, the “blue zone” represents low energy or boredom, the “green zone” is calm and focused, the “yellow zone” signals fidgetiness or loss of control, and the “red zone” reflects anger or frustration. Creating a personalized “menu” of coping strategies–such as deep breathing, counting to 10, or squeezing a stress ball–gives children practical tools to manage their emotions. Keeping a card with these strategies at their desks makes it easy to remember to leverage those tools in the future. Even something as simple as caring for a class pet can encourage empathy, responsibility, and social growth.
Body awareness
Body awareness and smooth transitions are also key to a successful classroom environment. Some children struggle to maintain personal space or focus during activities like walking in line. Teachers can prepare students for hall walking with warm-up exercises such as vertical jumps or marching in place. Keeping young children’s hands busy–by carrying books rather than using a cart–also helps. Alternating between tiptoe and heel walking can further engage students during key transitions. To build awareness of personal space, teachers can use inflatable cushions, small carpet squares, or marked spots on the floor. Encouraging children to stretch their arms outward as a guide reinforces boundaries in shared spaces as well.
Sensory processing
Supporting sensory processing benefits all learners by promoting focus and regulation. A sensory-friendly classroom might include fabric light covers to reduce glare, or subtle scent cues used intentionally to calm or energize students at different times. Scheduled motor breaks during transitions–such as yoga stretches, pushing, pulling, or stomping activities–help reset the sensory system. For students with higher sensory needs, a “calming corner” with mats, pillows, weighted blankets, and quiet activities provides a safe retreat for regaining focus.
The vital role of occupational therapists in schools
Employing OTs as full-time staff in school districts ensures these strategies and tools are implemented effectively and provides ongoing support for both students and educators alike. With OTs integrated into daily classroom activities, student challenges can be addressed early, preventing them from becoming larger problems. Skill deficits requiring more intensive intervention can be identified without delay as well. Research demonstrates that collaboration between OTs and teachers–through shared strategies and co-teaching–leads to improved student outcomes.
Wishing you a successful and rewarding school year ahead!
Linda Rini, OTD, MS, OTR/L, CLC, Touro University School of Health Sciences Occupational Therapy Program
Linda Rini, OTD, MS, OTR/L, CLC, is an assistant professor in the Touro University School of Health Sciences Occupational Therapy Program.
Latest posts by eSchool Media Contributors (see all)


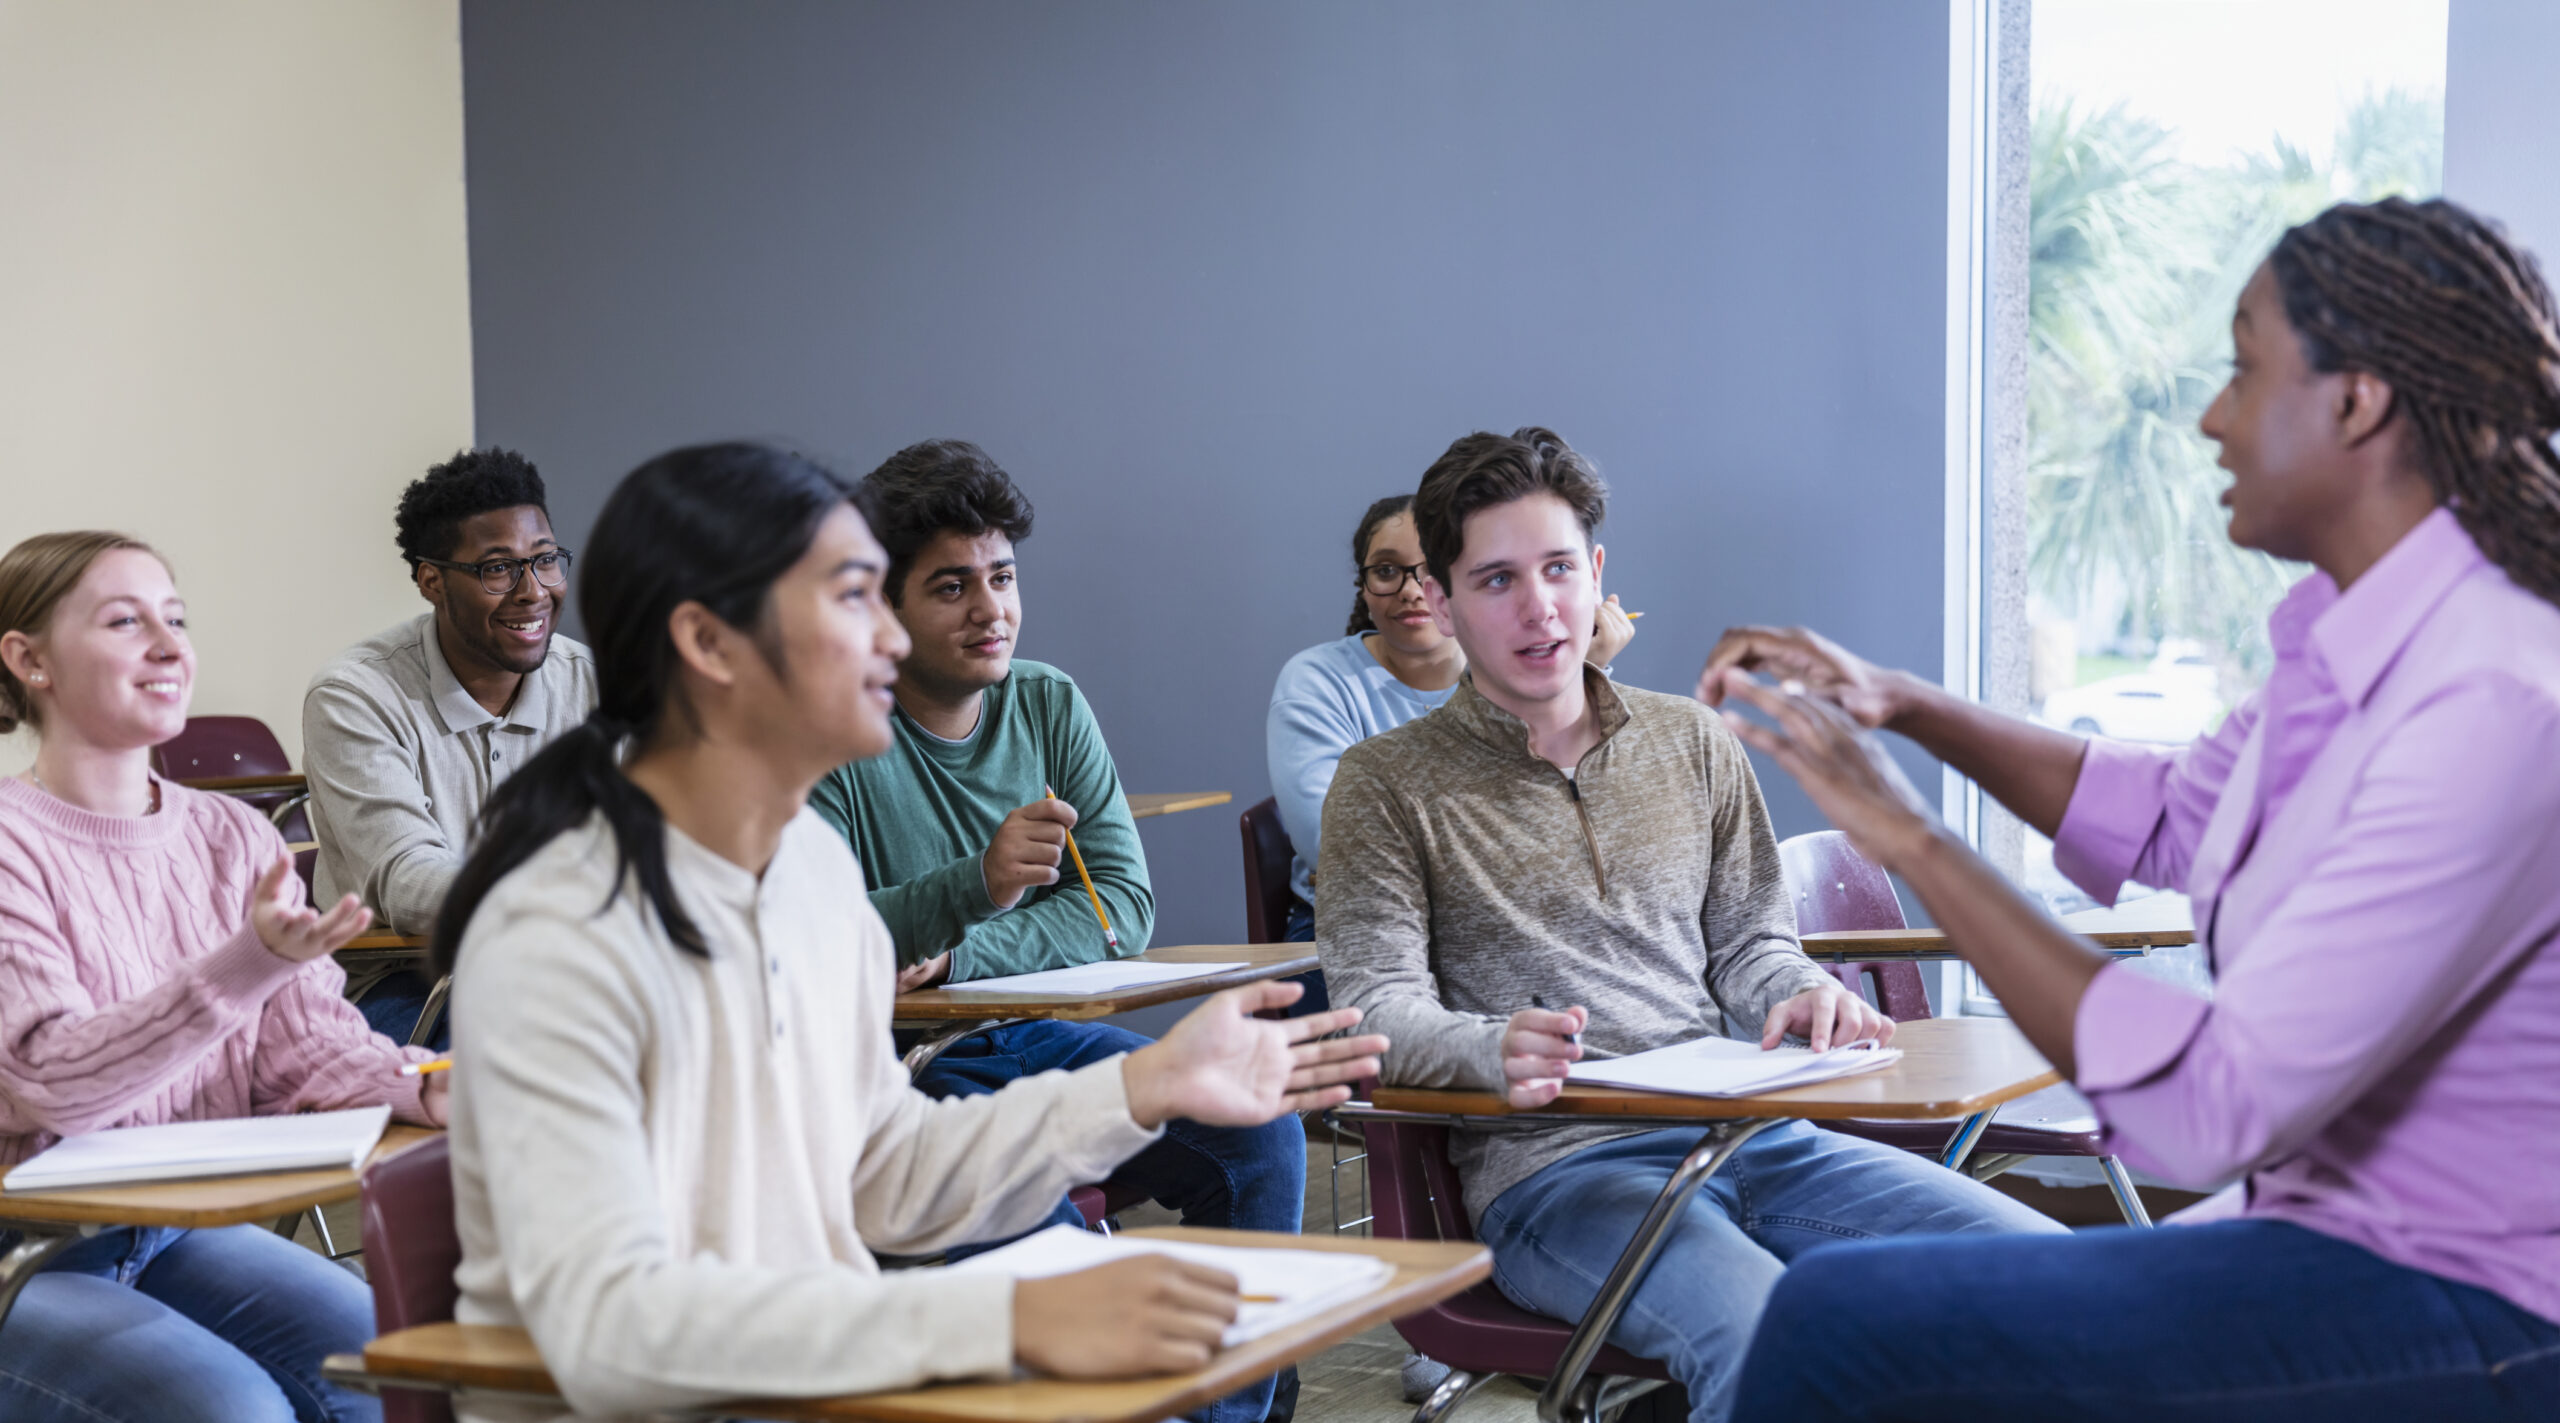


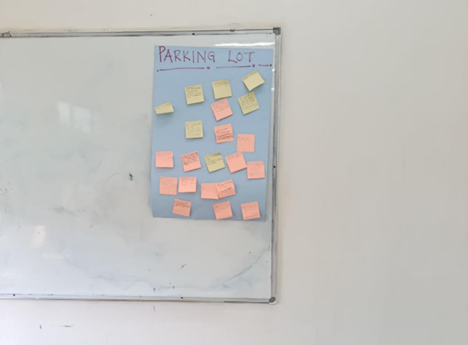