Too many universities overlook the richness of the human stories that define them, relying instead on polished marketing campaigns and generic social media content to attract the next generation of students.
Please login below to view content or subscribe now.
At first, the question seemed simple: “Why do we go to school?”
I had asked it many times before, in many different districts. I’m a planner and designer specializing in K-12 school projects, and as part of a community-driven design process, we invite students to dream with us and help shape the spaces where they’ll learn, grow, and make sense of the world.
In February of 2023, I was leading a visioning workshop with a group of middle schoolers in Southern California. Their energy was vibrant, their curiosity sharp. We began with a simple activity: Students answered a series of prompts, each one building on the last.
“We go to school because …”
“We need to learn because …”
“We want to be successful because …”
As the conversation deepened, so did their responses. One student wrote, “We want to get further in life.” Another added, “We need to help our families.” And then came the line that stopped me in my tracks: “We go to school because we want future generations to look up to us.”
I’ve worked with a lot of middle schoolers. They’re funny, unfiltered, and often far more insightful than adults give them credit for. But this answer felt different. It wasn’t about homework, or college, or even a dream job. It was about legacy. At that moment, I realized I wasn’t just asking kids to talk about school. I was asking them to articulate their hopes for the world and their role in shaping it.
As a designer, I came prepared to talk about flexible furniture, natural light, and outdoor learning spaces. The students approached the conversation through the lens of purpose, identity, and intergenerational impact. They reminded me that school isn’t just a place to pass through — it’s a place to imagine who you might become and how you might leave the world better than you found it.
I’ve now led dozens of school visioning sessions, no two being alike. In most cases, adults are the ones at the table: district leaders, architects, engineers, and community members. Their perspectives are important, of course. But when we exclude students from shaping the environments they spend most days in, we send an implicit message that this place is not really theirs to shape.
However, when we do invite them in, the difference is immediate. Students are not only willing participants, they’re often the most honest and imaginative contributors in the room. They see past the buzzwords like 21st-century learning, flexible furniture, student-centered design, and collaborative zones, and talk about what actually matters: where they feel safe, where they feel seen, where they can be themselves.
During that workshop when the student spoke about legacy, other young participants asked for more flexible learning spaces, places to move around and collaborate, better food, outdoor classrooms, and quiet areas for mental health breaks. One asked for sign language classes to better communicate with her hard-of-hearing best friend. Another asked for furniture that can move from inside to outside. These aren’t requests that tend to show up on state-issued planning checklists, which are more likely to focus on square footage, capacity, and code compliance, but they reflect an extraordinary level of thought about access, well-being, and inclusion.
The lesson: When we take students seriously, we get more than better design. We get better schools.
There’s a popular saying in architecture: Form follows function. But in school design, I’d argue that form should follow voice. If we want to build learning environments that support joy, connection, and growth, we need to start by asking students what those things look and feel like to them — and then believe them.
Listening isn’t a checkbox. It’s a practice. And it has to start early, not once construction drawings are finalized, but when goals and priorities are still being devised. That’s when student input can shift the direction of a plan, not just decorate it.
It’s also not just about asking the right questions, but being open to answers we didn’t expect. When a student says, “Why do the adults always get the rooms with windows?” — as one did in another workshop I led — that’s not a complaint. That’s a lesson in power dynamics, spatial equity, and the unspoken messages our buildings send.
Since that day, about a year and a half ago, when I heard, “We want future generations to look up to us,” I’ve carried that line with me into every planning session. It’s a reminder that students aren’t just users of school space. They’re stewards of something bigger than themselves.
So if you’re a school leader, a planner, a teacher, or a policymaker, invite students in early. Make space for their voices, not just as a formality but as a source of wisdom. Ask questions that go beyond what color the walls should be. And don’t be surprised when the answers you get are deeper than you imagined. Be willing to let their vision shift yours.
Because when we design with students, not just for them, we create schools that don’t just house learning. We create schools that help define what learning is for. And if we do it right, maybe one day, future generations will look up to today’s students not just because of what they learned, but because of the spaces they helped shape.
Chalkbeat is a nonprofit news site covering educational change in public schools.
For more news on district and school management, visit eSN’s Educational Leadership hub.
Enrico Giori, Chalkbeat
Enrico Giori is a California-based planner and designer at Architecture for Education, or A4E, specializing in K-12 educational facilities. He focuses on agency-driven school design that promotes equitable and future-thinking learning environments.
Latest posts by eSchool Media Contributors (see all)
T Caleb Jayden Wilson he parents of Caleb Jayden Wilson have filed a comprehensive civil lawsuit seeking accountability from multiple parties they allege are responsible for their son’s death following a fraternity hazing incident at Southern University.
Urania Brown Wilson and Corey Wilson, Sr., filed the wrongful death and survival damages petition Friday in the 19th Judicial District Court in East Baton Rouge Parish, seven months after losing their 20-year-old son. The junior mechanical engineering student and member of Southern’s renowned “Human Jukebox” marching band died in February following what authorities describe as a brutal hazing ritual.
The lawsuit casts a wide net of accountability, naming as defendants Omega Psi Phi Fraternity Inc., its local Beta Sigma and Lambda Alpha chapters, the State of Louisiana through the Board of Supervisors of Southern University and A&M College, and 12 individual fraternity members.
Among the individual defendants are Caleb M. McCray, Kyle M. Thurman, and Isaiah E. Smith—all previously arrested by Baton Rouge police in connection with Wilson’s death. McCray faces the most serious charges, including manslaughter and felony criminal hazing.
The petition alleges multiple levels of negligence, from gross misconduct by individuals to institutional failures by the university and fraternity organizations. According to the filing, Wilson died as a direct result of being repeatedly punched in the chest during an unsanctioned, off-campus ritual at a local warehouse on February 27.
The lawsuit particularly criticizes the response following Wilson’s collapse, alleging that fraternity members delayed calling emergency services and instead transported him to a local hospital where they provided false information about his injuries before abandoning him.
Following an internal investigation that found the Beta Sigma chapter violated the student code of conduct, Southern University expelled the chapter and implemented a temporary moratorium on new member intake activities for all Greek organizations.
The civil action seeks to leverage Louisiana’s strengthened anti-hazing laws, including the Max Gruver Act, which criminalized certain forms of hazing following another high-profile fraternity death. The legislation was named after Louisiana State University student Maxwell Gruver, who died in a 2017 fraternity hazing incident.
The case highlights ongoing concerns about hazing culture in higher education and the challenges institutions face in monitoring and preventing dangerous initiation practices, particularly those occurring off-campus and outside official oversight.
Students from the class of 2024 had historically low scores on a major national test administered just months before they graduated.
Results from the National Assessment of Educational Progress, or NAEP, released September 9, show scores for 12th graders declined in math and reading for all but the highest performing students, as well as widening gaps between high and low performers in math. More than half of these students reported being accepted into a four-year college, but the test results indicate that many of them are not academically prepared for college, officials said.
“This means these students are taking their next steps in life with fewer skills and less knowledge in core academics than their predecessors a decade ago, and this is happening at a time when rapid advancements in technology and society demand more of future workers and citizens, not less,” said Lesley Muldoon, executive director of the National Assessment Governing Board. “We have seen progress before on NAEP, including greater percentages of students meeting the NAEP proficient level. We cannot lose sight of what is possible when we use valuable data like NAEP to drive change and improve learning in U.S. schools.”
In a statement, Education Secretary Linda McMahon said the results show that federal involvement has not improved education, and that states should take more control.
“If America is going to remain globally competitive, students must be able to read proficiently, think critically, and graduate equipped to solve complex problems,” she said. “We owe it to them to do better.”
The students who took this test were in eighth grade in March of 2020 and experienced a highly disrupted freshman year of high school because of the pandemic. Those who went to college would now be entering their sophomore year.
Roughly 19,300 students took the math test and 24,300 students took the reading test between January and March of 2024.
The math test measures students’ knowledge in four areas: number properties and operations; measurement and geometry; data analysis, statistics, and probability; and algebra. The average score was the lowest it has been since 2005, and 45% of students scored below the NAEP Basic level, even as fewer students scored at NAEP Proficient or above.
NAEP Proficient typically represents a higher bar than grade-level proficiency as measured on state- and district-level standardized tests. A student scoring in the proficient range might be able to pick the correct algebraic formula for a particular scenario or solve a two-dimensional geometric problem. A student scoring at the basic level likely would be able to determine probability from a simple table or find the population of an area when given the population density.
Only students in the 90th percentile — the highest achieving students — didn’t see a decline, and the gap between high- and low-performing students in math was higher than on all previous assessments.
This gap between high and low performers appeared before the pandemic, but has widened in most grade levels and subject areas since. The causes are not entirely clear but might reflect changes in how schools approach teaching as well as challenges outside the classroom.
Testing officials estimate that 33% of students from the class of 2024 were ready for college-level math, down from 37% in 2019, even as more students said they intended to go to college.
In reading, students similarly posted lower average scores than on any previous assessment, with only the highest performing students not seeing a decline.
The reading test measures students’ comprehension of both literary and informational texts and requires students to interpret texts and demonstrate critical thinking skills, as well as understand the plain meaning of the words.
A student scoring at the basic level likely would understand the purpose of a persuasive essay, for example, or the reaction of a potential audience, while a students scoring at the proficient level would be able to describe why the author made certain rhetorical choices.
Roughly 32% of students scored below NAEP Basic, 12 percentage points higher than students in 1992, while fewer students scored above NAEP Proficient. An estimated 35% of students were ready for college-level work, down from 37% in 2019.
In a survey attached to the test, students in 2024 were more likely to report having missed three or more days of school in the previous month than their counterparts in 2019. Students who miss more school typically score lower on NAEP and other tests. Higher performing students were more likely to say they missed no days of school in the previous month.
Students in 2024 were less likely to report taking pre-calculus, though the rates of students taking both calculus and algebra II were similar in 2019 and 2024. Students reported less confidence in their math abilities than their 2019 counterparts, though students in 2024 were actually less likely to say they didn’t enjoy math.
Students also reported lower confidence in their reading abilities. At the same time, higher percentages of students than in 2024 reported that their teachers asked them to do more sophisticated tasks, such as identifying evidence in a piece of persuasive writing, and fewer students reported a low interest in reading.
Chalkbeat is a nonprofit news site covering educational change in public schools.
When translating international research on strangulation during sex specifically, an estimated 1.2-1.6 million students across UK higher education institutions will have had this experience.
Content warning: strangulation, choking, sexual violence, suicide, homicide
Strangulation is not widely discussed in UK university settings, but it should be, and universities can be very well-placed to respond to this topic across many different contexts.
With a new academic year beginning, particularly in the context of the Office for Students’ harassment and sexual misconduct new regulation and prevalence data, now is the time to consider the best approach to strangulation for new and existing cohorts of students.
What is strangulation?
Strangulation – or “choking” as it is sometimes called in the context of sex – is the application of external pressure to the neck, which results in the restriction of air and/or blood flow, through obstruction of the windpipe and/or major blood vessels.
Whilst ‘choking’ is sometimes a term that is sometimes used interchangeably, this term is more technically applied to an internal obstruction in the throat which restricts breathing (e.g. choking on a piece of food).
The Institute for Addressing Strangulation (IFAS) was established in October 2022, following the introduction of new legislation, presenting strangulation as a stand-alone offence in England and Wales.
There is not yet research specifically on the prevalence of strangulation during violence and abuse in universities in the UK. This in itself is a risk to an effective response. However, from research we do have available, we can see how students could be affected by strangulation.
In the context of sexual violence, research from a Sexual Assault Referral Centre in England showed that around a fifth of victim/survivors of sexual assault and rape by a current or ex-partner had been strangled at the time of the assault. A higher proportion of victim/survivors who were strangled were “In education”, compared to those who weren’t strangled (12 per cent compared with 9 per cent).
For those in domestic abuse relationships, there is an increased risk to the victim/survivor once they have been strangled. Research has shown that there is a seven-fold increased risk of the victim being killed by the perpetrator when non-fatal strangulation is in the abuse history.
From April 2022 – March 2023, the Vulnerability Knowledge and Practice Programme (VKPP) showed that 10 per cent of suspected victim suicides following domestic abuse (SVSDA) related to victims aged 16-24. Of all the SVSDA cases in the same year, the VKPP reported that non-fatal strangulation was noted in the abuse histories of 20 per cent of cases.
The risks of an act of strangulation on its own can include loss of consciousness (possibly indicating acquired brain injury), stroke, seizures, motor and speech disorders, and death.
If universities have an awareness of the abuse and violence their students are subjected to, is the knowledge around strangulation a missing piece of a bigger puzzle?
Strangulation during sex
Strangulation or “choking” during sex is disproportionately prevalent amongst younger age groups.
A survey conducted by us at IFAS late last year showed that 35 per cent of respondents aged 16-34 had been strangled during sex by a partner at least once. This was sex they had entered into willingly, but the strangulation was not always with prior agreement from all parties.
Of the respondents who had previously been strangled during sex, only 50 per cent reported to us that this strangulation was always agreed in advance.
When looking at university populations internationally, the prevalence of engaging in strangulation during sex appears to be higher than in the general population sample referenced above. In the United States, it has been reported that 42 per cent of undergraduates have been strangled during sex and 37 per cent have reported strangling someone else – in Australia, 56 per cent of students had an experience of having been strangled and 51% had done this to a partner.
Researchers in the United States have also looked specifically at the risks of strangulation during sex. They found that individuals who had frequent experience of partnered strangulation had heightened levels of a blood biomarker that indicates inflammation within the brain and cell death.
Even when used during sex, research consistently shows that there is no safe way to strangle. This is beginning to be better recognised, including with action by the government to criminalise the depiction of strangulation in pornography.
What should higher education institutions be doing
Strangulation may be missing in universities’ broader responses to sexual misconduct, domestic abuse, and sex and relationships education. Whilst not applicable to all institutions, the principles outlined in the swiftly upcoming Office for Students Condition of Registration (E6) may serve as a useful framework in which to integrate this topic.
Non-judgemental engagement around strangulation is vital. Students who are thinking about or who are engaging in strangulation during sex should feel able to discuss this with trusted staff who can provide helpful and objective information.
Students who have been strangled in other settings – for instance, in domestic abuse or sexual violence – also require opportunities to disclose and seek specialist support. Integrating responses to strangulation under the appropriate support requirements of E6 could be suitable, particularly when disclosed as part of abuse or misconduct.
It is necessary that questions are asked of students in relevant contexts such as sexual misconduct support services, given that spontaneous disclosure may be rare. It is important to remember the range of terminology that could be used to describe the same act, particularly across different contexts.
Staff should be confident they are talking with students in a way all parties can understand and from which appropriate action can be taken.
As would be the common practice for other disclosures such as domestic abuse, limits to confidentiality and escalation procedures should also be appropriately discussed and understood by all.
In E6, the Office for Students notes the importance of capturing data on behaviours in order to inform both prevention and response initiatives. Including strangulation as a specific variable to consider within this data capture process would be valuable for universities. The more staff know about strangulation in different contexts, the better and more specialist the response can be. If questions are not asked about strangulation, and opportunities for disclosure are limited, prevalence data are unknown.
The higher education sector has long been an advocate for evidence-based practice, and sexual misconduct has been a recent example of where understanding the issue has led to more concerted efforts to address these unacceptable behaviours (see e.g. the Office for Students’ pilot sexual misconduct survey).
Staff should collate data on strangulation disclosures and reports (for example, through disciplinary proceedings), and be able to monitor and report on these data independently and in the context of other behaviours such as sexual misconduct. Where possible, it would be beneficial to consider how strangulation is captured on disclosure tools, reporting forms, risk assessment templates, and case management systems. Staff should consider how their university’s strangulation data form part of reporting through existing governance structures.
Strangulation is still an emerging – and can be taboo – topic of conversation which means relatively little is known and shared. Myths and misconceptions thrive in these environments which can lead to victim blaming and poor outcomes for those involved. Education for whole institutions on what is known objectively about this behaviour in different contexts is needed.
This education can come in the form of, for example, training for staff and students around sexual misconduct and other forms of abuse and harassment – particularly when discussing consent and the requirement for prior and informed consent for all sexual behaviours. As universities have been reviewing their training provision to align with, and hopefully go beyond, the requirements of E6, this seems like a suitable framework for the appropriate inclusion of this topic.
Individual conversations with students and staff seeking support are also good opportunities to share information and resources for further support. Staff in specialist roles such as student support workers, and disciplinary investigators and panel members may benefit from more specialist training interventions in order to feel confident and competent to support the education of others.
The topic of strangulation is a nuanced one, not least because of the varied contexts in which it may be occurring. It therefore requires a careful approach by universities, but this is not an insurmountable task. We would encourage institutions to follow the trajectories they should already be taking to address harassment and sexual misconduct and apply appropriate learning to this important topic.
Please visit the IFAS website for more information.
One of the great promises of higher education is that it acts as a social ladder—one that allows students from low-income backgrounds to climb up and reach a higher social and economic status. No one, I think, ever believed it was a guaranteed social leveler, or that children from wealthier families didn’t have an easier time succeeding after college because of their own, and their family’s, social and cultural capital. But most people, in America at least, believed that on the whole it played a positive role in increasing social mobility.
Over the past couple of decades, though, particularly as student debt has increased, people have begun to wonder if this story about social mobility through college is actually true. That’s a hard question to answer definitively. Data sets that track both student origins and outcomes are few and far between, and it’s also difficult to work out what social mobility used to look like in a quantifiable sense.
However, this summer economist Sarah Quincy of Vanderbilt University and Zach Bleemer of Princeton University released a paper called Changes in the College Mobility Pipeline Since 1900. This paper overcame some of those data limitations and took a long, more than century-long, look at the relationship between social mobility and college attendance.
What they found was sobering. Not only is higher education no longer helping poor students catch up with wealthier ones, but in fact the sector’s role as a social elevator actually stopped working almost 80 years ago. This seemed like a perfect story for the podcast, and so we invited Zach Bleemer—who you may remember from an episode on race-conscious admissions about two years ago—to join us to discuss it.
This discussion ranges from the methodological to the expositional. Where does the data come from? What does the data really mean? And are there alternative explanations for the paper’s surprising findings? But enough from me—let’s hear from Zach.
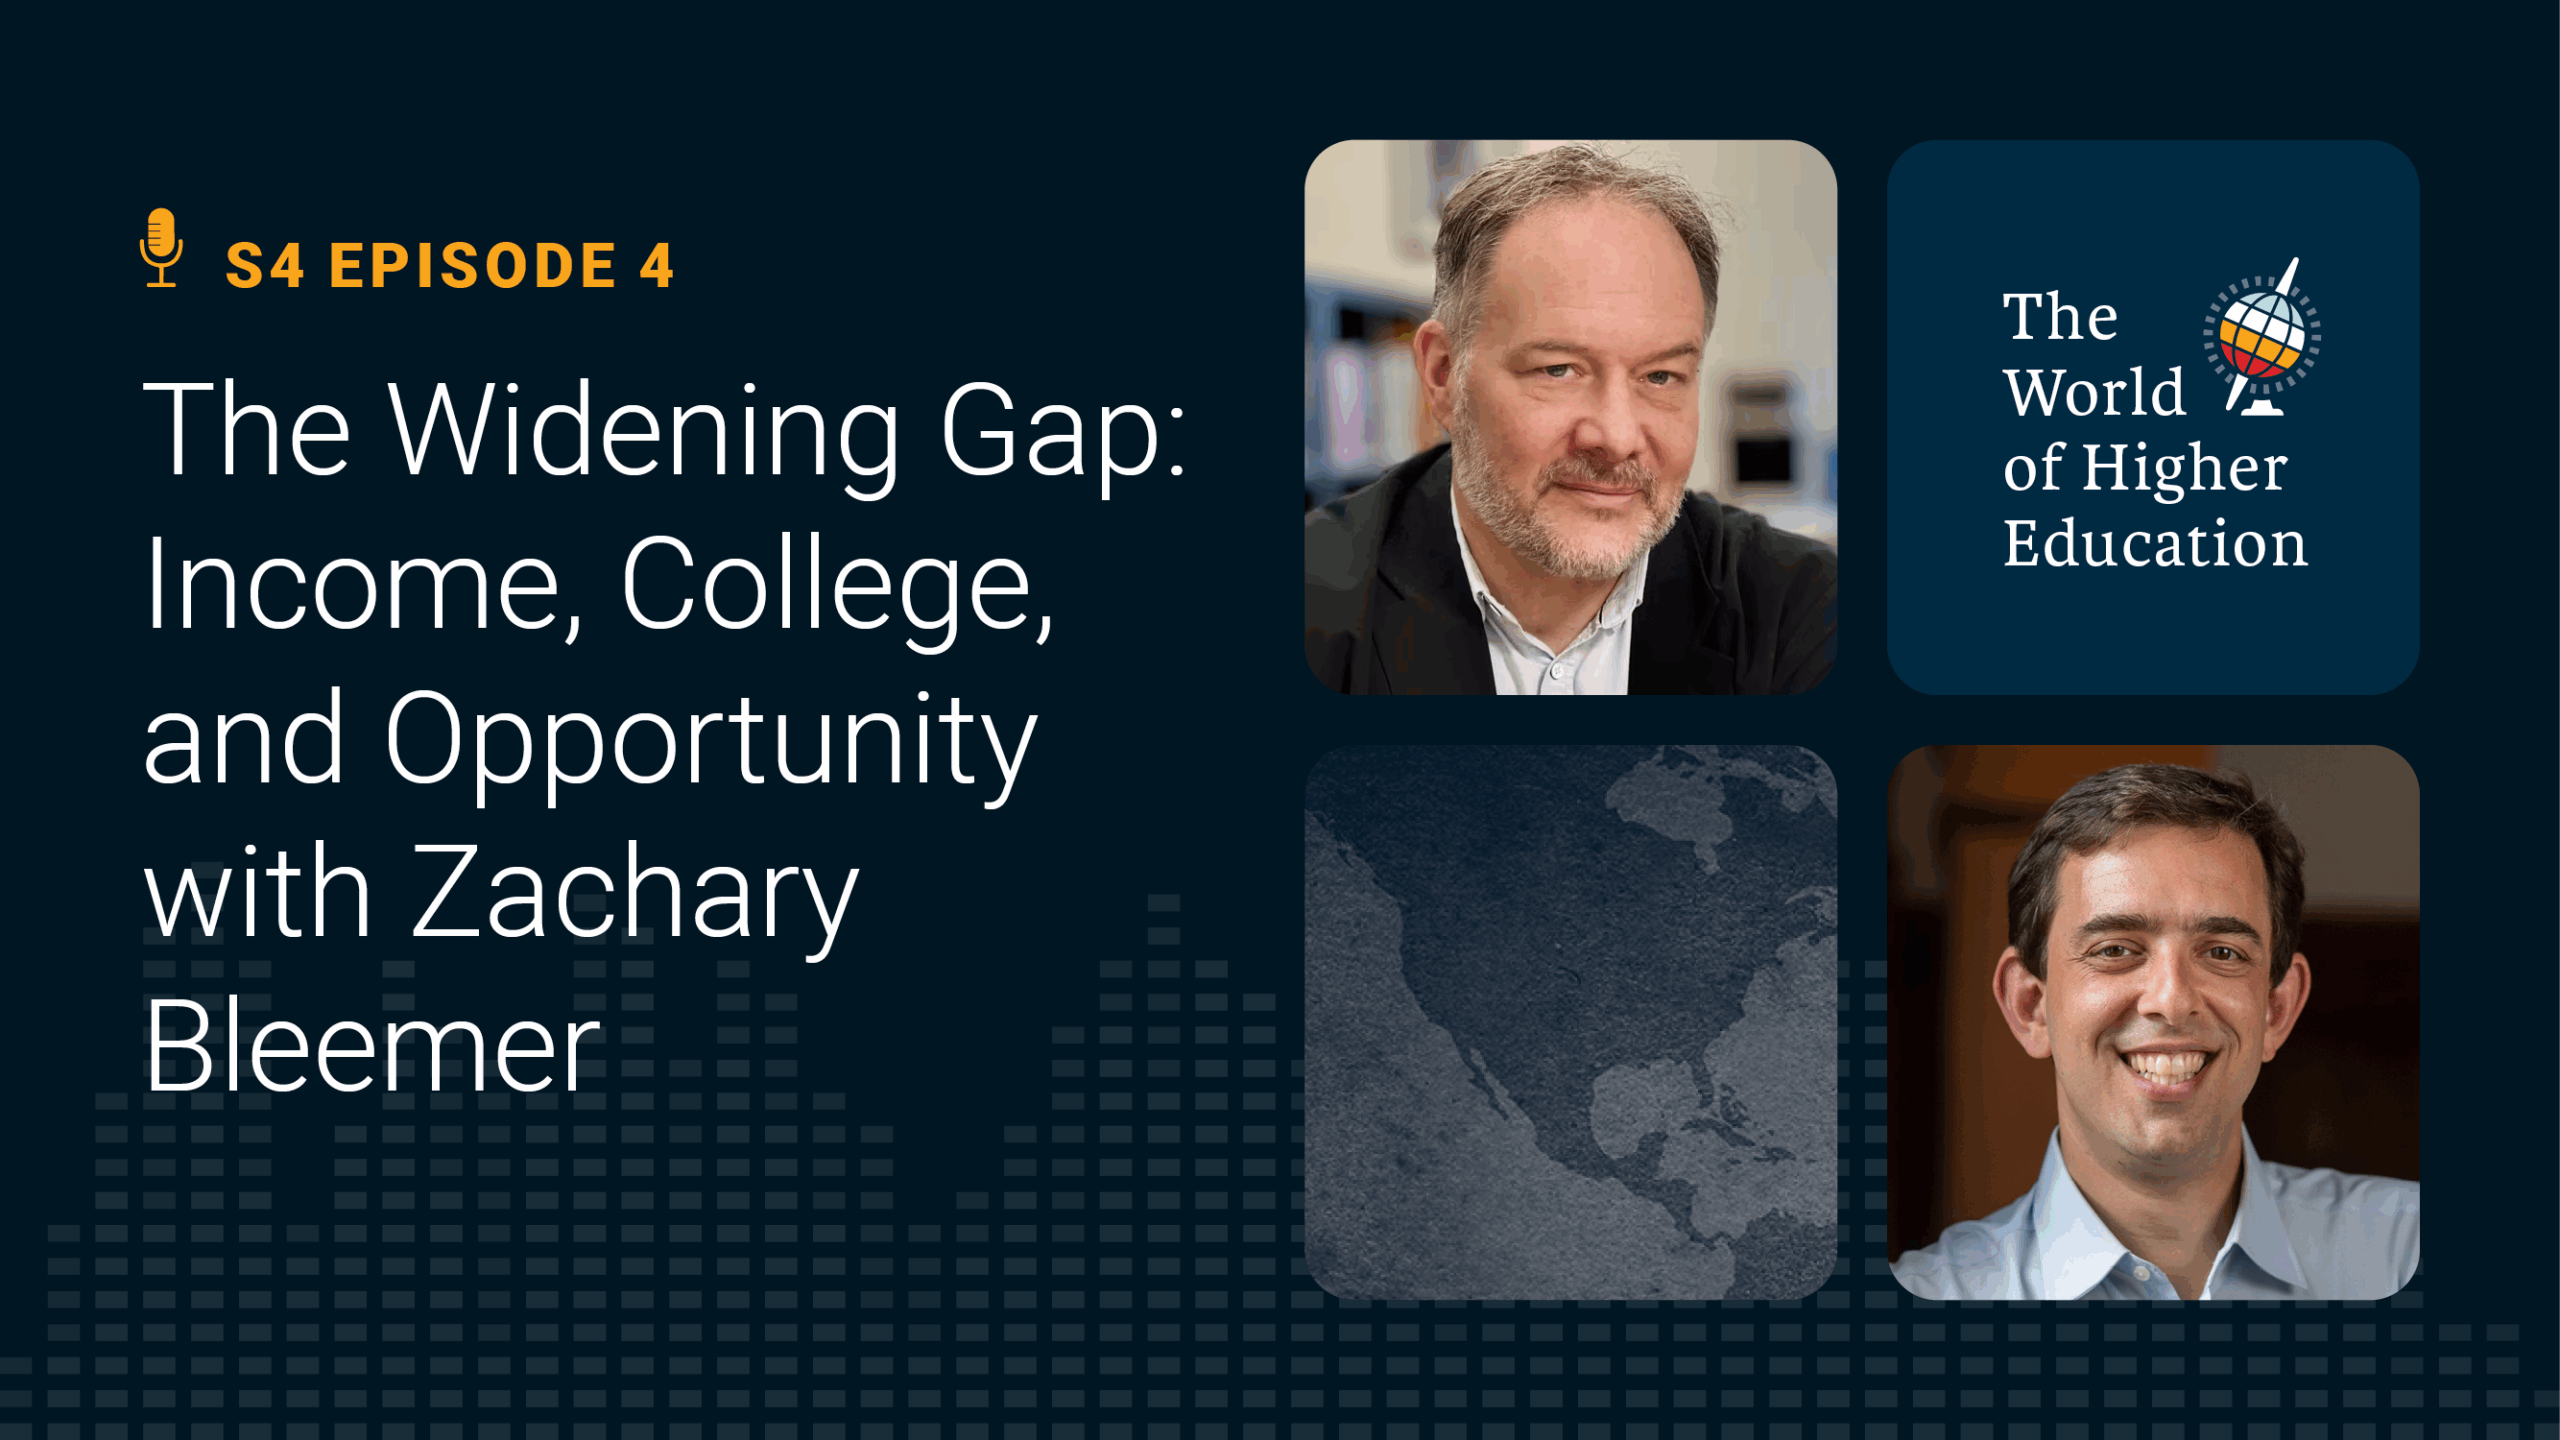
The World of Higher Education Podcast Episode 4.4 | The Widening Gap: Income, College, and Opportunity with Zachary Bleemer
Transcript
Alex Usher (AU): Zach, you wrote, with Sarah Quincy, a paper called Changes in the College Mobility Pipeline Since 1900, which looks a long way back. And you argue that the relative premium received by lower-income Americans from higher education has fallen by half since 1960. Take us through what you found—give us the 90-second elevator pitch.
Zachary Bleemer (ZB): Consider kids who were born in 1900 and were choosing whether or not to go to college in the late 1910s and early 1920s. What we were interested in was that choice, and in particular, following people for the next 20 years after they made it. Some people graduated high school but didn’t go to college, while others graduated high school and chose to go.
We wanted to compare the differences in early 1930s wages between those two groups—both for kids from lower-income backgrounds and kids from upper-income backgrounds. Now, you might be surprised to learn that there were lower-income kids going to college in the U.S. in the early 1920s, but there were. About 5 to 10% of people from the bottom parental income tercile even then were attending college.
What we found, when we linked together historical U.S. census records and followed kids forward, is that whether you were low-income or high-income, if you went to college your wages went up a lot. And the degree to which your wages went up was independent of whether you were low-income or high-income—everyone benefited similarly from going to college.
If you compare that to kids born in the 1980s, who were choosing to go to college in the late 1990s and early 2000s, you see a very different story. Everyone still gains from going to college, but kids from rich backgrounds gain a lot more—more than twice as much as kids from poor backgrounds. And that’s despite the fact they’re making the same choice. They’re going to different universities and studying different things, but when it comes down to the 18-year-old making a decision, those from poor families are just getting less from American higher education now than they did in the past—or compared to kids from rich backgrounds.
AU: I want to make sure I understand this, because it’s a crucial part of your argument. When you talk about relative premiums—premium compared to what, and relative compared to what?
ZB: What we always have in mind is the value of college for rich kids, and then asking: how much of that value do poor kids get too? In the early 20th century, and as late as the 1960s, those values were very similar. Lower-income kids were getting somewhere between 80 and 100% of the value of going to college as higher-income kids.
AU: And by “value,” you mean…
ZB: That just means how much your wages go up. So, the wage bump for lower-income kids was very similar to that of higher-income kids. Today, though, it’s more like half—or even a little less than half—of the economic value of college-going that lower-income kids receive compared to higher-income kids.
AU: So in effect, higher education is acting as an engine of greater inequality. That’s what you’re saying?
ZB: I guess it’s worth saying that lower-income kids who go to college are still getting ahead. But it’s not as much of a pipeline as it used to be. Higher education used to accelerate lower-income kids—not to the same level of income as their higher-income peers; they were never going to catch up—but at least they got the same bump, just from a lower starting point.
AU: So the gap widens now. But how do you make a claim like that over 120 years? I mean, I sometimes have a hard time getting data for just one year. How do you track college premiums across a period of 120 years? How sound is the empirical basis for this? You mentioned something about linking data to census records, which obviously go back quite a way. So tell us how you constructed the data for this.
ZB: The first-order answer is that I called up and worked with an economic historian who had much more experience with historical data than I did. Like you said, it’s hard in any period to get high-quality data that links students in high school—especially with information on their parental income—to wage outcomes 10 or 15 years later.
What we did was scan around for any academic or government group over the last 120 years that had conducted a retrospective or longitudinal survey—where you either follow kids for a while, or you find a bunch of 30-year-olds and ask them questions about their childhood. We combined all of these surveys into a comprehensive database.
In the early 20th century, that meant linking kids in the 1920 census, when they were still living with their parents, to the same kids in the 1940 census, when they were in their early thirties and working in the labor market. That link has been well established by economic historians and used in a large series of papers.
By the middle of the 20th century, sociologists were conducting very large-scale longitudinal surveys. The biggest of these was called Project Talent, put together by the American Institutes for Research in 1961. They randomly sampled over 400,000 American high school students, collected a ton of information, and then re-surveyed them between 1971 and 1974 to ask what had happened in their lives.
In more recent years, there’s been a large set of governmental surveys, primarily conducted by the Departments of Labor and Education. Some of these will be familiar to education researchers—like the National Longitudinal Survey of Youth (NLSY). Others are less well known, but there are lots of them. All we did was combine them all together.
AU: I noticed in one of the appendices you’ve got about nine or ten big surveys from across this period. I guess one methodological limitation is that they don’t all follow respondents for the same amount of time, and you’d also be limited to questions where the surveys provided relatively similar answers. You never get your dream data, but those would be the big limitations—you’ve got to look for the similarities, and that restricts you.
ZB: I’d add another restriction. You’re right that, as we filtered down which datasets we could use, the key variables we needed were: parental income when the student was in high school, level of education by age 30, and how much money they made at some point between ages 30 and 35. All of our surveys had those variables.
We also looked for information about what college they attended and what their college major was. Ideally, the surveys also included some kind of high school test—like the SAT or an IQ test—so we could see what kinds of students from what academic backgrounds were going to college.
But there was another key limitation. In most of the data before 1950, it was really difficult to get a direct measure of parental income. Instead, we usually had proxies like parental occupation, industry, or level of education—variables that are highly predictive of income, but not income itself.
So, a lot of the work of the paper was lining up these measures of varying quality from different surveys to make sure the results we report aren’t just noise from mismeasurement, but instead reflect real changes on the ground in American higher education.
AU: So you ran the data and noticed there was a sharp inflection point—or maybe not sharp, but certainly things started to get worse after 1960. When you first saw that, what were your hypotheses? At that point, you’ve got to start looking at whatever variables you can to explain it. What did you think the answer was, and what did you think the confounding variables might be?
ZB: My expectation was that two things would primarily explain the change. My background is in studying undergraduate admissions, so I thought the first explanation would be rising meritocracy in admissions. That might have made it harder for lower-income and lower-testing kids to get access to high-quality education. I also thought changes in affirmative action and in access to selective schools for kids from different backgrounds, along with rising tuition that made it harder for lower-income kids to afford those schools, could have played a big role. That was one possible story.
The second possible story is that it had nothing to do with the causal effect of college at all. Instead, maybe the poor kids who go to college today aren’t as academically strong as they were in the past. Perhaps in the past only the brilliant poor kids went to college, while all the rich kids went regardless of ability. So it could have looked like poor kids were getting a big benefit from college, when in fact those few who made it would have done well anyway.
It turns out neither of these explanations is the primary driver of rising regressivity. On the test score story, it’s always been the case that rich kids who go to college have relatively higher test scores than rich kids who just graduate high school—and that poor kids who go to college have relatively lower scores compared to their peers. That hasn’t changed since 1960.
And on the access story, it’s always been the case that rich kids dominate the schools we now think of as “good”—the fancy private universities and the flagship public universities. But over the last 50 years, poor kids have actually slightly increased their representation at those schools, not the other way around. Rising meritocracy hasn’t pushed poor kids out. If anything, the variety of admissions programs universities have implemented to boost enrollment among racial minority and lower-income students has relatively increased their numbers compared to 1950 or 1960.
AU: You were just making the case that this isn’t about compositional change in where poor students went. I heard you say there are more lower-income students at Harvard, Yale, and MIT than there were 50 or 60 years ago—and I have no doubt that’s true. But as a percentage of all poor students, surely that’s not true. The vast wave of lower-income students, often from minority backgrounds, are ending up in community colleges or non-flagship publics. Surely that has to be part of the story.
ZB: Yes. It turns out there are three primary trends that explain this rising collegiate regressivity, and you just hit on two of them.
The first is exactly your point: lower-income students primarily go to satellite public universities, basically all the non–R1 publics. Higher-income students, if they attend a public university, tend to go to the flagship, research-oriented universities.
I’ll skip talking about Harvard, Yale, and Princeton—almost no one goes to those schools, and they’re irrelevant to the overall landscape.
AU: Because they’re such a small piece of the pie, right?
ZB: Exactly. Fewer than 1% of students attend an Ivy Plus school. They don’t matter when we’re talking about American higher education as a whole. The flagships, though, matter a lot. About a third of all four-year college students go to a research-oriented flagship public university.
What’s happened since 1960 isn’t that poor kids lost access to those schools—it’s that they never really had access in the first place. Meanwhile, those schools have gotten much better over time. If you look at simple measures of university quality—student-to-faculty ratios, instructional expenditures per student, graduation rates—or even our own wage “value-added” measures (the degree to which each university boosts students’ wages), the gap between flagship and non-flagship publics has widened dramatically since the 1960s.
The flagships have pulled away. They’ve gotten more money—both from higher tuition and from huge federal subsidies, in part for research—and they’ve used that money to provide much more value to the students who attend. And those students tend to be higher income.
The second trend is what you mentioned: increasing diversion to community colleges. Interestingly, before 1980, community colleges were already well established in the U.S. and enrolled only slightly more lower-income than higher-income students. They actually enrolled a lot of high-income students, and the gap was small. Since the 1980s, though, that gap has grown substantially. There’s been a huge diversion of lower-income students toward community colleges—and those schools just provide lower-value education to the students who enroll.
AU: At some level this is a sorting story, right? You see that in discussions about American economic geography—that people sort themselves into certain areas. Is that what you’re saying is happening here too?
ZB: It’s not about sorting inside the four-year sector. It’s about sorting between the two- and four-year sectors. And on top of that, we think there’s fundamentally a story about American state governments choosing to invest much more heavily in their flagship publics—turning them into gem schools, amazing schools—while leaving the other universities in their states behind. Those flagships enroll far more higher-income than lower-income students.
AU: When I was reading this paper, one thing that struck me was how hard it is to read about American higher education without also reading something about race. The last time you were on, we were talking about SCOTUS and the Fair Harvard decision. But as far as I can tell, this paper doesn’t talk about race. I assume that goes back to our earlier discussion about data limitations—that race just wasn’t captured at some point. What’s the story there?
ZB: No—we observe race throughout this entire period. In fact, you could basically rewrite our study and ask: how has the relative value of college for white kids compared to Black kids changed over the last hundred years? I suspect you’d see very similar patterns.
The datasets we’re working with observe both parental income and race, but they aren’t large enough to separately analyze, for example, just white students and then compare lower- and higher-income groups over time. There’s a sense in which you could tell our story in terms of race, or you could tell it in terms of class—and both would be right. At a first-order level, both are happening. And within racial groups, the evidence we’ve been able to collect suggests that class gaps have substantially widened over time.
Similarly, we show some evidence that even within the lower-income group there are substantial gaps between white and Black students. So in part, I saw this as an interesting complement to the work I’d already done on race. It points out that while race is part of the story, you can also reframe the entire conversation in terms of America’s higher education system leaving lower-income students behind—irrespective of race.
AU: Right, because it strikes me that 1960 is only six years after Brown v. Board of Education. By the early to mid-1960s, you’d start to see a bigger push of Black students entering higher education, becoming a larger share of the lower-income sector. And a few years later, the same thing with Latino students.
Suddenly lower-income students are not only starting from further behind, but also increasingly made up of groups who, irrespective of education, face discrimination in the labor market. Wouldn’t that pull things down? Wouldn’t that be part of the explanation?
ZB: Keep in mind that when we measure wage premiums, we’re always comparing people who went to college with people who only finished high school. So there are Black students on both sides of that comparison, across both lower- and higher-income groups.
That said, I think your point is well taken. We don’t do any work in the paper specifically looking at changes in the racial composition of students by parental income over this period. One thing we do show is that the test scores of lower-income students who go to college aren’t falling over time. But you’re probably right: while racial discrimination affects both college-goers and non-college-goers, it’s entirely plausible that part of what we’re picking up here is the changing racial dynamics in college-going.
AU: What’s the range of policy solutions we can imagine here, other than, you know, taking money away from rich publics and giving it to community colleges? That’s the obvious one to me, but maybe there are others.
ZB: And not just community colleges—satellite publics as well. I’ve spent the last five years of my life thinking about how to get more disadvantaged students into highly selective universities, and what happens when they get there. The main takeaway from that research is that it’s really hard to get lower-income students into highly selective universities. It’s also expensive, because of the financial aid required.
But once they get into those schools, they tend not only to benefit in terms of long-run wage outcomes, they actually derive disproportionate value. Highly selective schools are more valuable for lower-income kids than for the higher-income kids who typically enroll there.
What I’ve learned from this project, though, is that the closing of higher education’s mobility pipeline isn’t fundamentally about access. It’s about investments—by state governments, by students, by donors, by all the people and organizations that fund higher education. Over time, that funding has become increasingly centralized in schools that enroll a lot of wealthy students.
So, the point you brought up—redirecting funds—is important. In California they call it “rebenching”: siphoning money away from high-funded schools and pushing it toward low-funded schools. There’s very little academic research on what happens when you do that, but our study suggests that this century-long trend of unequal investment has disadvantaged low-income students. Potentially moving in the other direction could make a real difference for them.
AU: Zach, thanks so much for being with us today.
ZB: My pleasure.
AU: It just remains for me to thank our excellent producers, Tiffany MacLennan and Sam Pufek, and you, our listeners and readers, for joining us. If you have any questions or comments about today’s podcast, or suggestions for future editions, don’t hesitate to get in touch at [email protected].
Join us next week when our guest will be Dmitry Dubrovsky, a research scholar and lecturer at Charles University in Prague. He’ll be talking to us about the slow-motion collapse of Russian higher education under Vladimir Putin. Bye for now.
*This podcast transcript was generated using an AI transcription service with limited editing. Please forgive any errors made through this service.Please note, the views and opinions expressed in each episode are those of the individual contributors, and do not necessarily reflect those of the podcast host and team, or our sponsors.
The problem with findings like “1.5 per cent of students said they were in intimate relationships with staff” is the danger of extrapolation.
It’s in the results of the Office for Students (OfS) first sector-wide sexual misconduct survey – covering final year undergraduates in England who chose to take part in a clearly labelled bolt-on to the National Student Survey (NSS) earlier this year, with a response rate of just 12.1 per cent.
But 1.5 per cent of final-year undergraduates at English providers reporting “intimate” staff-student relationships in the past 12 months still feels like a lot – especially when half involved staff members who were engaged in the student’s education and/or assessment.
One in four respondents (24.5 per cent) said they’ve experienced sexual harassment since starting university, and 14.1 per cent declare experiencing sexual assault or violence.
Most incidents involved fellow students – with 58.4 per cent of harassment cases and 44.1 per cent of assault cases (taking place off-campus) involving someone connected to the victim’s institution.
OfS has published a dashboard of the results, an analysis report, a guide for students and a press release where the bullets slightly are less careful about extrapolation than I’ve been above. Another report to come later will provide more detailed analysis, including results for different combinations of characteristics and findings by academic subject.
The exercise represents OfS’ first real attempt to gather national prevalence data on sexual misconduct affecting students, having initially promised to do so back in 2022 in the context of its new Condition E6. That requires providers to take “multiple steps which could make a significant and credible difference in protecting students”.
The survey covered three main areas – sexual harassment experiences, sexual assault and violence, and intimate staff-student relationships. Questions also included detailed behavioural descriptions to ensure accurate prevalence measurement.
As such, the approach built on a 2023 pilot study involving volunteer providers. Since then, OfS has shortened the questionnaire whilst maintaining its core elements, leveraging NSS infrastructure to achieve national scale coverage – although for now, none of the devolved nations have taken part.
It’s worth noting that response patterns showed quite a bit of variation between demographic groups. Students with disabilities, female students, and LGB+ students were both more likely to respond and more likely to report misconduct – creating some quite complex interpretation challenges for understanding true prevalence rates.
Prevalence patterns and vulnerable groups
That set aside, the results show consistent vulnerability patterns across both harassment and assault. Female student respondents reported harassment rates of 33 per cent compared to significantly lower rates among males. Student respondents with disabilities experienced harassment at 34.7 per cent and assault at 22.1 per cent – higher than those without disabilities.
Sexual orientation showed significant differences. Lesbian, gay and bisexual respondents reported harassment rates of 46.6 per cent and assault rates of 29.8 per cent, nearly double the overall population rates. Those identifying as having “other sexual orientation” also showed elevated rates – at 40.1 per cent for harassment and 23.3 per cent for assault.
Age was also a key factor, with those under 21 at course start showing higher vulnerability rates – 31.2 per cent experienced harassment and 18.2 per cent experienced assault.
In terms of behaviours, the survey found “making sexually suggestive looks or staring at your body” affected 16.7 per cent of all respondents – the most common individual harassment behaviour. This was followed by “making unwelcome sexual comments or asking sexualised questions about your private life, body, or physical appearance.”
The patterns have direct relevance for E6’s training requirements, which mandate that induction sessions ensure students “understand behaviour that may constitute harassment and/or sexual misconduct.” The prevalence of apparently “lower-level” behaviours like staring suggests providers need to address misconceptions about what constitutes harassment – particularly given the survey’s use of legal definitions from the Equality Act 2010 and Protection from Harassment Act 1997.
There were also interesting patterns across socioeconomic and ethnic lines that deserve interrogation. Those from the least deprived areas (IMD quintile 5) reported higher harassment rates at 32.6 per cent, but so did those not eligible for free school meals, who showed elevated rates at 32.9 per cent. And mixed ethnicity respondents reported harassment at 31.5 per cent compared to 27.9 per cent among white students.
Where groups showed higher misconduct rates, part of the problem is that we can’t be sure whether that reflects reporting confidence, different social environments, or varying exposure patterns – all things providers will need to understand to make progress on the “credible difference” thing.
The ethnic dimension also intersects with religious identity, with Jewish respendents (29.8 per cent), those with no religion (30.5 per cent), and those from “any other religion” (35.5 per cent) showing elevated harassment rates. Again, differential intersectional patterns should align with E6’s requirements for providers to understand their specific student populations and tailor interventions accordingly.
The reporting crisis
One of the survey’s most concerning findings relates to formal reporting rates. Only 13.2 per cent of respondents experiencing harassment in the past year made formal reports to their institutions. For sexual assault (in a university setting or involving someone connected to the university) reporting varied dramatically by age – just 12.7 per cent of under-21s reported incidents compared to 86.4 per cent of those aged 31 and above.
This reporting gap in turn creates a fundamental information deficit for universities attempting to understand campus culture and develop appropriate interventions. The data suggests institutions may be operating with incomplete intel – hampering attempts to comply with E6 requirements to understand student populations and implement effective protective measures.
E6 explicitly requires providers to offer “a range of different mechanisms” for making reports, including online and in-person options, and to “remove any unnecessary actual or perceived barriers” that might make students less likely to report. The survey’s findings suggest the mechanisms may not be reaching their intended audiences, particularly younger students.
Among those who did report, experiences were mixed. For harassment cases, 46.7 per cent rated their reporting experience as good whilst 39.3 per cent rated it as poor. Sexual assault reporting showed slightly better outcomes, with 57.3 per cent rating experiences as good and 32.4 per cent as poor. These are findings that directly relate to E6’s requirements – and suggest the sector has some way to go to build confidence in the processes it does have.
The condition mandates that providers ensure “investigatory and disciplinary processes are free from any reasonable perception of bias” and that affected parties receive “sufficient information to understand the provider’s decisions and the reasons for them.” The proportion rating experiences as poor does suggest that some providers are struggling to meet E6’s procedural fairness requirements.
University connections and scope of misconduct
Jurisdiction has always been a contested issue in some policies – here, misconduct frequently involved university-connected individuals even when incidents occurred off-campus. Among harassment cases not occurring in university settings, 58.4 per cent involved someone connected to the victim’s university. For assault cases, that figure was 44.1 per cent.
Student perpetrators dominated both categories. Staff perpetrators appeared less frequently overall, though older students were more likely than younger groups to report staff involvement in assault cases.
In E6 terms, the condition explicitly covers “the conduct of staff towards students, and/or the conduct of students towards students” and applies to misconduct “provided in any manner or form by, or on behalf of, a provider.” The data suggests universities’ efforts will need to explicitly extend beyond physical premises to encompass behaviour involving community members regardless of location.
In fact, most recent harassment incidents occurred either entirely outside university settings (39.7 per cent) or across mixed locations (45.1 per cent), with only 15.2 per cent occurring exclusively in university settings. For sexual assault, 61.9 per cent occurred outside university settings entirely.
The patterns all point to providers needing sophisticated approaches to addressing misconduct that span campus boundaries. Traditional safety measures, or at least student perceptions of jurisdiction, might well miss the majority of incidents affecting students – broader community engagement and partnership approaches will need to be deployed.
Support confidence
The survey also examined’ confidence in seeking institutional support – finding 67.5 per cent felt confident about where to seek help, whilst 29.3 per cent lacked confidence. But confidence levels varied significantly across demographic groups, with particular variations by sexual orientation, sex, disability status, and age.
The differential confidence patterns also justify the E6 requirement for providers to ensure “appropriate support” is available and targeted at different student needs. It specifically requires support for students “with different needs, including those with needs affected by a student’s protected characteristics.”
The age-related reporting gap suggests younger students may face particular barriers to accessing institutional processes. This could relate to unfamiliarity with university systems, power dynamics, or different attitudes toward formal complaint mechanisms. For sexual assault cases, the contrast between 12.7 per cent reporting among under-21s versus 86.4 per cent among over-31s represents one of the survey’s most striking findings.
The age-related patterns have specific relevance given E6’s training and awareness requirements. The condition requires providers to ensure students are “appropriately informed to ensure understanding” of policies and behaviour constituting misconduct. The survey suggests the requirement may need particular attention for younger students – they’re showing both higher vulnerability and lower reporting rates.
Staff-student relationships
The survey’s staff-student relationship findings are a small proportion of the student population – but they do raise real questions about power dynamics and institutional governance.
Among the 1.5 per cent reporting those relationships, the high proportion involving educational or professional responsibilities suggest significant potential conflicts of interest.
Respondent students without disabilities were more likely to report relationships involving educational responsibility (72.6 per cent versus 45.5 per cent for disabled students), and similar patterns emerged for professional responsibilities. The differences deserve investigation, particularly given disabled students’ higher overall misconduct rates.
E6’s requirements on intimate personal relationships require that providers implement measures making “a significant and credible difference in protecting students from any actual or potential conflict of interest and/or abuse of power.”
The survey’s power dynamic findings suggest the requirement is needed – although whether the most common approach that has emerged (a ban where there’s a supervisory relationship, and a register where there isn’t) creates the right “culture” is a remaining question, given students’ views in general on professional boundaries.
Regulatory implications
The survey’s findings raise real questions about how OfS will use prevalence data in its regulatory approach. Back in 2022, Susan Lapworth told the House of Commons Women and Equalities Committee hearing that the data would enable the targeting of interventions:
“So a university with high prevalence and low reporting would perhaps raise concerns for us – and we would want to then understand in detail what was going on there and that would allow us to focus our effort.
Of course, as with Access and Participation, having national data on “which kinds of students in which contexts are affected by this” could well mean that what shows up in provider data as a very small problem could add up to a lot across the country. OfS’ levers in these contexts are always limited.
The lack of survey coverage of postgraduate students in general turns up here as a major problem. We might theorise that most exhibit multiple theoretical vulnerabilities given the dominance of international students and students who have supervisors – patience with OfS’ focus on undergraduates really is wearing thin each time it manifests.
The report also doesn’t look at home vs international student status, and nor does it disaggregate results by provider mission group, size, type, or characteristics. It only states that all eligible English providers in NSS 2025 were included, and that data are weighted to be representative of final-year undergraduates across the sector. Providers are also (confidentially) receiving their data – although response rates down at provider level may make drawing conclusions in the way originally envisaged difficult.
The dramatic under-reporting rates create monitoring challenges for both institutions and OfS. If only 13.2 per cent of harassment victims make formal reports, institutional complaint statistics provide limited insight into actual campus culture. The information gap complicates E6 compliance assessment – and suggests OfS may need alternative monitoring approaches beyond traditional complaint metrics.
E6 does explicitly contemplate requiring providers to “conduct a prevalence survey of its whole student population to the OfS’s specification” where there are compliance concerns. The 2025 survey’s methodology and findings provide a template, but it also seems to me that more contextual research – like that found in Anna Bull’s research from a couple of years back – is desperately needed to understand what’s going on beneath many of the numbers.
Overall though, I’m often struck by the extent to which providers argue that things like E6 are an over-reach or an example of “burden”. On this evidence, even with all the caveats, it’s nothing like the burden being carried by victims of sexual misconduct.
A concerningly high number of students – particularly LGBTQ+ and disabled people, as well as women – are subjected to sexual violence and harassment while studying in higher education. Wonkhe’s Jim Dickinson reviews the findings elsewhere on the site.
The data is limited to final year undergraduates who filled out the National Student Survey, who were then given the option to fill out this further module. OfS’ report on the data details the proportion of final year students who experienced sexual harassment or violence “since being a student” as well as their experiences within the last 12 months.
It also includes data on experiences of reporting, as well as prevalence of staff-student intimate relationships – but its omission of all postgraduate students, as well as all undergraduates other than final year students means that its findings should be seen as one piece of a wider puzzle.
Here, I try to lay out a few of the other pieces of the puzzle to help put the new data in context.
The timing is important
On 1st August 2025 the new condition of registration for higher education providers in England came into force, which involves regulatory requirements for all institutions in England to address harassment and sexual misconduct, including training for all staff and students, taking steps to “prevent abuses of power” between staff and students, and requiring institutions to publish a “single, comprehensive source of information” about their approach to this work, including support services and handling of reports.
When announcing this regulatory approach last year, OfS also published two studies published in 2024 – a pilot prevalence survey of a small selection of English HEIs, as well as a ‘poll’ of a representative sample of 3000 students. I have discussed that data as well as the regulation more generally elsewhere.
In this year’s data release, 51,920 students responded to the survey with an overall response rate of 12.1 per cent. This is significantly larger sample size than both of the 2024 studies, which comprised responses from 3000 and 5000 students respectively.
This year’s survey finds somewhat lower prevalence figures for sexual harassment and “unwanted sexual contact” than last year’s studies. In the new survey, sexual harassment was experienced by 13.3 per cent of respondents within the last 12 months (and by 24.5 per cent since becoming a student), while 5.4 per cent of respondents had been subjected to unwanted sexual contact or sexual violence within the last 12 months (since becoming a student, this figure rises to 14.1 per cent).
By any measure, these figures represent a very concerning level of gender-based violence in higher education populations. But if anything, they are at the lower end of what we would expect.
By comparison, in OfS’ 2024 representative poll of 3000 students, over a third (36 per cent) of respondents had experienced some form of unwanted sexual contact since becoming a student with a fifth (21 per cent) stating the incident(s) happened within the past year. 61 per cent had experienced sexual harassment since being a student, and 43 per cent of the total sample had experienced this in the past year.
The lower prevalence in the latest dataset could be (in part) because it draws on a population of final year undergraduate students – studies from the US have repeatedly found that first year undergraduate students are at the greatest risk, especially when they start their studies.
Final year students may simply have forgotten – or blocked out – some of their experiences from first year, leading to lower prevalence. They may also have dropped out. The timing of the new survey is also important – the NSS is completed in late spring, while we would expect more sexual harassment and violence to occur when students arrive at university in the autumn.
A study carried out in autumn or winter might find higher prevalence. Indeed, the previous two studies carried out by OfS involved data collected at different times to year – in August 2023 (for the 3000-strong poll) and ‘autumn 2023’ (for the pilot prevalence study).
A wide range of prevalence
Systematic reviews published in 2023 from Steele et al and Lagdon et al from across the UK, Ireland and the US have found prevalence rates of sexual violence between 7 per cent to 86 per cent.
Steele et al.’s recent study of Oxford University found that 20.5 per cent of respondents had experienced at least one act of attempted or forced sexual touching or rape, and 52.7 per cent of respondents experienced at least one act of sexual harassment within the past year.
Lagdon et al.’s study of “unwanted sexual experiences” in Northern Ireland found that a staggering 63 per cent had been targeted. And my own study of a UK HEI found that 30 per cent of respondents had been subjected to sexual violence since enrolling in their university, and 55 per cent had been subjected to sexual harassment.
For now, I don’t think it’s helpful to get hung up on comparing datasets between last year and this year that draw on somewhat different populations. It’s also not necessarily important that respondents were self-selecting within those who filled out the NSS – a US study compared prevalence rates for sexual contact without consent among students between a self-selecting sample and a non-self-selecting sample, finding no difference.
The key take-home message is that students are being subject to a significant level of sexual harassment and violence, and particularly women, LGBTQ+ and disabled students are unable to access higher education in safety.
Reporting experiences
The findings on reporting reveals some important challenges for the higher education sector. According to the OfS new survey findings, rates of reporting to higher education institutions remain relatively low at 13.2 per cent of those experiencing sexual harassment, and 12.7 per cent of those subjected to sexual violence.
Of students who reported to their HEI, only around half of rated their experience as “good”. But for women as well as for disabled and LGBTQ+ students there were much lower rates of satisfaction with reporting than men, heterosexuals and non-disabled students who reported incidents to their university.
This survey doesn’t reveal why students were rating their reporting experiences as poor, but my study Higher Education After #MeToo sheds light on some of the reasons why reporting is not working out for many students (and staff).
At the time of data collection in 2020-21, a key reason was that – according to staff handling complaints – policies in this area were not yet fit for purpose. It’s therefore not surprising that reporting was seen as ineffective and sometimes harmful for many interviewees who had reported. Four years on, hopefully HEIs have made progress in devising and implementing policies in this area, so other reasons may be relevant.
A further issue focused on by my study is that reporting processes for sexual misconduct in HE focus on sanctions against the reported party rather than prioritising safety or other needs of those who report. Many HEIs do now have processes for putting in place safety (“precautionary” or “interim”) measures to keep students safe after reporting.
Risk assessment practices are developing. But these practices appear to be patchy and students (and staff) who report sexual harassment or violence are still not necessarily getting the support they need to ensure their safety from further harm. Not only this, but at the end of a process they are not usually told the actions that their university has taken as a result of the report.
More generally, there’s a mismatch between why people report, and what is on offer from universities. Forthcoming analysis of the Power in the Academy data on staff-student sexual misconduct reveals that by the time a student gets to the point of reporting or disclosing sexual misconduct from faculty/staff to their HEI, the impacts are already being felt more severely than those who do not report.
In laywoman’s terms, if people report staff sexual misconduct, it’s likely to be having a really bad impact on their lives and/or studies. Reasons for reporting are usually to protect oneself and others and to be able to continue in work/study. So it’s crucial that when HEIs receive reports, they are able to take immediate steps to support students’ safety. If HEIs are listening to students – including the voices of those who have reported or disclosed to their institution – then this is what they’ll be hearing.
Staff-student relationships
The survey also provides new data on staff-student intimate relationships. The survey details that:
By intimate relationship we mean any relationship that includes: physical intimacy, including one-off or repeated sexual activity; romantic or emotional intimacy; and/or financial dependency. This includes both in person and online, or via digital devices.
From this sample, 1.5 per cent of respondents stated that they had been in such a relationship with a staff member. Of those who had been involved in a relationship, a staggering 68.8 per cent of respondents said that the university or college staff member(s) had been involved with their education or assessment.
Even as someone who researches within this area, I’m surprised by how high both these figures are. While not all students who enter into such relationships or connections will be harmed, for some, deep harms can be caused. While a much higher proportion of students who reported “intimate relationships” with staff members were 21 or over, age of the student is no barrier to such harms.
It’s worth revisiting some of the findings from 2024 to give some context to these points. In the 3000-strong representative survey from the OfS, a third of those in relationships with staff said they felt pressure to begin, continue or take the relationship further than they wanted because they were worried that refusing would negatively impact them, their studies or career in some way.
Even consensual relationships led to problems when the relationship broke up. My research has described the ways in which students can be targeted for “grooming” and “boundary-blurring” behaviours from staff. These questions on coercion from the 2024 survey were omitted from the shorter 2025 version – but assuming such patterns of coercion are present in the current dataset, these findings are extremely concerning.
They give strong support to OfS’ approach towards staff-student relationships in the new condition of registration. OfS has required HEIs to take “one or more steps which could make a significant and credible difference in protecting students from any actual or potential conflict of interest and/or abuse of power.”
Such a step could include a ban on intimate personal relationships between relevant staff and students but HEIs may instead chose to propose other ways to protect students from abuses of power from staff. While most HEIs appear to be implementing partial bans on such relationships, some have chosen not to.
Nevertheless, all HEIs should take steps to clarify appropriate professional boundaries between staff and students – which, as my research shows, students themselves overwhelmingly want.
Gaps in the data
The publication of this data is very welcome in contributing towards better understanding patterns of victimisation among students in HE. It’s crucial to position this dataset within the context of an emerging body of research in this area – both the OfS’ previous publications, but also academic studies as outlined above – in order to build up a more nuanced understanding of students’ experiences.
Some of the gaps in the data can be filled from other studies, but others cannot. For example, while the new OfS regulatory condition E6 covers harassment on the basis of all protected characteristics, these survey findings focus only on sexual harassment and violence.
National data on the prevalence of racial harassment or on harassment on the basis of gender reassignment would be particularly valuable in the current climate. This decision seems to be a political choice – sexual harassment and violence is a focus that both right- and left-wing voices can agree should be addressed as a matter of urgency, while it is more politically challenging (and therefore, important) to talk about racial harassment.
The data also omits stalking and domestic abuse, which young people – including students – are more likely than other age groups to be subjected to, according to the Crime Survey of England and Wales. My own research found that 26 per cent of respondents in a study of gender-based violence at a university in England in 2020 had been subjected to psychological or physical violence from a partner.
It does appear that despite the narrow focus on sexual harassment and violence from the OfS, many HEIs are taking a broader approach in their work, addressing domestic abuse and stalking, as well as technology-facilitated sexual abuse.
Another gap in the data analysis report from the OfS is around international students. Last year’s pilot study of this survey included some important findings on their experiences. International students were less likely to have experienced sexual misconduct in general than UK-domiciled students, but more likely to have been involved in an intimate relationship with a member of staff at their university (2 per cent of international students in contrast with 1 per cent of UK students).
They were also slightly more likely to state that a staff member had attempted to pressured them into a relationship. Their experiences of accessing support from their university were also poorer. These findings are important in relation to any new policies HEIs may be introducing on staff-student relationships: as international students appear to be more likely to be targeted, then communications around such policies need to be tailored to this group.
We also know that the same groups who are more likely to be subjected to sexual violence/harassment are also more likely to experience more harassment/violence, i.e. a higher number of incidents. The new data from OfS do not report on how many incidents were experienced. Sexual harassment can be harmful as a one-off experience, but if someone is experiencing repeated harassment or unwanted sexual contact from one or more others in their university environment (and both staff and student perpetrators are likely to be carry out repeated behaviours), then this can have a very heavy impact on those targeted.
The global context
Too often, policy and debate in England on gender-based violence in higher education fails to learn from the global context. Government-led initiatives in Ireland and Australia show good practice that England could learn from.
The data published by OfS is much more limited than these studies from other contexts in its focus on third year undergraduate students only. It will be imperative to make sure that HEIs, OfS, government or other actors do not rely solely on this data – and future iterations of the survey – as a tool to direct policy, interventions or practice.
Nevertheless, in the absence of more comprehensive studies, it adds another piece to the puzzle in understanding sexual harassment and violence in English HE.
Three private universities offer the best student experience out of all Australian institutions according to the latest student experience survey, with the University of Divinity ranked number one overall.
Please login below to view content or subscribe now.