On the face of it, running a successful recruitment round is fairly straightforward.
It’s a bit like making a salad. Everything needs to look fresh and appetising, and you don’t want too much of one thing in case people don’t like it.
I mean, it’s not rocket science.
The provider level data from UCAS nicely illustrates the other, less straightforward end of the equation. We know surprisingly little about what applicants actually want to do, and where they want to do it.
Sure, there’s near-certainties – medicine at UCL is unlikely to want for well-qualified applicants any time soon – but some things are rather less expected. Computing and IT focused courses, which have been growing in popularity for years, appear to have hit a wall. Is it the onset of generative AI “vibe coding” hitting employment prospects? Is it a change in the public perception of technology companies?
We pretty much know it is affordability (and the slow atrophy of the student maintenance system) that prompts applicants from less advantaged socio-economic backgrounds to choose to study locally. But we don’t know why selective providers that have historically recruited nationally have decided en masse to move into this very specialised market, or what changes they have made to their standard teaching (and indeed offer-making) approach to make this work.
It’s questions like these that make the insights available from this year’s UCAS End of Cycle data so fascinating, and the choice of data that is released so frustrating.
The Russell Group ate my students!
There’s been a lot of talk (and a lot of quite informed data driven evidence) to suggest that traditionally selective providers have been accepting students with uncharacteristically low grades in greater numbers than in previous years.
A couple of unexpected new additional data tables shed a little more light. This last (2025) cycle saw selective (high tariff) providers recruit more students with 15 A level points or below than in any previous year – while medium tariff providers are doing less well in students with between 9 and 11 points than any year outside the pandemic, and low tariff providers had their worst year on record for between 10 and 12 points, and their worst year since the pandemic for between 8 and 6 points.
A level points? Yes, for reasons best known to UCAS this is not the same as tariff points (so only includes A level performance, not vocational qualifications or grade 8 piano). You get 6 points for an A*, down to 1 point for an E – and only your best three A levels count. So 12 points means three Bs or thereabouts.
The counter story is that this change in behavior hasn’t shifted the overall averages by that much. For high tariff providers the average accepted applicant has 13.9 A level points (down from 14 last year or 14.3 in 2016 – that’s round about AAB. Medium tariff is about BCC (10.4), Lower tariff is near enough CCC (9.4 – up very slightly on the historic average).
Usually I’d suggest that this stasis is down to a regular recalculation of tariff groups – but I know that the last time UCAS allocated providers to groups was back in 2012. We’ve also never been told which providers are in which tariff group – this is a different split to the DfE or OfS variants, unhelpfully. And we don’t get data on A level (or tariff) points by provider, which would offer a much more helpful level of granularity to this point of sector-wide interest.
A peep at provider strategies
There’s been a welcome update to the release of the provider level End of Cycle dataset: previously we used to get offermaking only within a rather vestigial dataset known as “equalities” – 2025 adds the offermaking data plus a range of new equalities parameters to the main provider level release.
For all tariff bands or sector-level data is interesting, the increasing diversity of (and increasing competition within) the sector means that provider-level changes in behavior are by far the most interesting component of this release. The new information means that the chart that you lost your morning to last year is now looking very likely to make you lose your entire day.
This is a complex but powerful dashboard, which shows the difference between the most recent year (2025) of data and a comparator year you can choose (by default last year but you can choose any year since 2019) across two dimensions (you can choose from applications, offers, and accepted applicants for each). I’ve added filters by domicile (UK, international, or all) and subject group (the familiar top level – CAH1 – list).
It’s a lot of data on one chart, so I’ve added a group filter, which by default removes some smaller providers from the display – and there’s a highlighter to help you find a provider of interest.
A dot being further up or further right means that measure has grown between the comparator year and the current year, further down or further left means it has shrunk.
There’s a nearly infinite number of stories to tell from this chart. Here’s some notable ones.
Firstly Canterbury Christ Church University has accepted substantially fewer applicants in 2025 than in 2024. A dig around in the data suggests that decline is focused on UK domiciled applicants studying business subjects, which suggests to me that this shows the end of one or more franchise or partnership arrangements. I asked Canterbury Christ Church University for a comment – nothing yet but I’ll add it if it comes in – I’d imagine that this is the most visible of a wave of providers calculating that the increasing regulatory risk (with both OfS and DfE taking action) is not worth the hassle of running such provision – I’m tentatively pointing at Buckinghamshire New University and Oxford Brookes University as other similar (but smaller) examples).
Not all of the Russell Group is following the same recruitment strategy – there are instances (Nottingham, Glasgow, Cardiff) where fewer applicants have been accepted than in 2024. Some Russell Group providers (for example Leeds, York, Southampton, and Cardiff) have seen fewer applications than in previous years – the first three in that list have nevertheless increased acceptances over last year. Because we can now see the number of offers made using the filters at the top, it is apparent that the entire group (excepting Cardiff and Southampton) made more offers than last year.
League leaders
If you are playing along with the dashboard you’ll have spotted that University College London accepted nearly 2,500 more applicants than last year (after making a genuinely startling 12,000 more offers) . The majority of this increase (2,290 accepted applicants, 10,650 offers) related to international applicants – with growth in pretty much every subject area contributing to this performance.
That’s not the largest growth in accepted applicants, however (it’s the second largest). For the league leaders, we look to the University of Wolverhampton – which accepted an impressive 3,625 extra applicants compared to last year. Unlike UCL, these are all UK-domiciled students, and nearly all (2,970) are studying business subjects. To me, this suggests a new partnership – I asked Wolverhampton about this, and am waiting to hear back.
But who made the most offers in 2025? For international students, it’s UCL and it isn’t even close. But for home students it was the University of Exeter, which made 7,130 more UK domiciled offers this year than last year (a total of 37,515 offers in the 2025 cycle!) across a mix of subject areas. Exeter wasn’t able to get me a comment before publication – I’ll add one if it comes in later.
And I did promise a look at computing recruitment. It is a decline in both applications and acceptances pretty much across the board – with the exception of an 800 student growth in accepted applicants at Bath Spa University. UCL did recruit 40 more students than last year, but this is against a 1,520 decline in applications. There’s still a bit of growth at the University of Manchester, and the University of York – but note also Escape Studios (a growing independent visual effects specialist that was once known as Pearson College, which delivers degrees validated by the Coventry University).
School leavers
I’ve also put together a version of this chart that shows only the recruitment of 18 year olds. The direct path between school or college and university is no longer the dominant one in the UK, and hasn’t been for some time – but in policymaking and political discussions it is still where minds tend to go.
Focusing on UK 18 year olds, we can see that the University of Exeter has grown most spectacularly compared to last year on applications, offers, and acceptances. Large amounts of growth in this part of the market tends to be concentrated in more selective providers, but we can also see credible performances from big civic providers like Nottingham Trent University, Manchester Metropolitan University, and Liverpool John Moores University.
Conversely we can see smaller but notable declines in applications and acceptances from providers including the University of the West of England, Birmingham City University, and the University of East London. The noticeable pattern is that there is no pattern – recruitment among school leavers can go cold anywhere at any time it would seem. And there are some ways around this – both the University of York (up 1,285) and the University of Leeds (up 3,180) upped school-leaver offer making despite a small decline in applications
A sense of the sector
Competition is clearly heating up. For those who have hit on a winning recruitment formula, the challenge becomes a need to ensure that every additional undergraduate gets the high quality experience they have been led to expect. An increase in fee income is almost all going to go to investment in capacity (be that more staff, retaining existing staff, or providing more resources). If your expansion has been into applicant groups you have little experience in teaching, the need to invest rises.
Conversely, for those who have yet to hit upon the way to attract applications reliably there will already have been internal discussions about what needs to be done or what needs to change. Recruitment can and does figure in portfolio review and course revalidation questions: all of which comes down to whether a provider can afford to do what it would like to continue doing. Losing resources or capacity is a very last resort – once you wave goodbye to a course or department it is very difficult to spin back up.
There will also be attention paid to sector trends – the kind of stuff I plotted back in December when we got the first phase of the End of Cycle release. Is it something your provider is doing, or a more general societal change, that means recruitment is growing or shrinking on a particular course. These are difficult, painful conversations, and need careful, considered, responses.
This audio is auto-generated. Please let us know if you have feedback.
Dive Brief:
Morris Brown Collegehas reinstated its president of seven years just days after abruptly terminating him on Jan. 12.
The historically Black college said President Kevin James agreed on Jan. 16 to accept the Atlanta institution’s invitation to return to the leadership post.
“After careful review, the Board determined that Dr. James’ separation from the College did not fully comply with the procedural and contractual requirements outlined in his employment agreement,” the college’s board of trustees said Tuesday.
Dive Insight:
Morris Brown’s board acknowledged the potential emotional whiplash its actions and reversal might cause among stakeholders.
“This period has been disruptive and painful for members of the Morris Brown community,” the board said in its announcement. “The board deeply regrets the harm this has caused our institution, students, families, donors, supporters, and Dr. James.”
On Tuesday, after Morris Brown announced James’ return, local station WSB-TV 2 reported that it had obtained “multiple documents with allegations of sexual harassment, abuse and threats by James.”
Included in the materials WSB-TV 2 said it obtained are grievances filed by college employeeswho accused James of intimidation and misusing his authority, retaliation, and creating a hostile work environment. Those internal complaints led the college to suspend James prior to firing him.
A spokesperson for the college did not respond to a request for comment by publication time.
In a statement posted to social media on Jan. 12, James said the college terminated him “without providing specific cause or substantive explanation.”
“This action is deeply concerning,” James said at the time. “Research and my lived experience demonstrate that many HBCUs have struggled with board overreach and interference. Unfortunately, those dynamics are evident in this situation.”
Morris Brown had announced on Jan. 12 that a trustee, Nzinga Shaw, would take over as interim president. In a statement shared with the media then, the college said, “This transition in leadership will help to ensure continuity as we move forward with the important work of strengthening and advancing the College.”
The statement has since been replaced on Morris Brown’s website with news of James’ reinstatement.
In the new announcement, the college’s board said that it “takes seriously the concerns voiced by members of our community and affirms that retaliation against individuals who raise concerns in good faith is not acceptable.” However, it didn’t elaborate on those concerns.
The board added that it is committed to “ensuring that appropriate processes exist for concerns to be raised safely, reviewed fairly, and addressed responsibly.”
James also issued a statement on Tuesday about his return. In it, he said his top priorities are to “begin the healing journey while continuing our focused preparation for our upcoming accreditation reaffirmation visit in two weeks.”
Morris Brown in 2022 became fully accredited with the Transnational Association of Christian Colleges and Schools after a two-decade effort.
The college lost its accreditation in the early 2000s over financial issues, which then led to precipitous enrollment declines and even deeper challenges. In 2012, the institution filed for Chapter 11 bankruptcy.
In recent years, Morris Brown has posted healthy operating surpluses. However, its most recent financial statements include findings from auditors of some deficient financial controls and accounting processes.
The college, founded in 1881 by the African Methodist Episcopal Church, enrolled 432 students in fall 2024. That’s up more than 70% from 2022 levels but still much smaller than in 2002, when the college had some 2,500 students.
In 2007, I was invited to deliver a ‘keynote’ at the opening of the National e-Learning Centre in Zagreb, Croatia. I was then the Head of e-Learning and the Head of the Centre for Learning Development at the University of Hull. I argued then that the “e” in e-learning should stand for Empowerment, not Electronic. In short, I outlined that ‘e’ stood for many facets of learning, most of which were misunderstood. These different dimensions will be explored for Paid Subscribers later this week.
Looking back now, 19 years later, at the current landscape, I can say without hesitation that despite these recent years of “progress,” many institutions have used technology to automate compliance rather than liberate and empower learners. In reality, the ‘digital age’ has transformed the educational experience of learners and teachers alike, but in what ways has it actually enhanced it?
The current candidate as a significant catalyst for change (as the advent of Wikipedia, Virtual Learning Environments, and ZOOM have been before) is the advent of Generative AI and automated grading. This issue certainly presents a range of questions worth discussing in departmental meetings and academic development workshops. I would start the debate with a simple question: Is the student more empowered today, or just more monitored?
This Substack is called the ‘Educational Architects’ because it is aimed at providing the tools, blueprints and frameworks for designing and building learning resources and experiences. It is not just about tips and tricks for ‘classroom’ teaching (although there will be some of that), it is about personal practice, programme team vision, departmental management and institutional leadership.
We need a “New Architecture”, one that isn’t about the latest Virtual Learning Environment (VLE) software or the need to scale up proctored exam invigilation, but about the cognitive and affective structures we build for our students. We need structures that empower learners to develop their psychomotor abilities, their metacognitive awareness, and the very human interpersonal skills.
A major focus of this Substack is the need for effective, purposeful and beautifully designed programmes and courses. Course design has fallen into yet another “Box-Ticking” crisis. Regardless of whether validation services are internal to the institution or regional or national, too many courses aim for the minimum required to get approval. Why do so many course designs default to the path of least resistance?
When we design for administrative ease, we sacrifice deep engagement. We produce graduates who are good at “doing school” but unprepared for the “messy middle” of professional practice. My personal mission has always been to broaden and heighten individual academics and learning designers’ appreciation of a richer educational landscape. Over the last 30 years, I have developed an 8-Stage Learning Design Framework (8-SLDF), Five Educational Taxonomies, a model for Student-Owned Learning Engagement, the Digital Artefacts for Learner Engagement framework and tools for identifying learners’ culturally centred epistemological orientations (POISE). I will be sharing this research and scholarship with you on this Substack.
Why This Substack?
This isn’t intended to be just another educational blog. This is a workspace for “Educational Architects” who want to reclaim the soul of pedagogy. It is a space where practical guidance is questioned, discussed and refined. Paid subscribers will receive toolkits and workbooks on a wide range of practical learning and teaching activities, and based on their feedback, these will be refined and re-shared with them.
Subscribers will get one practical and strategic post each week, with paid subscribers receiving tactical tools or resources to help them build their practice with the support of colleagues and me.
Call to Action
My question to you, one I ask myself continuously, is “If you could tear down one ‘wall’ in your current institutional design, what would it be?”
This could be a departmental structural issue, silos between disciplines, or compliance structures that are overly restrictive or entirely absent. It could be the lack of support for innovative teaching practices or the insistence on teaching to a prescribed ‘workbook’. It might also be poor assessment design or the inability to revise and update the curriculum. Whatever your structural challenge, I want to hear from you.
Become a paid supporter and gain access to practical resources. This week, it is an enhanced version of the original 2007 keynote, with a transcript and prompts for professional questions.
Simon’s Educational Architects Substack is a reader-supported publication. To receive new posts and support my work, consider becoming a free or paid subscriber
This audio is auto-generated. Please let us know if you have feedback.
After a tumultuous 2025, education policy and legal experts expect no let-up in 2026. The second Trump administration and its Education Department are continuing to reshape the direction of federal support for K-12, and courts are routinely hearing cases of great consequence for school district policies.
Continual change to the education landscape “makes it very difficult to plan and prepare, and to provide students with the quality public education they deserve,” said Sasha Pudelski, director of advocacy for AASA, The School Superintendents Association. “School district leaders are facing mounting uncertainty, and should brace for more in 2026.”
Here are four K-12 legal and policy trends for district leaders to monitor in the coming year.
Uncertainty around federal support
The Trump administration’s push to “return education to the states” means that superintendents can expect less federal support and more change in 2026. This ranges from less help with administering the National Assessment of Educational Progress and managing federally funded programs, to unpredictability around the availability of federal funds and the makeup of the U.S. Education Department, education policy experts said.
“Anything that they’re used to getting from the federal government, I would expect them to essentially expect less,” said Jonathan Collins, assistant professor of political science and education at Columbia University’s Teachers College.
Collins said districts in blue states can also anticipate being targeted for policies related to diversity, equity and inclusion — including programs that support diversifying the teacher workforce — as well as LGBTQ+ rights.
“You should expect them to turn up the heat,” Collins said of the federal government’s crackdown on Title VI and Title IX issues, which bar race- and sex-based discrimination, respectively, in federally funded education programs.
In the past, the federal government typically invoked the statutes to protect underserved students, but the Trump administration has instead used them to target DEI efforts and protections for LGBTQ+ students. “I think the nozzle on the gas is going to change to an even higher level this upcoming year,” Collins added.
A bigger religious footprint in public education
Recent years have seen a surge in First Amendment lawsuits related to the religious rights of parents and teachers, especially spurred on by the parental choice movement circling around issues like curriculum and LGBTQ+ culture in schools.
In 2025, for example, the U.S. Supreme Courtrequired a Maryland district to allow curriculum opt-outs for parents who don’t want their children exposed to LGBTQ+-related content. That ruling in Mahmoud v. Taylor set legal precedent for other districts’ policies on such opt-outs.
In 2026, additional rulings on similar issues are expected to influence district policies, according to education policy experts. For example, lawsuits are pending on LGBTQ+ student pronoun usage and state laws requiring the Ten Commandments to be displayed in classrooms.
Districts, especially those in red states, can expect “to exercise even more authority” over school prayer, teaching of the 10 Commandments, “and just any initiative or program or aspect of schooling that especially caters to Christianity,” said Collins. “I think you can expect to see an even bigger upsurge in those kinds of things happening.”
Religious-based organizations are also likely to continue pushing — under the mantle of the First Amendment — for the creation of religious public charter schools.
As a result of a deadlock due to Justice Amy Coney Barrett’s recusal in one such case, the Supreme Court kept in place an Oklahoma ruling that blocked what would have been the nation’s first religious public charter school. However, after that Catholic school’s failed launch, another religious charter was proposed for Oklahoma in November — this time by a Jewish organization. Whether that school succeeds, and what it could mean for other efforts to establish religious public schools, will be watched in 2026.
Expansion of right-to-education cases
While right-to-education lawsuits have been a constant in the education finance sector, the “right-to-education” legal argument is expanding to specific subject areas in the classroom, including literacy and civics education. The right to education is guaranteed under almost every state constitution, and it has so far been used routinely by students and advocacy groups to advocate for equitable education funding.
In recent years, that argument has expanded to “right-to-literacy” or “right-to-read” cases, with California and Detroit entering major settlements after students sued.
The legal argument is also being stretched to ensure civics education is taught, said Michael Rebell, executive director for the Center for Educational Equity and a professor of law and educational practice at Columbia University’s Teachers College.
In 2025, students applied “the right to education” legal argument to sue for a better civics education in Kentucky, for instance. In 2026, this legal argument could proliferate, Rebell said, with a decision expected any day now in the Kentucky case.
More AI policies and guidance
Following the explosion in the deployment of artificial intelligence across education and countless other sectors in 2025, districts can expect more guidance and policies related to AI tools in 2026, education experts said.
At least 31 states have already issued some kind of AI guidance or framework for schools, according to AI for Education, a for-profit provider of AI literacy training for educators.
However, the legal parameters for using the technology — including such concerns as data rights and privacy protections — still need to be ironed out at the federal level and across states and localities.
“It’s kind of the wild, wild west right now,” said Collins. “Expect that to also be a big cornerstone of what we see education policy-wise in this upcoming year.”
This audio is auto-generated. Please let us know if you have feedback.
Dive Brief:
Student theater can provide key opportunities for mentor-mentee relationships that support cross-grade collaborations and build confidence, social-emotional learning and creative thinking in older and younger students alike.
These dynamics are inherent in the culture around student theater, which often combines grade levels out of necessity, said Jennifer Katona, executive director of the Educational Theatre Association. For instance, 8th graders might lead 5th and 6th graders in putting on productions, or high school juniors and seniors might mentor 9th graders.
“Theater skills and leadership skills go hand-in-hand,” Katona said. “It’s also very effective, because then you have a lot of extra helpers. By the nature of a rehearsal process, you’re getting a great cross-pollination of ages.”
Dive Insight:
In smaller schools and districts, this mentoring dynamic can be less formal, taking the form of theater teachers bringing middle schoolers to see high school students perform, for example, Katona said.
“This is what you can look forward to,” she said. “Here’s what it means to be in the high school programs. They go to each other’s schools.”
In larger schools and districts, some theater teachers have more robust mentoring programs that lay out touch points that can be “just as intricate as their rehearsal schedule,” Katona said.
Older students who act as mentors build their own knowledge as anyone does when teaching other people, Katona said.
“Anytime your own knowledge increases, you get a confidence boost,” she added. “That’s wonderful for SEL — you can feel like an expert in something, and wear that mantle.”
For younger students, it’s a different dynamic to be given pointers by an older peer rather than a teacher, and they receive the information perhaps more openly, Katona said.
“It’s student-to-student,” she said. They’re more comfortable asking other students questions — “more comfortable to be vulnerable. When we are able to open ourselves up that way, it’s a really healthy space to be in, and it’s a creative space to be in. It’s also fun, which we can’t leave out of the SEL question. Laughter and joy are necessary.”
Theater creates plenty of both, and it can be a gold mine for social-emotional learning of the sort that doesn’t happen as readily in a rushed, screen-oriented culture where people are “so quick to leave a comment,” Katona said.
“We’ve lost the ability to engage, to look each other in the eye, to think about something meaningfully,” she said. “Theater forces us to slow down and think for a beat. All of that is very healthy for all of us. People are buying apps to remind themselves to breathe in the middle of the day. That’s what theater already does for us.”
This audio is auto-generated. Please let us know if you have feedback.
Dive Brief:
With federal data continuing to show that student math scores are lower than pre-pandemic, math teachers like Sean Donovan of Brewer High School in Maine are refusing to accept that this is a “new normal.” In his classroom, Donovan has adopted a number of real-world techniques designed to boost the relevance of math lessons for his students.
Donovan said that a combination of professional development sessions through the University of Maine and the Maine Mathematics and Science Alliance, as well as graduate work toward an instructional technology degree, prompted him to roll out inquiry-based digital projects. These grant students “ownership on what the topic is, how they present it, what digital platform they use, and how it’s relevant to them,” he said.
Another initiative Donovan has undertaken is the use of “fun-tivities,” in which he teaches math more like a science class. “They’re doing an experiment, or they’re doing something with hands-on tools,” Donovan said. “It’s a lot of work, a lot of hands-on prep. But as one teacher at a workshop said, ‘We don’t want science teachers to have all the fun.’”
Dive Insight:
“We give tests on paper. But most real-world tasks, or jobs, you’ve got to be able to communicate verbally,” Donovan said. “Having [students] reflect on their learning, it’s been really beneficial for them.”
The professional development from University of Maine emphasized this approach, he added.
As students prepare their digital projects for presentation, Donovan has the expectation that they will verbally explain in their own words the project’s purpose and results. “That’s something I don’t think most math teachers have done,” he said.
As for the hands-on “fun-tivities,” one example might be learning how to do architectural surveying work by leveraging trigonometry to estimate the height of the school’s athletic building towers, Donovan said. Others could include using spectrometers to measure light intensity or an auditory device to do the same with sound.
“The kids love them,” he said. “They’re always asking, ‘Can we do a fun-tivity today?’”
To gauge students’ engagement, Donovan has been using a simple Google form to ask them to rate different classroom activities from 1 to 5, with 5 being the highest.
While Donovan likes to think his direct instruction is reasonably engaging, and he was reasonably happy with the scores overall. “They were higher when we were doing group work and hands-on activities,” he said. “There was measurable improvement.”
It’s also been enjoyable for him, as a teacher, to see what students can produce, Donovan said.
“It’s more work to grade, but it’s more enjoyable and fun,” he said. “If I’m having fun, I’m probably doing a better job.”
In another example of his approach’s success, he noted that he’s had students who are “kind of checked out” become engaged in producing a video on flight simulators and how all the math works.
“When you get them to pick something they’re interested in, they can really blossom as a student,” Donovan said. “I’m buying into it. I think the students have very much bought into it.”
While he quickly implemented such approaches across the board, Donovan would recommend that other educators start small when considering introducing more hands-on activities.
“Make it manageable for yourself, and make a commitment to it,” he said — especially if you’ve mapped out your plans and are wondering, “How am I going to squeeze a new thing in there without taking something out?”
“I still do basic quizzes, but for my summative end-of-unit assessment, I have replaced traditional tests with the digital projects,” he said.
1. Growth is the target, but not from student recruitment The international education strategy sets out a bold ambition for the UK’s thriving education sector: to collectively grow education exports to £40 billion per year by 2030, but the plan makes it clear that will need to come from the broader education ecosystem including transnational education (TNE), ELT, skills and edtech.
2. The government’s love affair with TNE continues The UK’s TNE boom – seen most evidently in India, with a slew of UK branch campuses opening over the next year or so – shows no sign of slowing down. The IES sets out an intention to grow the government’s leadership in TNE, as well as using the Education Sector Action Group (ESAG) to look out for partnership opportunities and educating providers on the technical risks of operating overseas.
3. Soft power and diplomacy is an explicit focus The Foreign, Commonwealth & Development Office (FCDO) has joined the Department for Education (DfE) and the Department for Business & Trade (DBT) as authors of the strategy and as a result soft power is a core feature. The strategy talks about ‘rolling out a new diplomacy‐led approach’, by appointing heads of missions to act as local education champions in priority countries. The upcoming HMG Soft Power Strategy will also dictate what global partnerships are a priority for the country.
4. The ESAG will deliver action plans This reformed ministerially chaired forum will bring together industry, government, and representative bodies from across the education sector to tackle key concerns and identify opportunities for partnerships. Each representative will lead on an action plan, published within the first 100 days of appointment to ESAG, outlining how their members will support delivery of the three ambitions of this strategy. But who is ESAG? We’ve broken it down for you here.
5. Sir Steve Smith continues his work with priority countries as international education champion Priority countries named in the strategy are still India, Indonesia, Nigeria, Saudi Arabia and Vietnam, as per the 2019 IES and the work of Sir Steve Smith. Emerging economies such as Brazil, Mexico and Pakistan are mooted as wider opportunities without any further details given. Pakistan is an outlier given the recent problems with high asylum applications and visa delays.
6. The levy and tough immigration policy is reaffirmed The publication of the strategy was delayed in response to the government’s immigration whitepaper and the Autumn Budget, which announced the international student levy. It remains to be seen how this will be applied to students – however, the strategy doubles down on reaffirming this policy and how the IES will adhere to wider government immigration policy.
7. Cross-government collaboration welcome, but will bureaucracy slow delivery down? There is a clear effort to include all stakeholders in the process and direction, including the government’s vast overseas networks – but will many more stakeholders prevent the UK from being agile? Global competition is ramping up again as Australia has undertaken its own strategy review and the big four study destinations expand to the big 10. Read our analysis here.
8. No new policy levers, tactics or funding included Despite the obvious challenges, there appear to be no new tactics being presented in the strategy to meet the growth target. Instead, the report reiterates the strength of existing scholarships and campaigning by The British Council. The UK’s return to Erasmus is a welcome feature mentioned in the document and a new development after the previous IES – but that was technically announced by the government at the end of 2025. TNE and innovation are expensive and at present there is no government support offered to kick-start activity.
9. Sustainable recruitment is the name of the game, but are the Home Office official stakeholders? The need for sustainable international recruitment is a theme mentioned repeatedly in the latest IES, with a focus on attracting “high-quality” talent from overseas. Perhaps unsurprisingly given the government’s aim of controlling immigration to the UK, the aim seems to be to maintain the UK’s stellar reputation as a study destination without seeing the same post-pandemic surge in numbers. The Home Office is implicitly involved as guardians of the new BCA metrics to which sponsors must adhere, but it remains to be seen if the previous disconnect between the UKVI and the national education exports strategy has been resolved.
10. Qualifications are a valuable export for the UK In keeping with a renewed government focus on skills after the publication of the post-16 education and skills paper last year, the IES hones in on the value of UK qualifications abroad. It also wants to open up new markets overseas by benchmarking international credentials against UK standards.
by Jackie Mader, The Hechinger Report January 21, 2026
To an untrained eye, the “gross motor room” at the Edgerley Family Horizons Center in Boston looks like any other indoor gym for preschoolers. There are mats on the floor, large foam blocks, shapes and stairs to play with and climb on, fabric swings hanging from the ceiling and sensory boards attached to the walls, covered with various materials that provide touch-based activities.
But this room was thoughtfully designed to be much more than a play space: It includes features meant to support emotional development and provide a calming place for children experiencing big feelings. For example, the cocoon swings provide a “hug” feeling that helps children relax. The blue lights above promote a sense of peace. And the soft foam tunnel gives children a place to hide when they need a break. The teachers are also specifically trained to foster feelings of safety and trust, and to reduce child stress.
At Edgerley, which is run by the nonprofit Horizons for Homeless Children and serves more than 250 children ages 2 months to 5 years old, there’s a need for this resource. All the children who are enrolled have experienced or are experiencing homelessness, which for kids, can lead to difficulty regulating emotions, ongoing health issues and developmental delays.
Over the past few years, infant and toddler homelessness has increased in nearly every state. Nearly half a million of the country’s youngest children are living in shelters, in overcrowded homes with other families, or sleeping in temporary spaces, like cars or hotels. At the same time, fewer of these children are enrolled in early learning programs like the one at Edgerley. Such programs, with their enriching environments and stable teachers, can help buffer the effects of homelessness on young children and their growing brains. I recently traveled to Boston to learn more about the early learning program run by Horizons. My story, which also looks at what other cities and states are doing to help these families, was published last weekend with The Boston Globe.
This story about homeless kids was produced by The Hechinger Report, a nonprofit, independent news organization focused on inequality and innovation in education. Sign up for the Hechinger newsletter.
This <a target=”_blank” href=”https://hechingerreport.org/homeless-kids-get-special-treatment-at-boston-area-child-care-center/”>article</a> first appeared on <a target=”_blank” href=”https://hechingerreport.org”>The Hechinger Report</a> and is republished here under a <a target=”_blank” href=”https://creativecommons.org/licenses/by-nc-nd/4.0/”>Creative Commons Attribution-NonCommercial-NoDerivatives 4.0 International License</a>.<img src=”https://i0.wp.com/hechingerreport.org/wp-content/uploads/2018/06/cropped-favicon.jpg?fit=150%2C150&ssl=1″ style=”width:1em;height:1em;margin-left:10px;”>
On Jan. 7, the House Oversight Committee approved a subpoena for Seth Harp, an investigative journalist and contributing editor at Rolling Stone, for posting information about a Delta Force commander. Congress has broad authority to issue subpoenas. But it must show far more restraint when aiming them at journalists without any evidence of wrongdoing.
In early January, Harp reposted a screenshot identifying a commander involved in the U.S. capture of Nicolás Maduro, Venezuela’s former dictator. X reportedly locked Harp’s account until he deleted the post. The House Oversight Committee then voted to approve a subpoena “for leaking classified information.” Republican Rep. Anna Paulina Luna of Florida’s 13th congressional district, who introduced the motion to subpoena Harp, said, “Putting a service member and their family in danger is dishonorable and feckless. Leaking classified information demands explanation and a criminal investigation.”
But publishing the news, even when the news contains classified information, is exactly the role of a journalist. And Rep. Luna did not cite any evidence that Harp broke the law to obtain the information.
Can Congress subpoena Harp over his reporting?
Congress has a broad subpoena power, subject to some constitutional limits.
Congress does have broad investigative authority tied to its legislative power, and subpoenas are a standard tool of that authority. It cannot investigate without the ability to compel people to share information.
But that authority still has limits. In Watkins v. United States(1957), a McCarthy-era congressional subpoena case, the Supreme Court held that while it is “unquestionably the duty” of citizens to cooperate with such subpoenas, the power to issue subpoenas at all “assumes that the constitutional rights of witnesses will be respected by the Congress as they are in a court of justice. The Bill of Rights is applicable to investigations as to all forms of governmental action.” The First Amendment prohibits government retaliation for engaging in protected speech. So under Watkins’ rationale, Congress should not subpoena a journalist merely because it dislikes their reporting.
If Congress abuses its subpoena power, will courts stop it?
In practice, the Speech or Debate Clause weakens Watkins’ constitutional limit on congressional subpoenas.
Even after Watkins, abusive congressional subpoenas are difficult to preemptively fight in court. One reason is the Speech or Debate Clause, which gives members of Congress immunity for legislative acts or statements, including subpoenas.
In Eastland v. U.S. Servicemen’s Fund (1975), the Senate investigated the defendant organization (including a subpoena for bank records) after it distributed anti-Vietnam war publications to the military. When the Servicemen’s Fund challenged the subpoena all the way to the Supreme Court, the Court held that the subpoena fell within Congress’s “legitimate legislative sphere” of investigating the “effect of subversive activities.” Because the committee acted within its investigatory powers, the Court concluded, the Speech or Debate Clause immunized the committee and its staff from suit. The subpoena remained on the books.
Eastland thus stands for the proposition that courts may not “look behind” a subpoena for constitutionally improper motives. It would be unconstitutional for Congress to investigate a nonprofit’s bank accounts, or a reporter’s sources, based on First Amendment-protected expression. But so long as Congress can prove it acted within the bounds of its power, any remedy for the constitutional violation must be found outside the courts.
Even if Congress can use its subpoena power to end-run around the First Amendment, should it?
Standardless subpoenas against reporters risk chilling journalism.
Even when Congress has facially legitimate (if arguably pretextual) grounds for its investigation, forced investigative questioning is a direct threat to the conditions that make journalistic inquiry possible. Freedom of the press — and of speech — requires the ability to pursue knowledge and ideas without fear of retribution. Otherwise, our knowledge grows stale, and our ability to assess the truth trends toward the state’s mandated line. As the Supreme Court noted in Sweezy v. New Hampshire(1957), “scholarship cannot flourish in an atmosphere of suspicion and distrust.” Replace “scholarship” with “protesting” or “reporting,” and the principle remains the same.
Floyd Abrams, who has spent his career litigating press cases, puts it plainly — such legal battles “cost an enormous amount of money, have enormous disruptive effects” and represent “an institutional threat to the behavior of a newspaper.” Subpoenas signal to sources that talking to the press could put them under a governmental spotlight. They force reporters and editors to ask: This story is accurate, but can we afford the cost of printing it?
FIRE’s recent work shows that when Congress goes overboard with investigations, it can scare people into silence — even when their speech is perfectly legal. Tyler Coward, lead government counsel at FIRE, condemned congressional investigations into student groups and nonprofits associated with pro-Palestine protests as “fishing expedition[s]” based on groups’ viewpoint.
Likewise, John Coleman, legislative counsel at FIRE, criticized the House’s investigation of Stanford researchers studying “misinformation.” Targeting protected academic inquiry might serve some legitimate congressional objective, Coleman argued, but such investigations deter future inquiry. For reporters, the same lesson is obvious: even if a subpoena is ultimately narrowed or withdrawn, if you want to avoid the risk, avoid the subject.
The issuance of speech-chilling subpoenas knows no partisan bounds, either. Republicans led the investigations into pro-Palestine groups and Stanford researchers. But in 2021, the House Select Committee on January 6th — chaired by Democratic Rep. Bennie Thompson — subpoenaed a photojournalist’s phone records from Verizon. At the time, the Reporters Committee for Freedom of the Press called on Thompson to withdraw the subpoena, calling it a “direct threat to newsgathering.” In Seth Harp’s case, the House Oversight Committee’s top Democrat, Rep. Robert Garcia, supported Rep. Luna’s motion to subpoena, and it was approved unanimously.
If courts are unlikely to stop Congress, who will protect journalists?
Even if constitutional, Congress should refrain from issuing standardless subpoenas against journalists.
Despite the fact that the Speech or Debate Clause largely immunizes Congress when it issues subpoenas, Congress has an independent obligation to follow the Constitution. Recall that Eastland held that courts may not “look behind” a subpoena to test whether the real aim was retaliation or harassment. Facially legitimate subpoenas will stand, even if they’re arguably illegal. That means Congress itself is the main check on subpoenas meant to retaliate against or harass reporters. And Congress must better police its subpoena process — otherwise it imperils not only our free press, but also free speech and our collective pursuit of truth and knowledge.
Congress should keep Watkins in mind when crafting subpoenas. At a base level, that means Congress should not issue subpoenas to journalists for merely reporting the news. Beyond that, Congress should ensure that there are no other means to obtain the requested information. It should tailor requests to avoid sweeping in things like sources, editorial deliberations, or other discussions essential to the newsgathering process. These suggestions are modest but vital institutional firewalls against congressional abuse of its oversight power.
The public cannot be informed — cannot check officials, evaluate policy, or hold politicians accountable — without strong protections for the press freedom to share information and to criticize without retaliation. Alexander Hamilton warned that constitutional safeguards are often not enough. The freedom of the press, he wrote in Federalist No. 84, rested not in “fine declarations” but rather in the “general spirit of the people and of the government.”
Congress must take it upon itself, in Harp’s case and others, to embody that spirit of a free press and refrain from investigating journalists for merely doing their job.
Google Analytics 4 (GA4) has reshaped how colleges and universities track prospective student behaviour online. With the retirement of Universal Analytics (UA) in 2023, GA4 is now the default analytics platform, and for many higher ed marketers, the transition has been disorienting. Gone are the familiar sessions and pageviews; in their place is an event-based model, a redesigned interface, and new metrics that require a shift in thinking.
But while the learning curve is real, so are the opportunities. GA4 offers deeper insights into student intent, behaviour, and engagement, insights that, when used effectively, can support measurable enrollment growth.
This guide breaks down GA4 in a practical, approachable way. We’ll walk through how to use its core features at each stage of the student recruitment funnel: Discovery, Engagement, Decision-Making, and Enrollment. You’ll learn which reports matter, which metrics to ignore, and how to use GA4’s exploration tools to uncover new conversion opportunities. Throughout, we’ll also highlight how Higher Education Marketing (HEM) can help you make the most of GA4, from free audits to CRM integration support.
Let’s start by shifting our perspective on what analytics can do, and then dive into how GA4 can support every phase of your student journey.
GA4 unlocks powerful enrolment insights.
Turn student journey data into smarter recruitment decisions with HEM.
GA4’s Event-Based Mindset vs. Universal Analytics
The most significant shift from Universal Analytics (UA) to Google Analytics 4 (GA4) is the underlying measurement model. UA was centred on sessions and pageviews, essentially counting a sequence of “hits” during a user’s visit. GA4, by contrast, is entirely event-based. Every interaction, whether it’s a pageview, a button click, a form submission, or a video play, is captured as an event. This model allows for a more flexible, granular view of user behaviour across devices and platforms, reflecting the idea that “everything is an event that signals user intent.”
What makes GA4 different from Universal Analytics for higher ed marketers? Higher ed marketers accustomed to UA’s pageviews and sessions are now confronted with a new event-based model, a slew of unfamiliar reports, and an interface that looks nothing like the old Google Analytics. GA4 offers richer insights into student behaviour and intent, which can directly fuel enrollment growth.
Crucially, GA4 is built for today’s privacy-first, multi-device world. It can track a single user’s journey across devices using User IDs or Google Signals and relies less on cookies, instead using machine learning to fill in data gaps, helping you stay compliant with emerging privacy standards.
For higher ed marketers, this opens up richer insight into the prospective student journey. GA4 for student recruitment automatically tracks many common interactions (like scrolls and file downloads) and lets you define custom events aligned to your goals.
New metrics also reflect this shift. Engagement Rate replaces bounce rate, highlighting sessions that last 10+ seconds, include 2+ pageviews, or trigger a conversion. Other core metrics include Engaged Sessions per User and Average Engagement Time, which are helpful indicators of whether your content holds attention or needs refinement.
GA4 also brings predictive capabilities. With built-in machine learning, it can surface emerging trends or flag anomalies in student behaviour. While some advanced features like Predictive Metrics may feel out of reach initially, knowing they exist helps future-proof your analytics approach.
It’s true, GA4 isn’t just an upgrade, it’s an entirely new platform. Many familiar reports have been retired or redesigned, and the interface now favours customizable dashboards over static reports. But don’t let the overhaul overwhelm you.
The key is to focus on the metrics that support your enrollment goals. In the next section, we’ll show how GA4’s event-based model aligns with each stage of the student journey, from first visit to application.
If you need support getting started, HEM offers a free GA4 audit to help identify top-performing lead sources, evaluate your marketing ROI, and ensure your setup is recruitment-ready.
Mapping GA4 to the Student Journey Stages
Every prospective student moves through distinct phases on the path to enrollment. GA4 can provide actionable insights at each stage if you know where to look. Below, we break down how to use GA4 effectively across the four stages of the student journey: Discovery, Engagement, Decision-Making, and Enrollment. We’ll also highlight key metrics to prioritize and reports you can skip to avoid analysis paralysis.
Stage 1: Discovery: Awareness & Early Interest
What it is: At this stage, prospective students are just beginning to explore postsecondary options. They may land on your site via a Google search, a digital ad, or a social post. They’re not ready to apply yet, but they’re starting to investigate. Your goal is to attract the right audiences and create a strong first impression.
What to use in GA4: Focus on the Acquisition reports under Life cycle > Acquisition:
User Acquisition Report Shows how new users first arrive, by channel, campaign, or source. This answers, “Where are our new prospects coming from?” and helps assess brand awareness performance.
Traffic Acquisition Report Tracks sessions from all users (new and returning). Use it to evaluate which traffic sources deliver engaged sessions and prompt interaction.
Key metrics to monitor:
Engaged Sessions per User: Are visitors exploring more than one page?
Engagement Rate: What percentage of sessions include meaningful interaction?
Event Count per Session: Are users watching videos, downloading brochures, or clicking calls-to-action?
These metrics reflect traffic quality, not just quantity. For example, if organic search traffic has a 75% engagement rate while paid social sits at 25%, that’s a clear sign of where to invest.
Landing Pages: Your Digital First Impression Check Engagement > Pages and Screens to see which pages users land on most. Are your program or admissions pages pulling in traffic? Are they generating long engagement times? That’s a signal they’re working. If top landing pages show low engagement, it’s time to refine content, CTAs, or UX.
What to skip:
Demographics and Tech Reports: Too broad to act on for now.
Real-time Report: Interesting, but not useful for strategic planning.
Pro tip: HEM’s free GA4 assessment can help you identify your highest-quality channels and flag low-performing ones so you can optimize marketing spend and attract better-fit prospects.
Once prospective students are aware of your institution and begin browsing your site in earnest, they enter the engagement or consideration stage. Here, they’re comparing programs, evaluating fit, and building interest, but may not yet be ready to contact you. Your goal is to nurture their intent by providing relevant content, encouraging micro-conversions, and guiding them toward decision-making.
GA4 Focus: Engagement & Behaviour Reports
In GA4, shift your attention to the Engagement reports under Life cycle > Engagement. These include:
Pages and Screens
Events
Conversions
Landing Pages
As HEM notes, “Engagement reports are all about what prospects do after landing on your site”, whether they go deeper or drop off.
1. Pages and Screens Report
This is your new “Top Pages” view. Use it to identify high-interest pages such as:
Program descriptions
Tuition and aid
Admissions criteria
Campus life
Key metrics:
Average Engagement Time
Conversions per Page
User Navigation Paths (Where users go next)
If your BBA program page has high engagement and links to “Schedule a Tour,” make sure the CTA is prominent and functional. If engagement is low, revise the content or layout.
2. Events Report
GA4 automatically tracks events like:
Scroll depth (90%)
File downloads
Outbound clicks
Video plays
You should also configure custom events for micro-conversions, such as:
“Request Info” form submissions
Brochure downloads
“Schedule a Visit” or “Start Application” clicks
These are the mid-funnel signals that indicate increasing interest. Mark them as Conversions in GA4 to elevate their importance in reporting.
Pro tip: Track 3–5 key events that correlate strongly with application intent.
3. Conversions Report
Once key events are marked as conversions, the report will show:
Total conversions by event type
Event frequency over time
Value (if assigned)
This helps determine which micro-conversions are driving engagement and which campaigns or pages are most effective.
4. Path Exploration
GA4’s Explorations > Path Analysis lets you visualize what users do after key pages or events. For example, if many students visit the “Admissions FAQ” after reading a program page, that suggests rising intent. Use this to improve internal linking and user flow.
What to Skip
Avoid advanced GA4 reports like:
Cohort Analysis
User Lifetime
User Explorer
These are often too detailed or irrelevant for short-term funnel optimization. Also, don’t feel obligated to use every Exploration template; build your own around your specific enrollment steps instead.
HEM Insight: Unsure if your GA4 is tracking these mid-funnel behaviours correctly? HEM offers audits, event configuration, and CRM integration support, ensuring that when a student requests info, that action is tracked, stored, and acted upon.
Ready for the next stage? Let’s move on to how GA4 supports Decision-Making.
Stage 3: Decision-Making: High Intent & Lead Conversion
In the decision-making stage, prospective students move from casual interest to serious consideration. They’re comparing programs, costs, outcomes, and culture. By now, they’ve likely returned to your site several times. The goal here is clear: convert an engaged visitor into a lead or applicant.
GA4 Focus: Conversion Tracking & Funnel Analysis
This is where your earlier GA4 setup pays off. With key conversion events (e.g., “Request Info,” “Submit Application”) defined, you can now analyze how and where those conversions happen. GA4’s Traffic Acquisition, Explorations, and Conversions tools are central at this stage.
Conversions by Source/Medium
To understand which marketing channels drive high-intent actions, use the Traffic Acquisition report and add columns for specific conversions (e.g., “Request Info count” and conversion rate). Alternatively, build an Exploration with source/medium as the dimension and conversion events as metrics.
HEM’s webinar emphasizes looking beyond raw volume: ask “Which sources deliver my highest-intent leads?” For example:
Organic Search: 30 info requests, 10 applications
Paid Social: 5 info requests, 0 applications
This data helps optimize channel strategy. If certain channels underperform in lead quality, revisit targeting, messaging, or landing pages.
Funnel Exploration
GA4’s Funnel Exploration is ideal for visualizing conversion paths. You can define steps like:
View Program Page
Click “Request Info”
Submit RFI Form
Start Application
Submit Application
Example funnel insight:
1,000 users view program pages
200 click “Inquire” (20%)
50 submit forms (25% of clicks)
30 start applications
20 submit applications (67% of starters)
This highlights where friction occurs, perhaps a clunky form (25% completion) or weak CTAs (20% inquiry rate). Use this to improve form UX, reinforce CTAs, or add nurturing touchpoints.
You can also segment student recruitment funnels by device or user type (e.g., international vs. domestic). If drop-off is worse on mobile, consider layout changes; if international students abandon applications, address barriers like unclear visa info.
Path Exploration
GA4’s Path Exploration can show common user journeys leading to conversion. Start with “Application Submitted” and trace backward. If scholarship pages, FAQs, or department overviews frequently appear in these paths, you’ve identified key conversion content.
Conversely, if users loop across pages without converting, that may signal confusion. Use these insights to surface critical info sooner or rework unclear sections.
User Explorer: Qualitative Insights
While not scalable, inspecting User Explorer for select journeys (e.g., converters vs. non-converters) can offer qualitative insight. One user might watch webinars and return five times before applying, proving content value. Others bounce after one visit, highlighting the need for nurturing.
Metrics That Matter
Focus on:
Conversion counts and rates per channel and funnel stage
Engaged sessions per user
Average engagement time for converters
Example: applicants average 5 sessions and 10 engagement minutes; non-converters average 1 session and 2 minutes. Clearly, repeat engagement correlates with conversion, and nurturing campaigns (email, retargeting) are essential.
What to Skip
Avoid getting distracted by:
Cohort Analysis or User Lifetime
Attribution modelling (unless you’re running major ad campaigns)
Default GA4 templates that don’t fit your student recruitment funnel
Stick with the custom funnel and path reports that reflect your application process.
Pro Tip: Not confident in GA4 setup? HEM’s experts can build your funnels, configure conversion tracking, and connect GA4 to your CRM, giving you clear, enrollment-focused dashboards and team training to act on the insights confidently.
Stage 4: Enrollment: Application to Enrollment (Bottom of Funnel)
The enrollment stage is the final stretch, transforming applicants into enrolled students. While much of this process shifts to admissions and offline workflows (e.g., application review, acceptance, deposit), digital analytics still play a critical role. GA4 helps marketing teams identify friction points, evaluate channel performance, and inform efforts that influence yield. It also closes the loop on campaign effectiveness, especially if tied to downstream outcomes.
GA4 Focus: Funnel Completion, Attribution, and Post-Application Insights
Application Funnel Completion
Using Funnel Exploration, ensure your funnel captures key milestones like “Apply Clicked” and “Application Submitted.” If many click “Apply” but few complete the form, GA4 highlights a clear drop-off. For instance, if desktop converts at 30% but mobile only 10%, there may be UX issues on mobile or a third-party form that isn’t optimized. This insight can guide IT discussions or quick fixes (e.g., warning banners or responsive design improvements).
Attribution Paths
GA4’s Advertising > Attribution > Conversion Paths report reveals the sequence of marketing touches that lead to applications. Common patterns in higher ed include:
Organic Search → Direct → Conversion
Paid Search → Organic → Direct → Conversion
Email → Direct → Conversion
These paths underscore that enrollment isn’t a single-touch journey. For instance, Organic Search may start the process, while Direct or Email closes it. If you frequently see Email leading to conversions, it validates your nurture sequences. Also, keep an eye on new referral sources, like “Chat” or “Perplexity”, which may signal traffic from AI tools, as teased in HEM’s presentation.
Post-Application Engagement
Some schools track events beyond submission (e.g., clicking an admitted student portal link, viewing housing or financial aid info). While GA4 may not capture yield or melt directly, it can show post-application interest signals. Continued engagement, like visiting tuition or residence life pages, suggests intent to enroll or lingering questions that marketing content can address.
Benchmarking and Outcomes
Use GA4 to evaluate ROI by channel. For example, if Paid Search generates 10 applications at $5,000, while Organic Search drives 30 at no direct ad cost, that’s a critical insight. While GA4 doesn’t include media spend (unless connected to Google Ads), you can overlay cost data offline to calculate rough efficiency.
You can also segment Applicants vs. Non-Applicants using GA4’s Explorations. Let’s say applicants averaged 8 sessions while non-applicants averaged 2. That suggests high engagement correlates with conversion, reinforcing the value of remarketing, email campaigns, and sticky content.
Research supports this: EAB found that highly engaged users (multiple sessions, longer duration) were significantly more likely to apply.
What to Skip
Once a student applies, most enrollment decisions move to CRM or SIS platforms, not GA4. Don’t expect GA4 to tell you who enrolled, who melted, or who was denied. Similarly, ignore reports like Predictive Metrics, User Lifetime, and Cohort Analysis, which are less actionable for enrollment marketing. Focus instead on your core funnel, attribution, and engagement data.
Final Takeaway
By now, your GA4 setup should illuminate your recruitment funnel: how students find you, how they behave, when they convert, and where they fall off. This data is crucial for optimizing spend, improving user experience, and shaping strategic decisions.
Priority GA4 Reports:
Traffic & User Acquisition (channel quality)
Pages and Screens (top content, engagement)
Events & Conversions (key actions)
Funnel & Path Explorations (journey analysis)
Attribution Paths (multi-touch influence)
Reports to Skip:
Demographics & Tech (unless troubleshooting)
Realtime (not strategic)
Cohorts, LTV, Default Templates (too advanced or unfocused)
Pro tip: HEM can help you build enrollment-specific GA4 funnels, connect data to your CRM, and surface dashboards that show “visits → inquiries → apps → yield” at a glance, so you can finally act on your data with confidence.
Real-World Examples: GA4 Insights Driving Enrollment in Higher Ed (from various colleges & universities)
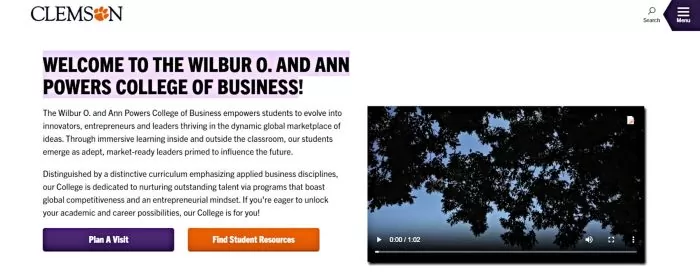
Clemson University (College of Business) Clemson’s Wilbur O. and Ann Powers College of Business leveraged targeted digital campaigns and GA4 event tracking to dramatically increase prospective student engagement.
The college saw a 207% increase in page engagement and a 222% growth in program page views for a key graduate program after the campaign. In just a two-month push, GA4 recorded 498 users requesting information and 44 clicking “Apply” to begin their applications.
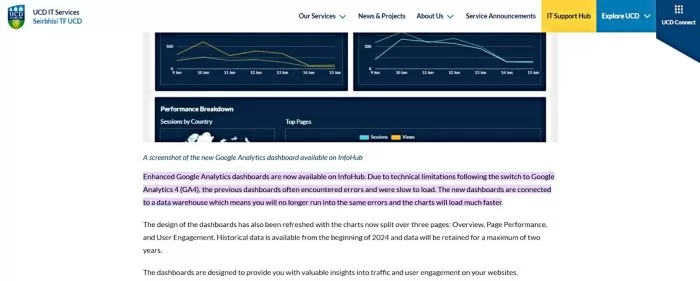
University College Dublin (UCD). This university fully transitioned to GA4 and implemented a unified analytics dashboard via a data warehouse for all its websites. The new GA4-powered reporting interface, featuring Overview, Page Performance, and User Engagement reports, loads much faster and retains up to two years of data.
This enables UCD’s faculties and departments to easily track user behaviour across the university’s web presence, gaining insights into what content is engaging visitors and where improvements can be made.
Boise State University. Boise State created a centralized GA4 “Comprehensive Dashboard” accessible to campus stakeholders and paired it with training tutorials on common GA4 tasks. Their web team produced self-paced video guides on how to filter GA4 data to answer specific questions (such as finding top pages, viewing traffic sources, or seeing visitor geolocation).
This approach empowers individual departments to slice the raw GA4 data for their own needs and quickly get answers about user behaviour, for example, identifying the most popular pages or where visitors are coming from, without needing advanced technical skills.
UC Riverside. UC Riverside moved all its many departmental and unit websites to GA4 under a centralized analytics structure. The university’s web team built a curated “Web Analytics for Campus Partners” GA4 dashboard with custom reports, including a Broken Links report and a Top Landing Pages report.
These tailored GA4 dashboards help site owners across campus quickly spot issues (e.g. finding and fixing 404 error pages) and identify content that attracts new traffic. By giving each department actionable insights, such as which pages are bringing in the most new visitors, UCR has improved user experience and informed content strategy across dozens of sites in its domain.
Texas A&M University. Texas A&M established an Analytics Community of Practice that meets monthly, bringing together marketers and communicators from different colleges and units to share GA4 insights and techniques.
In these sessions, participants discuss recent findings (for example, which pages on their sites show unusually high engagement rates, or how referral traffic patterns are shifting) in a collaborative forum. This ongoing knowledge exchange ensures continuous learning and helps cultivate a data-informed culture campus-wide.
Embracing GA4’s event-based, student-centric model can reshape how your team drives recruitment outcomes. By moving beyond vanity metrics like pageviews, GA4 prompts higher ed marketers to focus on real indicators of student intent, such as engaged sessions, application clicks, and program page sequences. Across each funnel stage, GA4 reveals which channels attract interest, what content sustains it, and which actions convert it.
This clarity empowers you to refine campaign targeting, improve website performance, and simplify the inquiry or application path. GA4 also bridges the long-standing gap between marketing and admissions by giving both teams shared metrics and a common funnel narrative. Instead of saying, “We got 10,000 visits,” marketing can report: “We drove 300 info requests and 50 applications, and here’s what influenced them.”
It’s true, GA4 can feel overwhelming at first. But by focusing on core engagement metrics, key conversion events, and simple funnel analyses, you can avoid the noise and surface what truly matters. Start small, then grow into more advanced insights as you gain confidence. What should higher ed marketers avoid focusing on in GA4? Don’t worry if GA4 isn’t tracking beyond the application.
Also, avoid misattributing things to GA4 that it can’t measure – e.g., GA4 won’t tell you ‘admitted vs. denied’ or ‘enrolled vs. melt’ – that’s outside its scope. Focus on what GA4 can concretely tell you about the marketing funnel leading up to enrollment.
Above all, GA4 is most powerful when used collaboratively. Share funnel data with admissions. Highlight high-performing content to your copy team. Use insights to inform international recruitment or retargeting campaigns. And if needed, partner with specialists. At HEM, we help institutions build clear, actionable GA4 setups, from audits and event tracking to CRM integrations, so your analytics directly support enrollment.
GA4 isn’t just an upgrade; it’s a strategic advantage. When aligned with your funnel, it can become your most effective tool for enrollment growth.
GA4 unlocks powerful enrolment insights.
Turn student journey data into smarter recruitment decisions with HEM.
FAQs
What makes GA4 different from Universal Analytics for higher ed marketers? Higher ed marketers accustomed to UA’s pageviews and sessions are now confronted with a new event-based model, a slew of unfamiliar reports, and an interface that looks nothing like the old Google Analytics. GA4 offers richer insights into student behaviour and intent, which can directly fuel enrollment growth.
What should higher ed marketers avoid focusing on in GA4? Don’t worry if GA4 isn’t tracking beyond the application. Also, avoid misattributing things to GA4 that it can’t measure, e.g., GA4 won’t tell you ‘admitted vs. denied’ or ‘enrolled vs. melt’, that’s outside its scope. Focus on what GA4 can concretely tell you about the marketing funnel leading up to enrollment.
Which GA4 reports should we prioritize for enrollment marketing? Focus on the critical reports:
Traffic Acquisition & User Acquisition (for awareness channel quality)
Engagement > Pages and Screens (for top content and engagement per page)