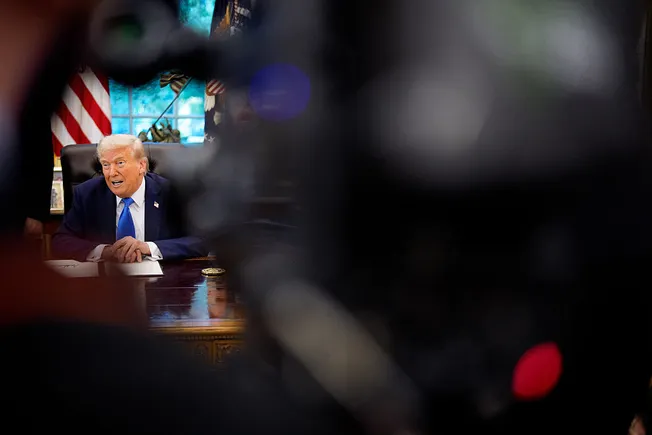
Tag: college

  • College of Western Idaho Boosts Enrollment and Retention with Data-Driven Solutions

    College of Western Idaho Boosts Enrollment and Retention with Data-Driven Solutions

    In late 2021, the College of Western Idaho (CWI) needed to address a consistent enrollment decline and improve student retention. With an ambitious vision to improve and optimize its technological infrastructure and student outreach, CWI sought to build a best-in-class system to enhance student engagement and elevate enrollment strategies. To ensure that data and technology were aligned with CWI’s growth objectives, the college partnered with Collegis Education to analyze their combined impact. Were its data and tech aligned for impact, or were gaps hindering progress and creating unnecessary burdens across the team?

    Key Takeaways

    • Six consecutive terms of YoY enrollment growth
    • Experienced the highest YoY increase in persistence in history of the college from Fall 2022 to Fall 2023
    • Consistent improvement in term-over-term retention

    CHALLENGES:

    • Declining enrollment
    • No established retention strategy
    • Lack of CRM
    • Underutilized LMS
    • Siloed technology and data systems

    SOLUTIONS:

    • Connected Core®
    • Advanced analytics + business intelligence
    • LMS support
    • Website optimization
    • Data-driven outreach and support for students identified as at-risk

    Strategy

    Collegis Education and CWI began collaborating on building a best-in-class student journey from the point of initial inquiry through graduation.

    A comprehensive evaluation of existing CWI systems allowed Collegis to assess the college’s digital readiness, technology infrastructure, and enrollment ecosystem to understand how they aligned with its growth objectives. The partnership quickly proceeded from consultation to implementation.

    Collegis prescribed a set of solutions to enhance student engagement from first contact and elevate the school’s enrollment strategies:

    • Connected Core® to unite siloed systems, data sets, and other enrollment technologies, providing more accurate, actionable, unified institutional intelligence with clear visualizations to support data-enabled decision-making at all levels.
    • Website optimization to improve conversion and deliver a student-centric digital experience that supports the objectives, goals, and mission.
    • Prospective student nurturing campaigns with a messaging protocol designed to drive conversion and prospective student engagement with CWI.

    Collaborating closely with CWI, Collegis developed a well-defined student retention strategy that established meaningful student-advisor relationships early on, ensuring students felt supported from their first interaction onward.

    • Enrollment conversation training gave student-facing staff the tools to drive positive experiences for CWI learners while embracing a liaison approach to student engagement.
    • Collegis student success coaches conducted proactive outreach to engage students while leveraging an at-risk alert system to drive intervention. This early alert system flags students needing support based on learning management system (LMS) data on attendance, current grades, and assignment completion.

    Results: Average YoY growth each semester since our partnership began has averaged 5%

    By working with Collegis, CWI could focus on its student journey and how it could better use data and technology to deliver superior student engagements and reach its growth targets. This has helped not only stop, but reverse historical enrollment declines. In 2024, CWI projected year-over-year growth for the sixth consecutive academic term. The school has achieved an average year-over-year term growth of 5%, with a trendline for fall 2024 of over 9% growth.

    “Our partnership with Collegis has provided expertise, speed, and flexibility in areas where we, as an institution of higher education, have been unable to improve so nimbly.  Where most consultants provide an analysis and leave, Collegis follows through with ‘and this is how we’ll make that happen for you’.  Trusting their recommendations is easy because I know they are signing themselves up to do the work with me.”

    Tyler Brown, Associate Vice President Enrollment & Student Services, College of Western Idaho

    Value-based conversations with prospective students have resulted in increased applications. Further, pre-start engagement from the advising and student success coaching teams has increased registrations from admitted students.

    By fostering a culture of meaningful interaction and support for students, CWI paved the way for improved student retention. The LMS-based at-risk model has driven 19,000+ proactive student engagements and interventions in one academic year.

    Within just one year of implementing these targeted strategies, CWI witnessed a remarkable in retention rates, all while alleviating the workload on faculty and staff.  Similar retention strategies deployed by other Collegis partner institutions have yielded term-over-term retention rates exceeding 90%, underscoring the effectiveness of our approach.

    Whenever we want to try something new or have a challenge we need help with, my first thought now is let’s call Collegis and see if this is something they can help us with.”

    Denise L. Aberle-Cannata, Provost, College of Western Idaho

    With a proven retention strategy and access to a proactive model, CWI can now build out its internal retention capabilities and plans to take over the student success coaching function.

    The Future

    CWI’s commitment to embracing change and being agile is demonstrated by the school’s evolving partnership with Collegis to exceed industry best practices and realize sustained growth. Ongoing services and incremental work are targeting LMS initiatives to stabilize, standardize, optimize, and transform CWI’s instance of Blackboard Learn and redesign its new student orientation, among other things.

    Source link

  • Busting Roadblocks in the Community College Enrollment Cycle

    Busting Roadblocks in the Community College Enrollment Cycle

    Top Student Enrollment Roadblocks and How to Overcome Them

    In my more than two decades of steering enrollment management at various institutions, I’ve seen students encounter numerous hurdles on their journey to and through higher education. 

    My experience has consistently shown that the decision to enroll is heavily influenced by four critical factors: 

    Understanding these priorities is critical to attracting and retaining students in the community college space. By aligning your enrollment strategies with the needs and expectations of prospective students, you can ensure a smoother, more engaging educational journey that benefits both the students and your educational institution alike. 

    Common Ease of Enrollment Roadblocks for Students

    The pursuit of higher education is a daunting task in itself. When students encounter challenges at the enrollment phase — before the actual coursework even starts — it can be easy for them to bow out of the process altogether. To ensure that doesn’t happen, avoid these common pitfalls in the community college enrollment journey: 

    Complex Enrollment Processes

    Orientation and Information Overload

    Confusing Websites

    Placement Testing Delays

    How to Overcome Ease of Enrollment Roadblocks

    So, those are the potential enrollment roadblocks for community college students. But what are the enrollment solutions? Solutions for overcoming enrollment roadblocks for community college students include the following: 

    Common Clear Path to Graduation Roadblocks for Students

    Now that you’ve mowed down the enrollment roadblocks, it’s time to ensure that the ride stays smooth. Remember, it’s never too late for students to change their direction. They might do so if these issues persist: 

    Course Registration Problems

    Technology Barriers

    How to Create a Clear Path to Graduation

    Constructing a clear path to graduation isn’t easy, and with limited resources, it can be difficult to avert every bump in the road. But in my experience, you can keep most students on track by focusing on these two key areas: 

    Common Reasonable Degree Completion Roadblocks for Students

    You’ve cleared two major hurdles by easing the enrollment process and creating a clear path to graduation. But you’re only halfway home. Here are some common mistakes institutions make when it comes to the time it takes to complete a degree: 

    Inadequate Academic Advising

    Lack of Clear Communication

    Social and Emotional Challenges

    How to Help Students Reach Their Goals in a Reasonable Amount of Time

    When it comes to keeping students on track, intervention is key. Follow these tips: 

    Common Cost/Benefit Roadblocks for Students

    You’ve now reached the last but never the least critical roadblock in higher education: return on investment. It’s why your students are showing up, and if the numbers don’t make sense, they can — and should — turn back. Here are some financial concerns that your students are likely to face: 

    Housing and Transportation Challenges

    Cost of College Data Is Hard to Find

    Ways to Help Students With Their Financial Concerns

    Your institution is responsible for ensuring that students understand their financial obligations and how to meet them. Here are a few ways that you can do this: 

    Bust Down Roadblocks by Partnering With Archer 

    In my 20 years of experience, I’ve helped lots of institutions navigate these potential roadblocks to enrolling and retaining more students. And I’m far from alone in my expertise at Archer. Our full-service team partners with colleges of all kinds to help them build and scale their capacities. 

    Is your institution ready for a collaborative partner who takes the time to get to know you, then makes custom recommendations based on decades of experience? Reach out to us today

    Subscribe to the Higher Ed Marketing Journal:


    Brian Messer

    Brian Messer has over 20 years of experience overseeing all aspects of university administration, including online, operations, academic affairs, enrollment management, marketing, financial management, and human resources and student affairs. Specifically, his extensive experience in scaling marketing and enrollment initiatives in all sectors of nontraditional higher education have contributed to student success and growth at many institutions of higher learning.
    Messer holds a doctorate in higher education administration from Saint Louis University.

    Source link

  • Medical College Admission Data, 2023

    Medical College Admission Data, 2023

    This is a reboot of a visualization I did in 2018, which I found fascinating, but which didn’t get much traffic at the time, and thus, I’ve not refreshed it.  But I still find it compelling and instructive.

    Each year, the Association of American Medical Colleges publishes a lot of data about admission to medical colleges in the US. But frankly, it’s a mess, and takes a lot of effort to clean up and visualize: Each link is a separate spreadsheet, and each spreadsheet has spacer rows and merged cells and lots of stuff that needs to be scrubbed (carefully) before analyzing and visualizing.  So, if you use this work in a professional capacity, I’d appreciate your support for my time, software and hosting costs at this link. As a reminder, I don’t accept contributions from high school counselors, students, or parents who are using the site.  (And if you know anyone at AAMC, tell them raw data would be much appreciated).

    There are seven views here, some of which combine several data sets.  Use the tabs across the top to access the views.

    The first three tabs show similar data, broken out three ways: By undergraduate major, by ethnicity, and by gender for applicants and matriculants. Don’t be afraid to use the filters to get what you want; you won’t break anything, and there is a reset button at the bottom.

    The top chart on these three views shows Total MCAT scores for applicants (blue) and matriculants (purple).  The middle chart shows your choice of GPA, using the filter at the top: Science, Non-Science, and Overall.  And the bottom chart shows sub-scores on the MCAT, again, based on the filter you choose.  Hover over a bar for details. 

    Total MCAT scores range from 472 to 578 with 500 being the mid-score, and each of the four sections–Biological and Biochemical Foundations of Living Systems; Chemical and Physical Foundations of Biological Systems; Psychological, Social, and Biological Foundations of Behavior; and Critical Analysis and Reasoning Skills–is scored from a low of 118 to a high of 132, with a midpoint of 125. Read about them here, whence I shamelessly stole this information.

    The fourth tab shows which undergraduate institutions sent applications to US Medical Schools in what quantity, based on student ethnicity.  Note that the data are not complete, but rather a compilation of five different reports, for colleges sending applications from at least 100 White students, 50 Asian students, 15 African-American students, 10 Hispanic students, or five Native American/Alaska Native students.  A college can be on one list but not another: For instance, the University of Oklahoma is #1 for Native students, but not on the list of institutions sending at least 50 Asian students.

    When you hover over the bars, you can see that institution in larger context, like this:

    The fifth tab gets into the nitty-gritty, and show the distribution of applicants and admits by GPA and MCAT ranges (top two charts), as well as the admission rate (bottom), showing the success of being admitted to at least one medical college.

    The sixth and seventh tabs are simple summaries by first-generation status, and gender over time.

    There is an awful lot of data here, and again, if you have any sway with the AAMC, tell them I’d sign my life away to get raw data in one big file.  As always, let me know what you see here.

    Source link

  • Private college discount rates for first-year students, 2021

    Private college discount rates for first-year students, 2021

    Two quick additions/clarifications to this:  The definition of full-pays is those students who receive no institutional funds.  EM people don’t care where the cash comes from, only the discount.  Second, yes, I know some institutions use endowments to pay for institutional aid.  That percentage is likely very small, although concentrated at a few institutions.

    Before we begin, here is what this post does not do:

    • It will generally not tell you where you can get low tuition, with a very few exceptions.  And when it does, it won’t be at one of “those” colleges.
    • It will not tell you which colleges are likely to close soon, although after the fact, you can probably find a closed college and say, “Aha! Right where I expected it would be!”
    • It will not show you net costs to students.
    • It will not adjust for things like church support, enormous endowments, or the cost of living in that high-priced city where Excellence College or Superior University is located.

    Got it?  Good.

    This will show you the discount rate on first-year students at about 1,000 four-year, private, not-for-profit colleges in 2021-22.  Discount as I define it is the total unfunded institutional financial aid divided by the total charged (gross) tuition and fees.  A university that charges (published tuition and fees times the number of students) $10,000,000 and awards $4,000,000 in aid has a discount rate of 40%.  At most colleges, this discount is simply an accounting transaction, much like a coupon to save a dollar on a sandwich at Subway.  That, of course, is a gross over-simplification of the “what” of discounting, and it doesn’t touch the “why” of discounting at all.  But if you want an explanation, I’ll gladly talk to your trustees for a reasonable fee.

    And there is a difference between discount and net revenue, although at any given tuition charge, the two are perfectly related.  Unfortunately, as  you’ll soon, see, colleges all set their own tuition.  To wit:

    • A college charging $50,000 with a 20% discount has net revenue (the cash you can spend) of $40,000 per student.
    • That same college with a 50% discount has just $25,000 per student.
    • A college charging $30,000 with a 10% discount has $27,000 per student.
    • That same college with a 40% discount has $18,000 per student.

    As a college, you don’t care where the cash comes from: Pell grants, state grants, loans, or the student’s family.  This means, hypothetically, a student with low institutional aid might pay less than one with more aid.  Confused?  Good.

    If you use this with your trustees to explain your own college’s market position, consider supporting my costs of time, hosting and software by buying me a coffee.  Just click here to do so.  If you counsel high school students, or your a parent of a prospective college student, must keep reading and don’t feel any obligation at all.

    Here is the data, in three views.  The first two are box and whisker plots, where half of the colleges fall inside the gray box on each column to show you the middle 50%.

    The first view shows net revenue per freshman student, arrayed by the institution’s Carnegie type.  Use the controls to filter region, highlight region, or highlight an individual college.  To do the latter, type any part of the name in the box, hit enter, and select from the options.  Hover over dots for details; each dot is a college.

    The second view is identical, but it shows discount rate, the number people obsess over while missing the more important net revenue figure.

    The third view shows those two values arrayed, with the same highlighters, allowing you to filter on Carnegie type, or even the percentage of the students who are full-pay (that is, they get no institutional aid at all.)

    You’ll soon see that discount and net revenue don’t seem to be big issues at the big name, strongly endowed institutions.  That’s because, at many of these places, undergraduate education is essentially a sideline business, and only a minor source of revenue.  The money they bring in (or don’t) on this presumably core function of the university is managed to best optimize to reputation or selectivity, or other factors (including, sometimes, mission).

    Note that I’ve done my best to remove some outliers with wild data that throw the charts off.  Many of these are colleges I have never heard of, and they’re tiny.  Others are places with strong religious missions (like Yeshivas or Seminaries) that may be externally funded in ways this can’t account for. 

    Enjoy

    Source link

  • 10 Budget-Friendly Meal Prep Ideas For Busy College Students

    10 Budget-Friendly Meal Prep Ideas For Busy College Students


    10 Budget-Friendly Meal Prep Ideas For Busy College Students


    Source link

  • Online Courses For Transferable College Credit

    Online Courses For Transferable College Credit


    StraighterLine: Online Courses For Transferable College Credit


    Source link

  • Free Community College Available In 31 States

    Free Community College Available In 31 States


    Ditch The Debt: Free Community College Available In 31 States


    Source link

  • How can America Encourage College Dropouts to Complete their Degrees – Edu Alliance Journal

    How can America Encourage College Dropouts to Complete their Degrees – Edu Alliance Journal

    Prelude

    September 6, 2022 by Dean Hoke – The percentage of students without a post-secondary degree in the United States has been a widespread concern for decades. Employment at a decent working wage did exist for those who did not have a degree however that world is quickly changing. This topic has been of interest to me for over 50 years because I am one of those who dropped out of college.

    I started attending university in the Fall of 1968 and it took me until June 1975 to complete my bachelor’s degree. I attended two universities and dropped out twice before coming back and finishing.  I thought in early 1969 when I left the university, I didn’t have the academic ability to get a degree and my university advisor certainly was not supportive and suggested I should go sign up for military service that day.

    I did go back to another smaller university six months later and though I had pauses due to those challenges everyone has in life I finished with a bachelor’s degree six years later. Upon graduation, I started immediately after commencement at a small university in Kentucky as an admissions officer and completed my master’s in a relativity short amount of time while working.

    With that in mind, I have always wondered how we get dropouts back to school and finish their degree. Employers, government, and adults all believe it’s needed, and it has financial benefits for all. Yet nearly 40 million people from the age of 18-64 started higher education and did not complete one degree. I am presenting my initial thoughts and I would ask for your thoughts on how to address this question.

    US Labor Market

    According to the Federal Reserve Bank of Saint Louis, the US Civilian Work Force from 25-34 as of June 2022 has the following educational attainment

    The Harsh Facts on College Dropouts

    American higher education overall has 39 million people with  Some College, No Credential (SCNC) as of July 2020 according to the National Student Clearinghouse Research Center.  The most recent study dated 2017 shows the following:

    • 30% of first-year students drop out before their second year of college.
    • 58.5% of students who started in community college after 6 years have not obtained any degree or certificate (1,071,720 students from students starting in 2011)
    • 32.6% of students who started at a four-year institution after 6 years have not obtained any degree or certificate. (730,556 students starting in 2011)

    According to Forbes Nov. 2021 article titled “Shocking Statistics About College Graduation Rates”

    • Nearly 1 million students drop out each year.
    • More than two-thirds of college dropouts are low-income students, with family-adjusted gross income (AGI) under $50,000.
    • Full-time employment reduces graduation rates.Students who work a full-time job during the school year are half as likely to graduate with a bachelor’s degree, as compared with students who work 12 hours or less a week. Every additional hour of work beyond 12 hours a week reduces graduation rates. Working a full-time job takes too much time away from academics.

    The reasons why are not surprising but still distressing.

    Source: Hanson, Melanie. “College Dropout Rates” EducationData.org, June 17, 2022,

    Economic Impact

    According to the 2020 US Bureau of Labor Statistics, the average wage earned by a person by education level looks like this.

    One statistic that stands out is the percentage of the income difference between a 4-year degree vs a person with a two-year degree person is $19,288 a 38.5% increase.

    As the United States’ employment needs quickly change, industry and government have a pressing need for more qualified workers. In the publication HR Drive titled“Employers are hiring, but 80% say they can’t find skilled candidates”  More than 82% of employers said they’re actively hiring, despite predictions of an economic downturn, according to a survey of 150 HR leaders by Challenger, Gray & Christmas, Inc. 80% of the respondents, however, reported having difficulty finding workers, with 70% identifying skills shortages as the reason.

    It is further reported that 43% of Challenger’s respondents reported that, although they have enough applicants, those applicants do not have the needed skills. Another 43% said they do not receive enough applicants, with 27% noting that candidates who do apply are not qualified. “The labor market remains tight and employers are reporting skills shortages in almost every area, including in STEM, data analytics, human resources, finance, and operations. 

    During the next decade, the need for people with advanced credentials will continue to rise. Corporations have made it clear there is a need for more qualified workers whether it’s via a traditional degree such as a bachelor’s or micro-credentials/badges which verify customized skills. A report by McKinsey projected that more than 100 million workers will need to find a different occupation by 2030. In the United States, for instance, customer service and food service jobs could fall by 4.3 million, while transportation jobs could grow by nearly 800,000. Demand for workers in healthcare and STEM occupations may grow more than before the pandemic.

    How industry addresses the education of employees

    In the 2019 study by the International Foundation of Employee Benefit Plans

    Organizations use different techniques for reimbursing student employees. The most common include:

    • Tuition assistance/reimbursement (63%)
    • In-house training seminars (61%)
    • Attendance at educational conferences (51%)
    • Continuing education courses (50%)
    • Coverage for licensing courses and exams (44%)
    • Personal development courses (35%)

    Looking at tuition assistance the concept by employers is not new and many have had some sort of program in place for well over 10 years.

    The Society for Human Resource Management survey reports tuition assistance programs are an attractive recruiting measure, and most employees are aware of the basic benefit. However, less than 5% percent of employees participate. Of those who participate in the tuition assistance program more than 4 in 10 who are using the benefit to attend graduate school.

    Large corporations such as Starbucks, Target, Walmart, and others have all implemented go-back-to-school incentive programs using various higher institutions schools with an emphasis on online degree institutions.

    Example One – Starbucks

    Starbucks was one of the early adopters. In 2014, Starbucks and Arizona State University (ASU) introduced the Starbucks College Achievement Plan (SCAP), which provided Starbucks’ U.S. employees the opportunity to earn their first-time bachelor’s degree with the company paying for 100% of their tuition.

    in 2021, Starbucks modified the tuition reimbursement benefit by paying all tuition and fees up front, as opposed to reimbursing employees for their out-of-pocket costs later.

    • More than 20,000 Starbucks employees are currently participating in SCAP.
    • The number of employees finishing their undergraduate degrees through SCAP will reach over 8,500, with Starbucks setting a goal of 25,000 graduates by 2025.
    • There are more than one hundred different degree programs offered through the SCAP program, and Starbucks has employees enrolled in all of them.
    • Almost 20% of people who apply to work for Starbucks say that SCAP is a major reason for their decision.
    • SCAP scholars are retained by Starbucks for a 50% longer period than non-participants, and they are promoted at nearly three times the rate of those employees who do not participate

    Example Two – Walmart

     In July 2021 Walmart announced it will pay for full college tuition and book costs at some schools for its US workers, the latest effort by the largest private employer in the country to sweeten its benefits as it seeks to attract and retain talent in a tight job market.

    The program includes 10 academic partners ranging from the University of Arizona to Southern New Hampshire University. Participants must remain part-time or full-time employees at Walmart to be eligible. They have recently dropped a previous $ 1-a-day fee paid by Walmart and Sam’s Club workers who want to earn a degree and will begin to cover the costs of their books.

    Example Three – Target

    Target in August 2021 announced a  fund to support educational courses for its employees. It is similar to the Walmart program. Available to 340,000 full-time and part-time workers.

    • Cover the full cost of select undergraduate degrees, certificates, and certifications for its 340,000 U.S.-based workers.
    • Pay up to $10,000 each year for master’s programs at those institutions.
    • Allow participants to attend one of 40 partner institutions.
    • Invest more than $200 million within the next four years in the program

    However, one of the issues employees are challenged by is tuition remission vs tuition assistance. It is difficult and a deterrent to potential participants to upfront costs.

    Researchers who have studied tuition benefits, including Jaime S. Fall, director of UpSkill America at the Aspen Institute, and Kevin Martin, chief research officer at the Institute for Corporate Productivity, believe that frontline workers might be more likely to participate in these programs if companies moved from “tuition reimbursement” to “tuition assistance” models, where employers pay their portion of education costs upfront. Many lower-income employees—or workers of any kind—can’t afford to float tuition costs for several months while they wait to be reimbursed.

    Despite these new and innovative programs, we still have millions who are not going back to school. While 80% of employees are positive about these benefits only 40% have made any investigation and only 2% have taken advantage.

    Student Barriers include

    • Restricted options by degree, college choice, net cost, upfront payment before receiving reimbursement
    • Lack of knowledge of grants and loans by employers, government, and schools.
    • Student personal issues (living life and family issues)
    • Childcare options and cost
    • Fear of failure,
    • School too far away
    • The older you get the less likely you will return to school

    Paths to Explore by Higher Education, Corporate, and Government

    Each sector is aware of the challenge and trying different approaches to get students dropouts and get a degree.

    Higher Education

    • Private and state-supported regional universities are an asset underutilized
    • Further development and refinement of quality online degree programs to encourage re-enrollment
    • Developing stronger retention programs to reduce the percentage of college dropouts
    • Expansion of Teaching and Learning Centers for their communities
    • Evening and weekend on-campus programs
    • Academic credit for life experience
    • More student-friendly transfer of credits to a new school
    • Easier for students with outstanding bills to send an academic transcript

    Corporate

    • More generous funding for employees to return to school. Going above the $5,200 a year tax deduction
    • The movement to paying tuition in advance by the employer rather than paying tuition in advance by the student
    • Increasing the number of majors a company will financially support
    • Opening the door for employees to have a selection of more universities including accredited private institutions
    • Establishing paid apprenticeship programs
      • An example is the IBM apprentice program which aims to hire more than 400 trainees each year, from software development to data science to human resources. The current estimated cost to the company is $65 million since 2018.
    • Improvement in communicating and encouraging employees to return to school

    Government

    • Increased priority in developing joint partnerships that incentives employment and encourage dropouts to return to school 
    • Increase current state and federal student grants program
    • Establish no-interest loans to encourage students who have previously dropped out to return to complete their undergraduate degree
    • The passing of the National Apprenticeship Act (H.R.447) which is advocated by numerous corporations

    Let me expand on the role of partnerships between government, Corporate and higher education. The development of regional partnerships between government, industry, and higher education is not necessarily new. It has been used with tier one institutions such as Ohio State, the State of Ohio, and local government to entice Intel to establish a major tech center in Central Ohio.

    Another recent bi-partisan proposal was introduced in August, by Rep. Jim Costa (D–Fresno) and co-sponsored by Rep. Bruce Westerman, an Arizona Republican. The bill is aimed toward four-year regional public universities in distressed areas that could receive federal grants of up to $50 million for economic and community development efforts under newly introduced bipartisan legislation.

    In a press conference at Fresno State to unveil new legislation that he will put forward to Congress that would benefit up to 174 universities, Congressman Costa stated “Universities like Fresno State and many universities throughout California, but throughout the country, support community development. “They represent constituencies where we have distressed communities. They support the workforce, leading to faster employment growth, along with a higher per capita income.” 

    Robert Maxim, a senior research associate at Brookings, a think tank based in Washington, D.C.  is an advocate of this type of partnership. “There are way more regional public universities in the U.S. than there are R-1s, our view is that they are really good anchor institutions to route federal investment through. They are a set of institutions that have been historically neglected and deserve a bit more attention and support from the federal government.”

    Conclusion

    I believe we need to prioritize on the group with the best chance of returning and obtaining a degree, the 25-34 age group with some college but no degree. This is 5.7 million of the overall 39 million who started college but did not finish. While we should make available any current or new programs that encourage people to return to school the 25-34-year-olds are the most likely to go back.  

    The United States should emphasize the wider use of partnership programs with government and industry teaming up with state regional higher education institutions and local small town and private colleges and universities would be a valuable asset to all parties.  These schools are scattered in smaller cities across America.  Both regional state institutions and private schools come from the applied teaching traditions Many are in small towns and rural areas in which employees who wish to return for a degree have few options.  The question of cost certainly exists but I believe some form of government/industry/university partnership can effectively address the cost issues. They have space and teaching knowledge and the ability to customize local solutions.

    One final thought and that is the question of will. While cost is a significant issue government, industry and schools must work in unison to get students to return and complete their education. We must remember these are second or in some cases third-chance students. They have failed in their attempts for various reasons. However, these students must overcome the fear of failure.  We must find ways to support and encourage these students to take that leap of faith and believe they can graduate.

    Postscript:

    Graduation day 1975

    I have been asked why did I go back? I worked in a factory and my parent’s deli for 6 months  I felt I needed someone to test me and determine what I should do for the rest of my life. I went to the state employment bureau in my hometown to be skills tested to learn what I was best suited for. After the tests, I sat down with a lady who read the results. She told me with a smile that scared me I needed to go back to college and get a degree. Seeing I was somewhat shocked by her recommendation she stated the test revealed my hand/eye coordination was horrible and if I worked in a factory as my father did, I would seriously hurt myself. I asked her about joining the military and she commented if you went into the military, it better be an officer working behind the lines in military intelligence because I was unlikely to be much of a decent front-line soldier.  As you can see, I graduated, and my proud parents were there for the event. I later in my life suspected the lady at the employment bureau was trying to give me a slap of reality to grow up and use my brain.  


    Dean Hoke is Co-Founder and Managing Partner Edu Alliance a higher education consulting firm located in Bloomington, Indiana and Abu Dhabi, United Arab Emirates. Dean received his Bachelor of Arts degree from Urbana University in Ohio, his Master of Science in Community Development from The University of Louisville, and a graduate of the Wharton School of Business Executive Management program. Since 1975 Dean has worked in the higher education and broadcasting industry, serving in senior leadership roles specializing in marketing, communications, partnerships, online learning and fund raising.

    He currently serves as Chairperson Elect of the American Association of University Administrators , Franklin University and is Co-Host of the Podcast series Higher Ed Without Borders . Dean is actively engaged in consulting projects in international education, branding, business intelligence, and online learning leading projects in the United States, the Middle East, Africa, and Asia. Dean resides in Bloomington, Indiana

    Source link

  • A Review of Complete College America’s ACT Conference (June 2022)

    A Review of Complete College America’s ACT Conference (June 2022)

    In June 2022, I was very excited to attend Complete College America’s ACT: Policy & Action Summit in Louisville, Kentucky. This was my first time visiting Kentucky and everything was beautiful! 

    Apparently, this conference is “where the magic happens. Where ideas come to life, decisions are made, and plans for impact take shape” and this was definitely true. Usually, when I attend a higher education summit, it is just focused on current information and best practices, but this conference took a different turn. It was all about action and implementation.

    Several of the key groups from the Complete College were able to come together and to take action. These groups included: state teams of higher education leaders and policymakers came together. 

    The content was amazing and the conversations were even better.  Our conversations focused on Time to Degree, Corequisite Support, Guided Pathways, and more.

    Here was the schedule:

    Day 1

    Welcome from the CCA President: Dr. Yolanda Watson-Spiva

    Bringing in Those Left Behind in the College Completion Movement

    Continued Progress and New Frontiers

    No Middle Ground – Advancing Equity Through Practice

    ACT I – Start, Stop, Continue

    Day 2

    The Politics of Equitable College Completion

    Equity and Public University Funding

    No Middle Ground – Advancing Equity in All States

    ACT II & III – Policy Recommendation and Development

    Innovation in Systems Change

    New Opportunities for Your Complete College Alliance Team

    I learned so much through this summit and the networking was great. One of the aspects of the conference that served as a highlight for me was the placement of several flags around the room to represent the institutions of each Complete College America member/partner.

    This was evidence of intentional support and success.

    The sponsors for this event included: The Lumina Foundation, the Bill and Melinda Gates Foundation, Ascendium, the Annie E. Casey Foundation, and the Barr Foundation

    ***

    Check out my book – Retaining College Students Using Technology: A Guidebook for Student Affairs and Academic Affairs Professionals.

    Remember to order copies for your team as well!


    Thanks for visiting! 


    Sincerely,


    Dr. Jennifer T. Edwards
    Professor of Communication

    Executive Director of the Texas Social Media Research Institute & Rural Communication Institute

    Source link

  • Using SQ3R to help college students read

    Using SQ3R to help college students read

    When students arrive in college, faculty often make the assumption that they know how to read for comprehension and retention. Unfortunately, and for a variety of reasons, many students are not well versed in how to read for class. In today post, I want to share an excerpt from my book, Teaching for Learning, about how you can use SQ3R to help college students read.

    Photo credit: Marketa

    SQ3R

    Overview

    The SQ3R activity provides a framework for students to better comprehend and retain information from readings assigned for class. Students often read course readings as they would any other text: start at page 1 and read to the end without framing the content, thinking critically about the content, and engaging the content. This IDEA offers a more systematic approach to better study the material while reading (Artis, 2008).

    SQ3R is a five-step process:  survey, question, read, recite, and review. The activity helps students engage with material and improve their processing of the information through framing and reflection. Although the use of these five steps take longer than simply reading a text, the advantages of improved understanding and recall are beneficial for students and they improve the teaching experience.

    Guiding Principles

    SQ3R is built on the foundation of an information processing theory of learning (Newell & Simon, 1972; Tadlock, 1978). This theory suggests that people structure and organize information into systems of meaning. The limitations of learning are frequently attributed to limits on the ability to organize information and by encoding information in a way that facilitates recall. By providing a framework to organize new knowledge, SQ3R helps students develop understanding faster and more efficiently. 

    The activity also makes use of the ways the brain stores and retrieves information using short and long-term recall. The framework of SQ3R encourages students to slow down and spend time on information which activates the processing strengths of particularly long-term memory. By asking questions and encouraging recitation, SQ3R allows students to better store and recall information from course readings.

    Preparation

    Most frequently, the SQ3R activity is completed by the student outside of class as part of assigned readings. Prior to assigning SQ3R, provide the framework for students and also explain why the activity proves useful. Students often complain that this process increases the time it takes to complete the reading and in doing so they often fail to see the value. Providing an understanding of why it works based on the guiding principles above can help students know the value and use the activity (Tadlock, 1978).

    Process

    • Explain the framework of the activity in the class and assign (or suggest) students use it on the readings for homework. The following steps explain the process of the activity.
    • Survey helps students gather the basic structure of the topic presented in the reading including reading the title, headings, graphics, and any text called out such as definitions or objectives. 
    • Question involves turning headings and other main ideas identified in the survey stage into question. Students should then seek answers to the questions as they read. 
    • In the Read stage, students read the text to capture the main ideas as identified in the survey and question stages. The goal is to write down the answers to the questions raised by filling in the main ideas without getting too bogged down by the details. 
    • Next, students Recite material, which assists with concentration and recall. Students look at each of the questions of a section and attempt to answer the question (while covering up their notes).
    • The Review step allows the students to consolidate learning and comprehension by reviewing each of the questions and answers.   

    Pro-tips

    Many students have never been taught how to read texts or study content rich material. This activity presents a great strategy to help students by providing a versatile framework to use while reading. Many instructors find it helpful to walk students through how to complete the steps in class. Taking the time to model the process in class can improve students’ use of the activity and improve their reading comprehension as a result.

    There are many different variations that have grown out of SQ3R such as, SQ4R (survey, question, read, recite, wRite, and review) (Pauk, 1984),  PQ4R (preview, question, read, reflect, recite, and review), and FAIRER (facts, ask questions, identify major/minor details, read, evaluate comprehension, and review) (Lei, Rhinehart, Howard, & Cho, 2010). Fundamentally, these all provide frameworks for self-regulation of reading. You can use any variation of this system, as the goal is to provide a way for students to work through a framework to organize and comprehend new information.

    One of the more difficult, yet important, aspects of the SQ3R activity is developing good questions. Students often can easily turn headings and other readily identifiable major points into questions, but struggle with developing good topic spanning questions. As part of other class activities and in debriefing this activity, help students develop good questions. You may do this by sharing good questions raised by classmates or by providing some starter questions early in the course you identified. Helping students learn to ask questions can assist students in your class and throughout their education.

    (Visited 1,640 times, 1 visits today)

    Source link