Millions of students and families are caught in a middle-class crunch for affording college.
Approximately 7-8 million families with school-age children are in the middle-income bracket ($60,000-$200,000). That’s not just a statistic—it’s a massive segment of your potential student population caught in a precarious position.
According to recent Census data, these families make up about 40% of all U.S. households, with 39% of family households including children under 18. They’re too “wealthy” for significant financial aid but not wealthy enough to write a check without breaking a sweat. Understanding this demographic isn’t just important—it’s crucial for the future of higher education.
Data from the 2024 Prospective Family Engagement Report from RNL and CampusESP reveals critical insights about this demographic that could reshape how we approach recruitment, financial aid packaging, and communication strategies.
The data that should change your strategy
Let’s start with the numbers that matter. Among middle-income families:
71% report loan concerns actively impacting college selection.
69% eliminate institutions based on sticker price before engaging.
60% find financing “difficult” or “very difficult.”
87% rank financial aid among their top five decision factors.
For enrollment managers, these statistics represent more than just data points—they signal significant leakage in our recruitment funnels before we even have a chance to present our value proposition.
Decision drivers: Reframing our approach
The research reveals three primary decision factors for middle-income families:
Final cost after aid (71%)
Academic program availability (66%)
Academic scholarships (51%)
For those of us in enrollment management, this hierarchy suggests we must lead with net price messaging earlier in the funnel rather than waiting for admitted student communications.
Communication channels: What’s actually working
Here’s where we need to check our assumptions. While many institutions are investing heavily in custom apps and elaborate communication plans, the data shows:
88% prefer email communication.
31% would use a parent/family portal.
30% are open to text messages.
Only 7% would use institution-specific apps.
Translation? We might be overcomplicating our outreach strategies and underutilizing our most effective channel.
Campus visit insights for admissions teams
Despite our digital transformation efforts, traditional visit experiences still dominate:
68% participate in guided group tours.
40% opt for guided individual tours.
46% conduct self-guided tours.
37% engage with virtual tours.
This suggests we must reimagine our visit programs to integrate financial conversations earlier in the campus experience, not just at admitted student events.
2024 Prospective Family Engagement Report
The2024 Prospective Family Engagement Reportdives into the experiences, expectations, and challenges of families during the college planning process. RNL, CampusESP, and Ardeo surveyed more than 11,000 families of prospective college students about:
College planning: How many families consider out-of-state institutions? What are their college planning experiences? Do they value and participate in campus visits?
Communicating with institutions: Which channels to families prefer? How often do they want to hear from you? Which college planning topics do they value the most?
College financing plans: How many families expect paying for college to be difficult? How many plan to borrow? Do they think college is a worthwhile investment?
Move EFC conversations earlier in the recruitment cycle.
Implement targeted financial planning workshops.
2. Optimize communication flow
Leverage the strong preference for email with segmented campaigns.
Develop parent portals that prioritize financial planning tools.
Create clear timelines for aid and scholarship processes.
Integrate financial counseling throughout the admission funnel.
3. Transform campus visits
Embed financial aid counselors in regular tour programs.
Design value proposition messaging for tour guides.
Create flexible scheduling for working parents.
Include aid discussions in standard visit protocols.
4. Strengthen value messaging
Focus on ROI metrics that resonate with middle-income families.
Showcase relevant alumni success stories.
Highlight internship-to-career pathways.
Emphasize four-year graduation rates’ impact on total cost.
5. Reimagine merit strategy
Expand mid-range merit band opportunities.
Develop clear scholarship retention criteria.
Create post-enrollment scholarship opportunities.
Consider guaranteed merit aid programs.
The AI opportunity: Next-generation enrollment tools
1. AI financial planning assistant
Implement systems that:
Generate dynamic cost projections.
Automate scholarship matching.
Model various enrollment scenarios.
Provide proactive deadline management.
Adapt to changing family circumstances.
2. Smart visit management
Deploy tools that:
Create personalized visit experiences.
Coordinate key stakeholder meetings.
Offer virtual preview capabilities.
Optimize multi-college visit planning.
Align visits with aid events.
3. Financial aid navigation system
Develop platforms that:
Provide 24/7 form completion support.
Flag application enhancement opportunities.
Compare aid packages systematically.
Project career-based loan scenarios.
Identify special circumstances early.
Moving forward: Implementation priorities
The data presents clear imperatives for enrollment management teams:
Restructure communication flows: Lead with affordability messaging earlier in the funnel.
Integrate technology thoughtfully: Focus on high-impact tools that address specific pain points.
Realign resources: Ensure financial aid counseling is embedded throughout the recruitment process.
Success in serving middle-income families isn’t just about having the right aid packages—it’s about creating transparent pathways to enrollment that address financial concerns proactively rather than reactively.
For enrollment managers, this means rethinking how we allocate resources, structure our communication flows, and leverage technology to support our goals. The institutions that will thrive in this environment won’t necessarily be those with the largest aid budgets but those that best understand and address the unique needs of middle-income families throughout the enrollment journey.
Creating clear pathways for middle-income families
Let’s put this in perspective: with 7-8 million families with school-age children in the middle-income bracket and 77% believing college is worth the investment, we’re looking at millions of families who need our help to make higher education work for them. The old system of navigating college planning isn’t cutting it anymore.
The good news? Colleges are starting to get it. The best institutions create clear pathways for these middle-income families, combining high-tech tools with high-touch personal support. Considering that these families represent about 40% of all U.S. households, it becomes clear that serving this demographic isn’t just an option—it’s an imperative for institutional sustainability.
What your institution can do right now
Develop targeted financial planning tools for this specific demographic.
Create communication strategies that address middle-income concerns directly.
Redesign campus visits to include meaningful financial conversations.
Invest in AI tools that can help these families navigate the complexity.
Remember: These families aren’t just looking for a college—they’re looking for a partner in making college affordable. The right approach isn’t necessarily about having the lowest sticker price or the biggest name. It’s about understanding and actively helping this crucial demographic bridge the gap between sticker price and reality. The college planning maze might be complex, but with these insights and tools, your institution can lead in serving this vital segment of American families. The future of higher education may well depend on how effectively we serve these 7-8 million families caught in the middle.
Engage families throughout the college planning process
Parents and family members can be your biggest enrollment champions. They are the number-one influencers for prospective students. That’s why RNL Student Search to Enrollment makes parent engagement a major part of search campaigns.
Ask for a for a free walkthrough and see how you can engage students and parents at every stage of the enrollment journey.
Founded in 1957, Cabrini University, a small, tuition-driven Roman Catholic liberal arts institution located outside of Philadelphia, closed last June after providing a year’s notice of its impending closure. One of at least 14 nonprofit four-year colleges that announced closures in 2023, Cabrini announced a memorandum of understanding with Villanova University in June 2023, signed a definitive agreement in November 2023 and closed the transaction in June 2024.
Through this transaction, Cabrini was afforded a final year of operation prior to closure. Villanova acquired Cabrini’s assets, including a 112-acre property, and committed to preserving the legacy of Cabrini through commitments like naming its new campus Villanova University Cabrini Campus, providing Cabrini representatives two seats on the Villanova board for up to two successive five-year terms, stewarding the Mother Cabrini special collections and planning events for Cabrini alumni.
In this three-part essay, we—Cabrini’s former interim president, Helen Drinan, and former members of the academic leadership team—describe our decision to seek a strategic partner, the planning that went into a dignified closure and the ways we supported employees and students through a mission-driven plan to help them transition in terms of their careers and academic studies.
High acceptance rate: It increased from 72 percent in 2018 to 79 percent in 2022.
Low yield on offers of admission: It declined from 17 percent in 2018 to 11 percent in 2022.
Falling enrollment: 29.3 percent decline between 2018 (2,283) and 2022 (1,613).
Rising institutional aid: Institutional aid awards increased by about 38 percent from 2018 to 2022 ($10,595 per student in 2018 to $14,638 per student in 2022), outpacing small increases in tuition. In 2022–23, 39 percent of Cabrini’s undergraduate students were receiving Pell Grants and 99 percent received institutional grant or scholarship aid.
Persistent operating losses: Eight years of operating losses from 2015 to 2022, ranging between $1.9 million and $10 million, topped off by a fiscal year 2023 budget awaiting approval that included its highest-ever multimillion-dollar operating loss.
Enrollment and financial operating data of course tell only part of the story of a troubled institution. Many leadership decisions made over time cumulatively result in these kinds of outcomes. At least three common practices have emerged as critical leadership traps in higher education: nonstrategic launches of initiatives intended to increase revenues or decrease costs, consistent drawdowns of the endowment to cover annual losses and accumulation of deferred maintenance. All three of these institution-threatening practices were occurring at Cabrini over the eight years leading to the summer of 2022, when we realized time was running out.
The Road to Closure
Sound strategic planning for a tuition-dependent, modestly endowed, indebted institution like Cabrini depends on choosing opportunities that expand on existing expertise, require minimal capital outlays and are tested for success within a three-year time frame. At Cabrini, too many new initiatives, well beyond historic areas of expertise, were launched in the eight years prior to closure, resulting in a laundry list of only loosely related activities: a targeted international student recruitment program, graduate online education, revived adult degree completion offerings, new doctoral programs, a new residence hall and parking garage, efforts to qualify as a Hispanic-serving institution, and the start-up of a new undergraduate nursing program. All this occurred while the university took on additional debt for construction activity and used federal pandemic relief funding to fill revenue gaps, pushing the institution to the point where it faced its largest-ever annual deficit and rapidly declining cash on hand going into fiscal year 2023.
In summer 2022, Cabrini’s Board of Trustees approved a four-month budget delay, and the senior leadership team sought to identify $10 million in revenue and expense improvements. In September, the senior leadership team presented the board with two alternative paths: 1) a plan to operate for three-plus years to assess the financial feasibility of staying independent or 2) a plan to find the best possible partner to help support the institution financially. Past strategies such as voluntary separation programs, involuntary separations and the hiring of external consultants all yielded unsuccessful results and negatively impacted employee morale. The best opportunities for maintaining independence involved growing revenues, reducing costs (with the understanding that previous attempts to do so were insufficient), capitalizing on real estate and seeking nontraditional revenue streams.
The Penultimate Year
Prior to the decision to close, while institutional leaders remained focused on staying viable, senior leadership offered an exclusive interview to ThePhiladelphia Inquirer in the spirit of transparency, announcing very aggressive organizational changes and plans for new programs and publicly expressing an interest in partnerships. Such an approach, we realized, would raise further questions about the future of the institution: The truth is that once an institution acknowledges difficulties, questions will proliferate, and it is best to be transparent and open when responding.
As fall 2022 moved into winter, our leadership team became aware of three negative trends: 1) efforts to recruit the new first-year class were falling short of enrollment targets, 2) new program launches took longer than expected, creating a lag in new revenue, attributable in large part to reduced marketing resources, and 3) partnership conversations yielded few opportunities serious enough to pursue. Two institutions were seriously considering partnering with us, allowing for academic and possibly athletic continuity. However, in both cases, potential partner boards determined they were “unable to buy Cabrini’s problems” because of its declining cash and indebtedness.
Given the direction of these conversations, we concluded that the institution was not financially viable. We determined that the best opportunity to preserve Cabrini’s legacy and ensure students, faculty and staff would experience a full academic year prior to closure was to readily agree to the MOU with Villanova, the initial step toward an asset purchase agreement and a graceful closure.
Villanova’s strategic direction proved key to the partnership decision. Villanova’s strength as an Augustinian institution in the Catholic tradition aligned beautifully with Cabrini’s heritage, and the missions of both institutions made for wonderful integration opportunities in such areas as immigration, leadership and services for marginalized populations. Cabrini’s real estate offered the expansion opportunities Villanova desired in close proximity to its beautifully built-out campus. And Villanova’s financial resources enabled Cabrini to deliver a robust final year to all its students, faculty and staff, the value of which is beyond measure.
The university graduated a senior class in May 2024, offered placements to every student interested in continuing their education and supported its workforce with a combination of job-seeking resources, retention payments and severance, none of which would have been possible without Villanova’s remarkable engagement. (Part 2 of this series provides further detail about Cabrini’s final year and transition planning.)
Part of why we think the partnership worked was because we, as the institutional leadership team, effectively checked our egos at the door. We knew our focus had to be on what was best for the institution, not our own personal outcomes, to credibly lead the university through closure. A key lesson for other institutions exploring acquisitions or mergers is that the future expectations of the sitting president as well as of board members in a new organization should be clarified early in partner conversations; otherwise, personal expectations could present an obstacle to the transaction’s success.
Another lesson for any struggling institution is to think critically about the kinds of partner institutions that would find you attractive, how much leverage you might have and how much you can do to minimize your downsides. This is not typically work you can do as you face the threat of immediate closure. For institutions that may be financially stable but are experiencing some of the indicators of risk and stress mentioned at the start of this essay, the task of thoughtfully identifying potential partners could be an important activity for trustees and senior leadership teams to pursue.
Editor’s note: The second and third installments of the series will be published on the next two Wednesdays.
Helen Drinan served as interim president of Cabrini University. Previously, she served as president of Simmons University.
Michelle Filling-Brown is associate vice provost for integrated student experience and a teaching professor in the Department of English at Villanova University. She formerly served as chief academic officer/dean for academic affairs at Cabrini University, where she also served as a faculty member for 16 years.
Richie Gebauer is dean of student success at Bryn Mawr College. He formerly served as assistant dean of retention and student success at Cabrini University.
Erin McLaughlin is the interim dean of the College of Arts, Education and Humanities at DeSales University. She formerly served as associate dean for the School of Business, Education and Professional Studies at Cabrini University, where she also served as a faculty member for 16 years.
Kimberly Boyd is assistant professor of biology and anatomy and physiology at Delaware County Community College. She formerly served as dean of retention and student success at Cabrini University, where she also served as a faculty member for 25 years.
Missy Terlecki is dean of the School of Professional and Applied Psychology at Philadelphia College of Osteopathic Medicine. She formerly served as associate dean for the School of Arts and Sciences at Cabrini University, where she also served as a faculty member for 19 years.
Lynda Buzzard is associate vice president and controller at Villanova University. Previously, she served as the vice president of finance and administration at Cabrini University in its final year.
Having successful career outcomes is important for colleges and also for students, but getting students to engage in career services can feel like an uphill battle.
A May 2024 Student Voice survey by Inside Higher Edfound just about one-third of college students had no experience with or no opinions on their career center staff. Research from the National Association of Colleges and Employers shows a correlation between students who utilize their career center and the number of job offers a student receives.
Lebanon Valley College in Pennsylvania decided to bring careers to students with an event called the LVC Success Expo. On the day of the expo, LVC cancels classes so students can engage in an all-day career fair or meet with academic support staff to ensure their success in and after college.
In this episode of Voices of Student Success, host Ashley Mowreader spoke with Tomomi “T” Horning, vice president of college partnerships and strategic initiatives, and Jasmine Bucher, senior director of the Breen Center for Career and Professional Development, to learn more about the event and campus partnerships and how it contributes to a larger institutional mission.
An edited version of the podcast appears below.
Inside Higher Ed: Give me the 30,000-foot view of the Success Expo. Where did this idea come from?
Tomomi “T” Horning, vice president of college partnerships and strategic initiatives
Horning: This is our third year undertaking this initiative, and we’re so pleased at how it’s developed and changed and improved over that time period.
The original genesis was we wanted to make sure that students had dedicated time to develop a success plan, whether it involved academic advising, career and professional development services. So [staff at] the provost office and the Breen Center for Career and Professional Development got our brains together and said, “What if we canceled classes on a day in the spring and really dedicated, marshaled all of our resources together to make this happen?”
This includes a whole variety of programming, events, presentations, interactive workshops, some fun, but mostly on that adulting 101 idea around making sure that our graduates are as optimally prepared to enter the workforce as possible.
Jasmine Bucher, senior director of the Breen Center for Career and Professional Development
Bucher: One of the things that I think is so extraordinary, not only is it that we do have this dedication of truly not having classes that day, and our students know that is worked right into their academic schedule, but also that the career and success expo really reaches beyond just our doors here on campus as well.
Not only inviting our community members, [but] K-12 leaders in those different areas as well as high school students come with those leaders to really see what [college] could be [like]—even the questions to ask when starting your career plan. But also our alumni and our faculty, who are a huge part of this day.
Not only do our faculty come to support our students in their advising and what comes next in their career exploration, but they’re really reminded about the resources that we have, the services we provide and how that weaves in and out of not only the time that students are here at Lebanon Valley College, but also beyond … graduation. We have alumni who are welcome—they come back and they learn so many incredible things, as well as make connections with potential employers.
Inside Higher Ed: A lot of colleges and universities will have career fairs throughout the academic year—I’m thinking about new student orientation, where there’s club fairs and different ways to get plugged in on campus. But I love the timing of this event, and that it’s in the spring term, and maybe when students already have questions, or they’re thinking about internships.
I wonder if you can talk about how the timing is strategic and making sure that all students are captured and those different interests or questions that may be coming up during that point in their academic experience?
Horning: I would say it’s not only strategic in terms of in the calendar year, helping maybe graduating seniors prepare for that entry into the workforce, but as you indicated, preparing for summer internships, which is a very popular time for students to be out in the field.
But also it operationally manages some opportunities we have in the fall and then making sure that those same opportunities are spread out in the spring. So sometimes, based on student schedules, they just can’t get around to it in the fall, and some of our fall events are more dedicated to specific lines of career or specific industries.
This pathways to professions, all-majors career fair—which is part of the larger success expo event itself—gives that opportunity for everyone at the key time that they need to be thinking about these things, to have access to the resources and as well as the employers through specifically the career fair itself. It’s an opportune time for those students to make those connections.
The Success Expo takes place each spring, allowing students to devote a day not to attending classes but to considering their future academic and career plans.
Bucher: And it really helps our students be well prepared for it. They’ve been working throughout the year on résumés, cover letters, even mock interviewing skills and knowing what that is like, having their elevator speeches ready so that they can really speak about the skills that they’re learning, not only in the classroom, but also through our services here in the Breen Center. I really like this time of year. I think it fits well with where the student brain is, but I think it also works really well so that we can help support them in the success of that day.
Inside Higher Ed: Totally. I think about lower-level students who might still be career exploring and trying to understand how their major ties into that first job after college. By the spring, they might have figured it out by March, or at least have an idea of where they’re going, versus that first week of first semester, where it’s like, “What is happening right now?”
Bucher: Or at least have an idea at that point of sort of the fields they would like to continue to explore. It’s not at all about finding the end of a journey. It’s about the next steps on that journey. So this day provides wherever that is—if they’re going off into the employment world, we have information in sessions that help them with decisions around insurance and the next steps of what comes in repayment of loans and all of the things that is that adulting 101 piece.
But also, if it’s students who are just getting into [career thinking], what would it be like to have a meal with future employers? We have an etiquette dinner that day where we can help to teach those skills as well. It’s really hitting up all of wherever they are in their career journey and whatever that is, really trying to make sure that we are thinking about how they’re best prepared to take that as well. Because nothing is worse than when you’re getting all this information thrown at you and you’re not ready for it, right?That’s why we want to be there, making sure they’re well prepared.
Inside Higher Ed: You bring up an interesting point in that sometimes these events can be overwhelming for students. A career fair, I know as a college student, was a very scary experience. You never know how to dress or how to prepare, and obviously your career center is there to guide you in that experience and prep you for that.
But at the success expo, how do you make sure that students know how to navigate these situations? What are some of those forward-looking messages that you’re giving to students to make sure that this is something that they are taking advantage of and are getting the most out of?
Bucher: Absolutely, as someone who spends a great deal of time figuring out how we communicate that to students who are in all different places, and alumni and all of the different pieces—making sure that we have a schedule that can be broken down very well. Making sure our communication is very much around providing those opportunities for wherever you are.
If you’re looking for sessions that help support and prepare you, those are there. If you’re ready to jump in and meet future employers, we have all of these wonderful employers. We make sure that we are communicating to the students who [the employers are] are ahead of time, so they’re not coming in blindly.
We have a robust website that has information on it; our social media campaign will be very robust this year to help with that messaging as well. So that may be, instead of it being overwhelming, because they [feel they] have to incorporate the entire day on all those pieces, but really being able to see where they can make the most of their time.
They’re busy, and even a day without classes, they could be studying, they could be preparing for finals, they could be doing a lot of things, so making sure that they know the choices.
And also making sure we’ve got some fun in there. We’ve got some great speakers. We have Tunji [Adebayo] who’s coming in, talking about picking yourself up from failure. Where you are anywhere on the journey, we all need to know how to be resilient and do that. So some things that aren’t so much about, “this is what you do in the career,” but “this is what you do in life.”
Jack Hubley is coming in and is going to speak not only about what it’s like to work with the birds that he has trained all this time. He’s such a celebrity in this area, people are pretty familiar with he does. But also, how do you do that and stay on brand? If you’re working with live animals and you’re in environments that are not always predictable?
So trying to make sure that we have this clear idea of skills beyond just what you see as career is also an area where we think would help students to not be as overwhelmed and know that we’re there to help them through this process.
Throughout the Success Expo, students can participate in workshops or informational sessions about topics like resiliency and financial literacy.
Inside Higher Ed: You’re going into year three of this event. When it comes to logistics, or how the event has scaled up, can you talk a little bit about those partners that are involved in this work? We’ve mentioned a few different groups and stakeholders on and off campus, but who’s going to be there in the spring?
Horning: We do extend an invitation to K-12 partners, and mostly it’s going to be high school students who are interested in a field trip opportunity to get to understand what higher ed is like. But also, some of the sessions that Jasmine mentioned, those we purposefully choose to make sure that it’s a broad-reaching topic that any of our K-12 partners would benefit from hearing, not only the educators that bring the students as chaperones, but also the students themselves, right? Picking yourself up from failure is one of those life lessons that anybody can benefit from.
We also try to make sure that the concept of career development is woven into the day as well. Some of our high school students will get exposure to how internships themselves may help direct someone deeper into the trajectory of what they had hoped to achieve upon graduation, and sometimes completely flip it, 180 degrees through an internship experience. They learn those life lessons that, through experiential learning and high-impact opportunities, they may want to readjust what their career outlook is like.
Through the community, we also connect with the Chamber of Commerce to make sure that if there are things like venture capital or even some of the entrepreneurship opportunities. That if there are businesses with young people, or maybe recently just graduated college—maybe the alumni want to start their own business—that they have access to some of these workshops where they can talk to experts or talk to students who want to get into that business, maybe to do some idea sharing, networking.
We all know that professional networking is just one of those great benefits of bringing people together.
The college community, and even within Annville, it’s a small little quaint town here, but we make sure that our employer partners know about our restaurant and eateries that are in town. We make sure that those venues and opportunities of connection [are known] to make sure that we’re pushing business to make our local community thrive as well.
Inside Higher Ed: I don’t want to get too high-level here, because this is obviously focused on a specific event, but it seems like this is really fulfilling a lot of those goals of higher education, right? Helping students navigate their pathways to and through college, helping students thrive while they’re enrolled but also beyond college. But then continuing to invest in your local community with that socioeconomic development and those community partnerships. This is one day, but it seems like it’s connecting a lot of these bigger pieces of the puzzle to the institutional vision, which is really exciting.
Bucher: It’s very true to the Lebanon Valley College mission and method of what has always been very true and practical and hands-on and community-oriented, and so it stays very true to who we are. There are so many incredible initiatives that T has in mind and has been brainstorming for years. Me, as a new person on this staff, I’m incredibly excited for all those things, but we always bring them back to the mission, exactly what you’re saying, which is that they have to be true to the mission, otherwise we would be spinning our wheels in 100 directions that don’t make sense.
Inside Higher Ed: One group that we have alluded to but haven’t talked about a lot is faculty on campus. I wonder if you can talk about their role in this event and how they’re incorporated.
Bucher: We work very closely with our faculty to incorporate curriculum directly into their classroom, and we are as helpful as possible. Several of us on the staff here are educators ourselves; we teach courses.
Some of the specific ways are students who need to come [to the event] and interview specific employers and then provide reflections and pieces like that. So we help to provide the structure to that to faculty members who are very happy to partner with us.
But then we even have exciting things going on, like we are piloting an app this year for wayfinding through [the event]. So we’ve partnered with a marketing professor who is going to have a portion of her class use the app, a portion of the class use nothing and a portion of the class explore other items.
We’ve really taken the opportunity to not just do sort of the traditional, yes, you can come and attend and reflect and do it, which is wonderful, of course, but also to really integrate into the curriculum in meaningful ways and in ways that give the students experience on that day for true, real-life experience. Our faculty are very keen on this. They’re thrilled for the partnership, and so are we. It’s one of the things that a school this size and energy of Lebanon Valley College really allows you to do.
Horning: Something else that I would add, too, is some of our specific academic programs are able to incorporate opportunities to marry not only their academic program, but also employers and create opportunities for the collaboration.
For example, we have the Pennsylvania State Department of Environmental Protection coming, so [the faculty member is] weaving that into environmental sciences, the academic curriculum. Also as an employer, they’re looking to recruit interns and potential future employees. So really connecting all of those dots to make sure that we’re optimizing the program time that we have on this day.
Specifically because classes are canceled, we know that that also puts a hardship on some of the faculty to make sure that they’re covering all of their academic points. So finding creative ways to incorporate that, just like Jasmine said, with marketing, there are definitely ways that faculty are creatively making sure that they’re driving participation also to our events. We’re very appreciative of, just generally, the partnership that happens across campus.
And of course, a lot of the sessions, like I said, are relevant to any audience. So if they wanted to do some sort of professional development, we have something on customer service, and that’s something that we’re rolling out as an institution that could be relevant for any staff person or faculty.
Inside Higher Ed: What kind of feedback have you heard from students over the past few years as you’ve created and led the event, and how has that driven decision-making, if at all?
Horning: Wealways try to keep our surveying or feedback assessment from students to the point: “Would you recommend coming to this event? Why or why not?” Or “Did you have any recommendations for changes? Why are you making those recommendations?”
And I think over all, the feedback has been very positive. Mostly all of the suggestions are logistical in nature, which can be easily addressed. I think students are hungry for it. This is our third year doing it, so I think there is now a knowledge and an understanding of what students can expect. So maybe coming in future years, they’ll have more substantive feedback, like, “I would like a session on fill-in-the-blank,” but we try to hit those high-level adulting 101 topics as best as possible with the input from our student workers.
Some of our student workers will actually go upstairs [on campus] and survey some of the students: “Hey, if it was a choice between this session and this session, what would you prefer?” We try to [work in] real time as we’re developing programming and workshop ideas, make sure that that student voice is incorporated from the get-go.
Inside Higher Ed: When you talk about adulting 101, can you give a few examples of what those subject matters are?
Bucher: Some of the items that we have going on: understanding your student loans and repayments. Pieces like that obviously are in the forefront of our students’ minds. They work hard. Every dollar means something and how that repayment is, and really understanding it afterwards, is not easy.
Some of the other things I mentioned before, discussions around insurance, so in their next stages of life, they’re going to be having to choose [insurance coverage], and I was saying to T this morning, it doesn’t get any easier. I’ve been doing it for 20 years now, and it changes all the time, our choices in insurance, whether that’s health insurance and the other pieces of that. I was just talking about pet insurance yesterday. So there’s so many decisions to be making, and what’s worthwhile and not.
In many ways I think the etiquette dinner really calls into that as well. Once you’re outside of the walls of school, expectations change, and you expect something different of yourself, [but] just having that confidence and knowing what comes next. That has been an event that has been around the college for quite some time, and I really appreciate that it’s been incorporated into this day, remembering that it’s part of the next steps. So sort of from morning to night, it’s woven into all of our many, many events throughout the day.
Horning: I would just add there are other things that, you know, the event happens in April, and so we’re still going through the process of adding some additional workshops.
Some things that we have brought back from year one are things like credit cards, car loans and common-sense investing. So just a primer; we’re not trying to overwhelm students, but present to them what options and what type of decisions they will have to make as an adult.
And along with that, Jasmine mentioned about insurances, and we actually have a senior who is going to go into personal financial planning as a career track; he will be employed by a wealth management firm. And we thought, “Hey, why don’t we pair entrepreneurship with a hands-on workshop?” So he’ll be providing consultations. It helps him practice his skill set becoming an entrepreneur and providing those professional services along with the students, so they get an understanding of, “Gee, when I’m out there, these are the types of questions I will be asked if I have an appointment with a personal financial planner.”
A lot of just realistically making sure that students understand the variety of adulting 101 decisions they will have to make, and then hopefully educating them to be better prepared.
Inside Higher Ed: I love that idea of a peer who can support in those ways, because it’s a little less intimidating than asking somebody you’ve never met before, somebody who’s decades older than you. There’re no silly questions when it’s a classmate.
Bucher: And then they tend to continue that conversation, then with other peers, which is really what we want, right? We want to put this out there in a nonscary way, so that it can infuse out to the student body.
Horning: You really bring up a strong point there. We have recognized that the peer-to-peer learning and education is really important. Whether it’s mentoring, trying to identify peers with common experiences that you can start a conversation with the comfort of knowing, “Oh, you had my professor. You lived in my dorm.” Those types of connections are so invaluable.
Even the program about credit cards and car loans, we specifically tap into one of our corporate sponsors that runs a management trainee program so it’s employment at that particular place of business. And we ask those individuals so they’re like, one to three years out from graduating college, they’re the ones that present on those topics because those are also the decisions they recently made, and now, with the backing of their employer, which is a financial institution, they’re able to speak a little bit more eloquently about what those options might be.
Inside Higher Ed: If you had to give advice to a colleague at a different institution or someone else who wanted to model this on their campus, what’s something that you’ve learned or advice that you would give?
Horning: I think the biggest piece of advice is make sure that the communication and the collaboration across campus is set at the highest levels of leadership. Without the support of the entire community, people are going to wonder what the benefit is or what the return is for their areas. But this truly is a multistakeholder, an entire-campus event, and it has to be treated with that level of engagement. So leadership and just making sure the communication and the coordination, also that everything is moving without a hitch, occurs.
Bucher: I completely agree. This was an initiative started before I worked in this office, and I remember being incredibly impressed knowing that the institution was fully behind it, and that was clear because it was from the top down.
I think really remembering the audiences that it’s serving has also served us really well. I think I would just remind people to really keep in mind who those audiences are, making sure you know that that pairing of young alumni with students, so that they’re not feeling fearful of what’s coming next or intimidated—all of those pieces really lead to success.
Inside Higher Ed: The event is looming; it’s in the next few months. What is something that you’re excited for or something that you would like to tease our audience with as you’re preparing for the event in April?
Bucher: I’m extremely excited for the wide variety of items that are offered here and scheduled, if I could say so, in a really smart manner, so that students can sort of pick and choose throughout the day what creates the best journey for them on that day.
I’m really excited for the communication that’s coming to say, you want to work on your personal brand? Here you go. Looking for an internship? Come and hear how interns have been successful and what has led to that.
I’m just really excited for sort of that audience-speak that really gets to offering to people the really nice variety of pieces that are making up this exciting day.
Horning: Because this is our third year, I’m just excited that it feels like we have found our groove, and people are anticipating this event. People are excited and they want to get in on the action. And I think that is exciting to us in the Breen Center, because we do this because we want it to be of value to the community, and the fact that people are eagerly waiting for this and asking about it, talking about it, just builds the energy, builds the enthusiasm.
I’m looking forward to a great third year and making sure that, again, we’re delivering on the promise of making sure our graduates are really well prepared and that we are behind them 100 percent.
February 17, 2025, by Dean Hoke: This profile of Earlham College is the second in a series presenting small colleges throughout the United States.
Background
Founded in 1847 in Richmond, Indiana, Earlham College is a private liberal arts institution with deep Quaker roots. The college maintains its commitment to principles such as integrity, peace, social justice, and community engagement, which shape both its academic and extracurricular life. Despite its modest size, Earlham has built a reputation for academic rigor, experiential learning, and global perspectives. Dr. Paul Sniegowski, a biologist and former dean of the College of Arts and Sciences at the University of Pennsylvania, has served as President since August 2024.
For the 2023-24 academic year, U.S. News & World Report estimates Earlham’s total annual cost (including tuition, housing, and other expenses) at $53,930, with an average net price after aid of $25,496.
Curricula
Earlham College offers a diverse range of undergraduate programs, with popular majors including Biology, Environmental Science, International Studies, Business, and Psychology. The college places a strong emphasis on interdisciplinary learning, allowing students to engage in cross-disciplinary courses and independent research. The Epic Advantage Program provides students with up to $5,000 in funding for hands-on learning experiences, such as internships, field studies, and international travel.
The college also offers a 3+2 Engineering Program, where students spend three years at Earlham before transferring to an affiliated university, such as Columbia or Case Western Reserve, to complete an engineering degree. This dual-degree approach combines the benefits of a liberal arts education with technical training, preparing students for careers in engineering, business, and technology fields.
Strengths
Commitment to Experiential Learning – Programs like Epic Advantage provide students with real-world experience, enhancing their competitiveness in the job market.
Strong International Focus – Nearly 70% of Earlham students study abroad, and the college has partnerships with institutions worldwide.
Small Class Sizes – With a 9:1 student-faculty ratio, Earlham offers personalized attention and mentoring opportunities.
Values-Driven Education – Quaker principles of peace, social justice, and ethical leadership are embedded in the curriculum and campus culture.
Strong Science and Environmental Programs – The Joseph Moore Museum and expansive natural study areas provide unique hands-on research opportunities.
Weaknesses
Financial Stability Challenges – Like many small liberal arts colleges, Earlham faces financial pressures, including declining enrollment and reliance on tuition revenue.
Leadership Continuity – Since 2011, Earlham has had four Presidents and one interim.
Limited Graduate Programs – Earlham focuses almost exclusively on undergraduate education, which may limit options for students seeking to continue their studies within the same institution.
Limited Name Recognition – Despite its strong academic reputation, Earlham struggles with brand recognition outside the Midwest and higher education circles.
Economic Impact
Earlham College is a major economic driver in Richmond, Indiana, and the surrounding region. The college employs hundreds of faculty and staff, supports local businesses, and contributes significantly to the local economy.
According to the Independent Colleges of Indiana, Earlham College has a total economic impact of $76 million on the state and has created nearly 725 jobs in Indiana. LinkedIn data suggests the college has nearly 9,000 alumni, with 1,400 residing in Indiana and 366 in the Richmond area.
Through programs like the Center for Social Justice and the Bonner Scholars Program, Earlham students engage in community service projects throughout Richmond. The college also frequently hosts cultural and educational events open to the public, further integrating itself into the civic life of the region.
Enrollment Trends
Earlham College has experienced a decline in full-time equivalent (FTE) enrollment over the past decade. In the 2013-14 academic year, enrollment stood at 1,159 students, dropping to 677 students in 2022-23. In the 2024 academic year, undergraduate FTE enrollment was 691.33 in the fall and 620.33 in the spring, reflecting ongoing challenges in retention and recruitment.
Degrees Awarded by Major
In 2024, Earlham College awarded 123 undergraduate degrees, including 84 single majors, 18 double majors, and one triple major. The distribution by major category is as follows:
Alumni
According to Earlham’s First-Destination Survey Report (2019-23):
28% of graduates continue their education within six months of graduation.
57% are employed within six months.
The top five employment industries are Education, Healthcare, Internet & Software, and Research.
Nearly 50% of alumni pursue graduate or professional school within 10 years.
Notable Alumni:
Michael C. Hall (1993) – Emmy-nominated actor (Dexter, Six Feet Under).
Margaret Hamilton (1958) – NASA software engineer, led Apollo Program flight software development.
Michael Shellenberger (1993) – Author and journalist on free speech and environmental policy.
Venus Williams (2015) – Former World No. 1 tennis player and Olympic gold medalist.
Wendell Meredith Stanley (1926) – Nobel Prize-winning chemist in virus research.
Endowment and Financial Standing
Earlham College’s current endowment is $419 million, down from $475 million in 2021. Financial challenges stem from declining enrollment and reduced tuition revenue. In FY 2023, the college reported a net loss of $11.1 million.
Despite these challenges, Forbes (2024) rated Earlham A- with a 3.499 GPA, signaling relative financial resilience. The college is actively implementing strategic budget adjustments and seeking alternative revenue sources to ensure long-term sustainability.
Why Earlham Remains Relevant
In an era where liberal arts colleges must justify their value, Earlham College stands out for its values-driven, experiential education. Its commitment to academic excellence, social responsibility, and global engagement makes it an attractive option for students looking for more than just a degree.
Earlham’s focus on sustainability, diversity, and international collaboration positions it as a model institution that integrates ethical leadership with practical learning. As higher education continues to evolve, Earlham demonstrates that a small college can have a big impact on both students and the world.
Dean Hoke is Managing Partner of Edu Alliance Group, a higher education consultancy, and formerly served as President/CEO of the American Association of University Administrators (AAUA). With decades of experience in higher education leadership, consulting, and institutional strategy, he brings a wealth of knowledge on small colleges’ challenges and opportunities. Dean, along with Kent Barnds, are co-hosts for the podcast series Small College America. Season two begins February. 25, 2025
Dr. Walter G. BumphusAfter steering America’s community colleges through unprecedented challenges and opportunities, Dr. Walter G. Bumphus announced he will retire as president and CEO of the American Association of Community Colleges (AACC) at the end of 2025, capping a remarkable 15-year tenure that helped reshape higher education access nationwide.
The announcement marks the end of a chapter for community colleges that saw dramatic shifts in workforce development, educational technology, and the role of two-year institutions in American society. Under Bumphus’s leadership, community colleges strengthened their position as essential providers of affordable education and workforce training, working closely with four presidential administrations to advance their mission.
“When you look at the landscape of higher education today, you can see Dr. Bumphus’s influence everywhere,” said Dr. Sunita Cooke, who chairs AACC’s board of directors and serves as superintendent/president of MiraCosta College. “He understood that community colleges needed to be at the table for every major conversation about America’s future workforce and educational opportunities.”
Bumphus’s career, spanning more than five decades, coincided with community colleges’ emergence as critical players in addressing skills gaps and workforce needs. His expertise led to appointments on several high-profile national committees, including the American Workforce Policy Advisory Board and the Department of Homeland Security’s Academic Advisory Council.
Beyond his policy work, colleagues say Bumphus’s greatest legacy may be the network of educational leaders he helped develop. As the A. M. Aikin Regents Endowed Chair at The University of Texas at Austin, he mentored hundreds of administrators who went on to leadership positions at community colleges across the country.
His achievements have been widely recognized, including receiving the ACCT Marie Y. Martin CEO of the Year Award and the 2021 Baldridge Foundation’s Award for Leadership Excellence in Education. In 2013, Bumphus was awarded the Diverse Champions award by Diverse: Issues In Higher Education.
But Bumphus maintains that the real measure of success lies in the millions of students who have benefited from community college education during his tenure.
“Every time I meet a graduate who tells me how community college changed their life, I’m reminded of why this work matters so much,” Bumphus said in his retirement announcement. “These institutions are the backbone of opportunity in America, and I’m confident they’ll continue to evolve and serve students for generations to come.”
His 15-year leadership of AACC stands as the second-longest in the organization’s history. As he prepares for retirement, Bumphus remains characteristically focused on the future: “The work of expanding educational opportunity never ends. I’m grateful to have played a part in it.”
College students often have a complicated relationship with social media, with a large number of learners active on multiple social media platforms but also aware of the negative mental health consequences social media can have.
Teens receive hundreds of notifications on their phones every day, with over half of one study’s participants receiving more than 237 notifications per day. Nearly one in five teens say they’re on YouTube or TikTok almost constantly, according to a 2023 survey from Pew Research.
A May 2024 Student Voice survey by Inside Higher Ed found one-third of respondents indicated social media was one of the biggest drivers of what many call the college mental health crisis.
A recent study authored by a group of researchers from Michigan State University and published in the Journal of Contemporary Issues in Education evaluates how students with disabilities interact on social media and build social capital.
Researchers found disabled students—including those with autism, anxiety, attention-deficit and/or hyperactivity disorder—were more likely to seek out new relationships and engage in active social media posting, which can advance connectedness and relationships among learners.
The background: While social media can offer users social supports, such as promoting a sense of belonging during times of transition or crisis, it also poses risks for young people, including cyberbullying and online harassment, according to the study.
Previous studies show youth with disabilities experience higher rates of cyberbullying compared to their peers, but students with disabilities are also more likely to report they receive social support through social media, which could be tied to the social isolation they can experience in person.
Existing literature often focuses on the negative effects of social media for young adults with disabilities, but it is not known if there are differences between the experiences of those with and without disabilities and their social media habits.
“Understanding different learners’ experiences with social media could help college faculty, special education professionals, and counselors not only consider using social media to create more welcoming and supportive learning environments but also how they might play a role in building individual learner’s capacity for positive digital participation,” researchers wrote.
Methodology: Researchers conducted a survey of college undergraduates in the U.S. with and without disabilities in fall 2021, collecting data on social media use, social capital and psychological well-being. In total, 147 students responded to the survey.
From this sample, researchers selected five individuals with and five individuals without disabilities to participate in semistructured interviews. Participants were matched based on social media habits and demographic factors, such as gender.
Results: Through postsurvey interviews with 10 students, researchers learned that while both groups of students engage on social media for personal entertainment and to stay connected with people in their social circles, students with disabilities were more likely to say they used social media to initiate and grow relationships.
All five participants without disabilities used Snapchat to interact with friends or keep in touch with loved ones in an informal manner, and all participants used Instagram to stay up-to-date with their peers.
Among the five participants with disabilities, students reported using more social media platforms individually, and these learners were more likely to use TikTok (which in fall 2021 first hit one billion monthly active users compared to Instagram’s then-two billion users) compared to their peers. Students reported using TikTok for watching videos, sharing humor with their friends or participating in larger community building, including professional learning networks or cosplaying.
Students without disabilities were more likely to say social media made no difference on their relationships or that it positively impacted their relationships by allowing them to stay in touch over geographical distances or other barriers.
Similarly, all students with disabilities said social media assisted with their relationships, allowing them to connect with new people, expand their community and help manage their disabilities by connecting with others.
Some respondents with disabilities said they felt more confident to engage with strangers in a safe way online and that social media was an avenue to find like-minded people they wouldn’t ordinarily interact with, allowing them to build new relationships. This was a unique trend to students with disabilities; those without were more likely to say they use social media to engage with people they already had relationships with.
Students with disabilities may have greater challenges with in-person socialization, which researchers theorize makes social media particularly important for these learners, who also said they’re more likely to post on social media versus passively scroll.
Interacting with others in the disability community and breaking stigma around disability was another theme in conversations with disabled students. These interactions could be with peers who share their disability or from medical professionals or support groups who provide new information.
One limitation to the research was social desirability bias, or respondents’ tendency to answer questions in a way that would please researchers, meaning students underreport undesirable behaviors. The sample included only female and nonbinary students, which creates further limitations to the data.
Put in practice: Researchers offered some suggestions for how educators can utilize this data to create a more inclusive learning environment, including:
Integrating social media into the classroom. While some digital learning platforms have forums for community building, such as a discussion board, these platforms can be less accessible than traditional social media platforms.
Facilitating personalized learning environments. Higher education leaders can consider ways to use social media to create formal and informal learning experiences in and around courses. These learning environments can also include methods for peer communication and connection, helping make learning more collaborative.
Engaging on social media themselves. Self-disclosure by professors can help build relationships in the classroom and enhance learning, but instructors must weigh safety, privacy and other legal boundaries in their social media usage. This could be one way to model positive social media usage for students, including how to have productive interactions with others.
In the future, researchers see opportunities for analysis of design, implementation and evaluation of social media interventions for connection among students with disabilities, such as peer mentoring programs, online support groups or digital storytelling. There should also be consideration of the long-term effects of social media use on students’ mental health and well-being.
Get more content like this directly to your inbox every weekday morning. Subscribe here.
A May 2024 Student Voice survey found 28 percent of college students say they have “not much trust” in their president and other executive-level officials, which was 18 percentage points higher than students’ distrust in professors and 13 percentage points higher than their trust in academic department leaders.
An additional 19 percent of students said they were not sure if they trust their president, for a total of 52 percent of students indicating they have at least some trust in their campus executives.
Students at private nonprofit institutions were mostly likely to say they did not have much trust in their president (48 percent) compared to their public four-year peers (30 percent) or those at two-year institutions (18 percent).
“Trust is in very short supply on campuses. We do not see deeply trusting environments on campus very quickly,” said Emma Jones, executive vice president and owner of higher education consulting group Credo, in a Jan. 29 webinar by the Constructive Dialogue Institute. “By and large, I find campus leaders to have incredibly trustworthy behavior … but they are not trusted in their environments.”
Institutional leaders can employ a variety of strategies and tactics to gain greater trust.
Creating a foundation: A 2024 report from the American Council on Education found presidents are in agreement that trust building is a key competency for being a campus leader. Presidents told researchers they need to be present with their constituents, create opportunities for various stakeholders to share their views on issues related to the institution and surround themselves with diverse voices, according to the report.
In the webinar, experts shared what they believe helps build trust between executive-level administrators and the students they serve.
Demonstrate care. Humanity is a key factor in trust, in which a person recognizes the uniqueness of each person and builds relationships with them, Jones explained. During this present age, it is particularly important for campus leaders to see and acknowledge people for their humanity.
Watch your tone. Generic or trite messages that convey a lack of empathy do not build trust among community members, said Darrell P. Wheeler, president of the State University of New York at New Paltz. Instead, having transparent and authentic communication, even when the answer is “I don’t know,” can help build trust in a nebulous period of time, Jones said.
Engage in listening. “People want you to be compassionate, but they really want to have their own space at times to be able to express where they are [and] not for you to overshadow it by talking about yourself in that moment,” Wheeler said during the webinar.
Create space to speak with students. Attending events to listen to students’ concerns or having opportunities for students to engage in meetings can show attentive care, Victoria Nguyen, a teaching fellow at Harvard’s Graduate School of Education, told Inside Higher Ed.
Foster healthy discourse. While presidents should strive to be trusted among their community members, too much trust can be just as destructive as too much distrust, Hiram Chodosh, president of Claremont McKenna College in California, said in the webinar.
Trust yourself. Earning trust requires self-trust, Chodosh said, so presidents should also seek to cultivate their own trustworthiness.
Presidential Engagement: College presidents can step outside their offices and better engage with learners. Here are three paths they are taking.
Being visible on campus. Creating opportunities for informal conversation can address students’ perceptions of the president and assist in trust building. Some presidents navigate campus in a golf cart to allow for less structured interactions with students. The University of South Alabama president participates in recruitment trips with high schoolers, introducing himself early.
Hosting office hours. Wheeler of SUNY New Paltz hosts presidential office hours for students once a month in which they can sit down for coffee and chat with him. Students can sign up with a QR code and discuss whatever they feel called to share. At King’s University in Ontario, the dean of students hosts drop-in visits across campus, as well.
Give students a peek behind the curtain. Often, colleges will invite students to participate as a trustee or a board member, giving them a voice and seat at the table. Hood College allows one student to be president for a day and engage in ceremonial duties and meetings the president would typically hold.
When Wee Yang Soh was considering his degree options, he felt his choices were limited. The Singaporean had been offered a place to study chemistry at the National University of Singapore (NUS), but he was wary of accepting.
In his experience, school had felt like he was simply being “trained” to pass exams. “I didn’t want my university education to be like that,” he said. Soh liked the idea of liberal arts education but couldn’t afford the hefty tuition fees charged by the U.S. colleges offering those programs.
So when, in 2011, NUS announced it would be opening a liberal arts college—the first of its kind in Singapore—in partnership with Yale University, Soh jumped at the chance to apply. He was part of the inaugural cohort of students enrolled at the college, graduating in 2017.
Four years later, NUS suddenly declared that it would no longer be continuing the partnership, with plans to close the college once all existing students had graduated.
While Yale-NUS College is not the only international partnership in Singapore that has come to an abrupt halt—having helped develop Singapore University of Technology and Design’s curriculum, the Massachusetts Institute of Technology was shown the door in 2017—it is among the most talked about. This unexpected announcement drew just as much attention, if not more, as the opening of the college had, with rumors swirling about the reasons for the decision.
Today, as the college enters its final semester before shutting its doors for good, can liberal arts live on in Singapore? And are international partnerships off the table in a country increasingly embroiled in debates about national identity?
Singapore’s government first began discussing the prospect of a liberal arts college in 2008. Policymakers saw the establishment of one as having multiple benefits—reducing the number of local students going abroad, diversifying pathways within the country’s higher education system and contributing to Singapore’s ambition to become an international education hub.
So when Yale-NUS College opened in 2013, it seemed like the perfect fit. Unfortunately, this synergy didn’t last.
“The context changed,” said Jason Tan, associate professor at Nanyang Technological University’s National Institute of Education. “For one thing, there’s no longer any official talk about establishing Singapore as an international education hub.”
Although Singapore launched the Global Schoolhouse Project in 2002, an initiative that aimed to recruit 150,000 international students by 2015, by the mid-2010s, the numbers remained far below targets and talk of the scheme quieted as public debates around immigration heated up.
Writing in the academic journal Daedalus in 2024, Pericles Lewis, the founding president of the college, suggested that things had gone a step further: “Singapore has not been immune to the forces of populism and nationalism that have affected most parts of the world,” he wrote.
For a college in which international students represented about 40 percent of the student population, this was a problem.
Throughout the college’s life, the governing party “showed itself to be highly sensitive to complaints about benefits reaped by foreigners, and to concerns of middle-class Singaporeans about the accessibility of higher education,” Lewis wrote.
The institution also became central to debates about academic freedom in Singapore, with the last-minute cancellation of a course focused on protest generating backlash. To some, the college was a site of rare political activism and freedom in Singapore, which was both welcomed and feared, depending on your point of view.
However, Linda Lim, professor emerita at the University of Michigan, argued that the college had little impact on the state of academic freedom in Singapore more widely.
“From the beginning it was understood and even explicitly acknowledged that Yale-NUS College would practice and experience academic freedom only within the college walls and premises,” she said.
“Yale may have flattered itself, or argued to mollify dubious faculty in New Haven, that Yale-NUS College would help advance academic freedom in Singapore—a naïve and neo-colonialist attitude.”
Moreover, Soh believed claims of heightened student activism at the college were exaggerated, with intense media attention fueling public ire towards the institution.
“From the first year, the Singaporean public and the government were already pretty afraid that politically motivated actions on campus would pose a problem for Singapore,” he said. “And they kept a very close eye on the college activities, to the point where it felt like a self-fulfilling prophecy.”
At times, small incidents on campus, such as disagreements over new course curricula, made national news, he said. This “reinforced the idea that the students were political or dangerous and all of that stuff, when, really, everything that happened in college felt, at least to me, incredibly mundane and incredibly small and silly.”
NUS College, a U.S.-style undergraduate honors college for NUS students, was established in 2022 in place of Yale-NUS College. While this new institution offers a residential experience, small class sizes and some shared curricula, it is a far cry from a traditional liberal arts college.
Today in Singapore, “there’s more focus on interdisciplinary learning,” said Tan. “Across all of our universities, in one form or another, there’s this concern about future economic needs.
“The future problems will require all those buzzwords—critical thinkers and flexible, adaptable people and people who possess this interdisciplinary pool of knowledge and so on.
“That trend has pretty much superseded the excitement over having a liberal arts education for our undergrads.”
For Lim, the closure of Yale-NUS College was a “cautionary tale” for international higher education institutions “who think they can be a beacon of light in authoritarian countries by collaborating with autocratic governments.”
The college’s chief legacy, she continued, “is the quality of the students it educated and graduated.”
Soh is currently undertaking a Ph.D. in the U.S. and credited the college and his professors for inspiring him to do so.
“I hope to teach in the future as a professor,” he said. “I want my students to be able to treat education as not a stepping-stone to grades or to credentials, but as a way to reformulate how we think about and relate to this crazy world that we live in today.
“I think the legacy lives on in me, but I can’t say that it lives on in Singapore or in NUS for sure. But I hope it does.”
The No. 1 lesson about disaster relief Ryan Cornner would give college presidents is: do scenario training.
The president of Glendale Community College said he and his team were working on emergency preparedness training with new managers when the L.A. wildfires started.
“We were actually planning a tabletop exercise for spring, and boy, did we get a tabletop exercise. It was just real,” Cornner said in the latest episode of The Key, Inside Higher Ed’s news and analysis podcast.
GCC serves 24,000 students from its campus about five miles from where the Eaton fire burned. Dozens of the college’s students and employees lost their homes, and many more were displaced for more than a week. GCC has expanded its efforts to provide access to basic needs for its students and has recognized that its part-time adjunct faculty need the most support.
While providing food and housing support or giving students laptops has been a general principle of the community college system, Cornner says a new need in this emergency is coming from employees.
“As an employer, we think that the real focus is making sure that the workplace has what it needs and making sure people feel supported in their work. But when someone has just lost their home, it brings an added element of ‘what should we do as a community?’”
Inside Higher Edreported on GCC’s immediate emergency response in January and wanted to reach out to the institution again to check in on its recovery.
Cornner said institutions can support their communities by investing in the future workforce of first responders and by providing a safe campus for secondary school students whose schools were destroyed in the fires.
Listen to this episode of The Key here, and click here to find out more about The Key.
He was impressed by what he saw, and thought that the UK should have its own version, a postgraduate university focusing on science and technology. Fast forward six years, and Churchill had retired after his second spell as Prime Minister. His private secretary, John Colville, sought to progress the idea, but could not make as much progress as he had hoped.
Parallel with, and unconnected to, Churchill’s idea, Shell Petroleum had since the early 1950s been hosting meetings at which leading British industrialists identified a need for a specialist institute to train people for the science and engineering industries. Again, this came to nothing.
But then in 1957 the two schemes were revivified and brought together. Alexander Todd, Nobel Prize-winning chemist, worked with Carl Gilbert, chairman of Gillette and sometime US trade representative, to make the case for a Cambridge college which would focus on science and technology. And one which would stand as a memorial to Churchill. And so in 1958 an appeal for funds was made (as can be seen from the Scotsman of 21 May 1958, no public funds would be available at first), with some £3.5 million being raised to finance the college and its initial activities.
The money was raised, with contributions from industry and also from the Transport and General Workers Union (which all confirms L P Hartley’s motto in The Go-Between: “the past is a foreign country; they do things differently there”). And it was a period of industrial largesse to higher education: in researching this piece I came across a wonderful article – in the Brechin Advertiser (29 July 1958) but no doubt syndicated more generally – by Richard Martin, on the donations to Churchill College, St Catherine’s Oxford, and for new buildings fore engineering at UCL. “The universities have been given the financial tools, and they will not fail to finish the job.”
Very deliberately, although the college was intended to focus on science and technology, it would not exclude the humanities. This was the period of C P Snow versus F R Leavis, two cultures versus one. Snow – scientist, civil servant, novelist – argued in The Two Cultures and the Scientific Revolution that the problems of society were exacerbated by the failure of many who would be considered well educated (ie in the humanities and classics) to know anything about science:
A good many times I have been present at gatherings of people who, by the standards of the traditional culture, are thought highly educated and who have with considerable gusto been expressing their incredulity at the illiteracy of scientists. Once or twice I have been provoked and have asked the company how many of them could describe the Second Law of Thermodynamics. The response was cold: it was also negative. Yet I was asking something which is about the scientific equivalent of: ‘Have you read a work of Shakespeare’s?’
(To avoid embarrassment at this point, I will remind you that the second law of thermodynamics states that the entropy or disorder of a closed system is always increasing. Which you already knew.)
Snow’s view was attacked (there is no better word) by critic F R Leavis in 1962: Snow was a philistine; his vision soulless technocratic utilitarianism. Viewed as an attack which played the man not the ball (but note here a defence of Leavis from 2013), the row did not do much to damage Snow’s view.
The founders of Churchill College clearly thought there was merit in Snow’s views; hence the requirement that only 70 per cent of the entry be for students of science and technology.
The college was given a Royal Charter in 1960, and admitted a few postgraduate students in that year. The first undergraduates arrived the following year. By 1966 Churchill had been admitted as a full college of the university and by 1968 all of the original buildings had been completed and opened.
Churchill College was amongst the first of Cambridge’s all-male colleges to admit women (in 1972). Its senior tutor – Dick Tizard – sought to broaden admissions to focus on grammar school and comprehensive school students, not focusing on the public schools. He also worked to achieve the admission of students to membership of the college governing body, in 1969.
In 1970 the Churchill College JCR, along with the University of Bristol Students’ Union, persuaded the NUS to take up an appeal by two students – Julian Fox of Bristol, and Hugh Nelson Ricketts of Churchill – against decisions of the local returning officers to disbar them from the electoral register because they were not permanently resident at their term time addresses. The Court of Appeal – with Lords Denning, Widgery and Karminski – on 12 May 1970 granted the students appeal. The OfS now requires universities to assist students in registering to vote: quite some distance has been travelled in this matter!
Winston Churchill is not without controversy. In 2020 the college announced a working party which would organise a year-long programme – on Churchill, race and empire. The university archives hold some recordings from this. Not, perhaps, surprisingly, this attracted a considerable amount of media attention and criticism: Churchill is a revered figure for some in Britain. The college cancelled the series of events in June 2021.
There’s a very readable history of the college on its website (click on “the college’s first decade” in the fuchsia box), by the way, from which I’ve drawn fairly heavily in this account.


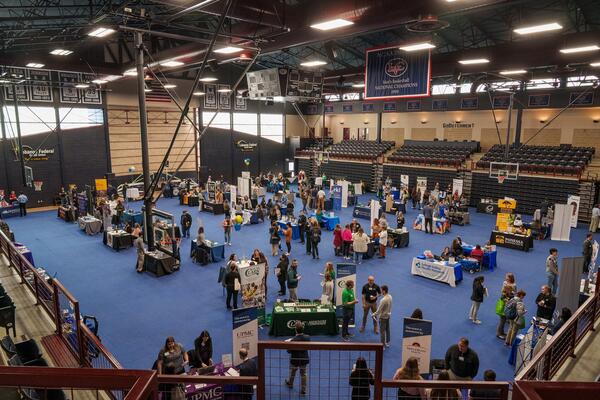
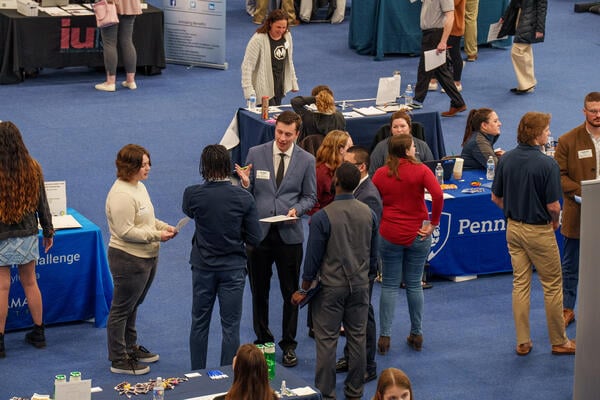
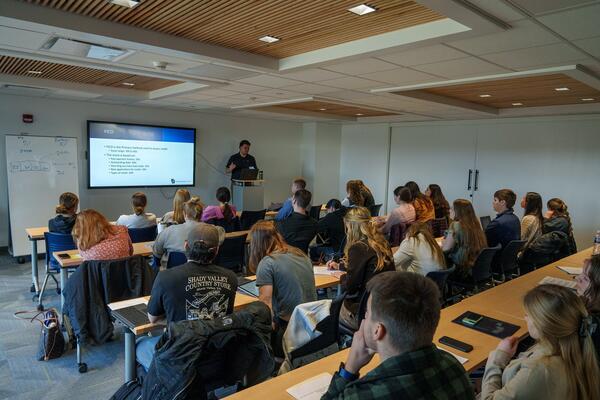
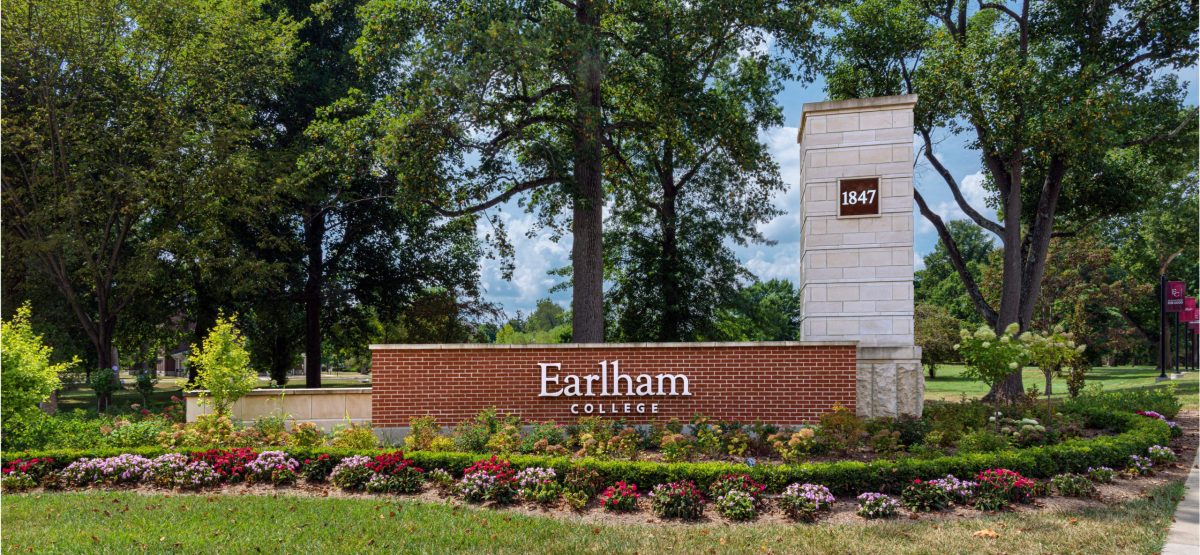


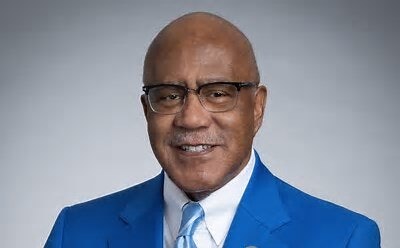


