by Savannah Celeste Scott, The Hechinger Report November 17, 2025
Imagine clocking out of an eight-hour shift and your compensation is a pat on the back and experience for your resume.
This scenario is a disturbing reality for around one million college students, and it needs to stop. Students work countless hours on top of their academic pursuits only to be told they should be “grateful for the opportunity.”
The government must pass legislation mandating that all internships include monetary compensation; employers must stop exploiting students and recent graduates while they build necessary work experience.
The idea of an unpaid internship is odd considering that most of us grew up learning that work is rewarded. Some 71 percent of American households give children ages 5 to 17 an allowance for doing their chores, a Wells Fargo study found.
Practices like that have led many of us to believe that labor should be paid, and it should be no different when we enter the job market.
Related: Interested in innovations in higher education? Subscribe to our free biweekly higher education newsletter.
There is a disturbing correlation between unpaid internships and exploitation, especially for people from marginalized communities. Historically, Black people have been the face of working without compensation — a phenomenon dating back to early American slave practices.
Unpaid work is not just exploitation — it is dehumanizing. No person can survive without money, so no one should be required to work with no compensation to help them live. The reality is that, unlike higher-income students, low-income students cannot afford to work for free. They need money to cover their tuition, afford groceries and pay for a place to live. This is why unpaid internships further the cycle of economic exploitation, the student-run Columbia Spectator noted.
Yet there are plenty of people who believe compensation does not always have to be monetary. Many students have heard employers extol the value of “experience” as they try to persuade them to work without pay.
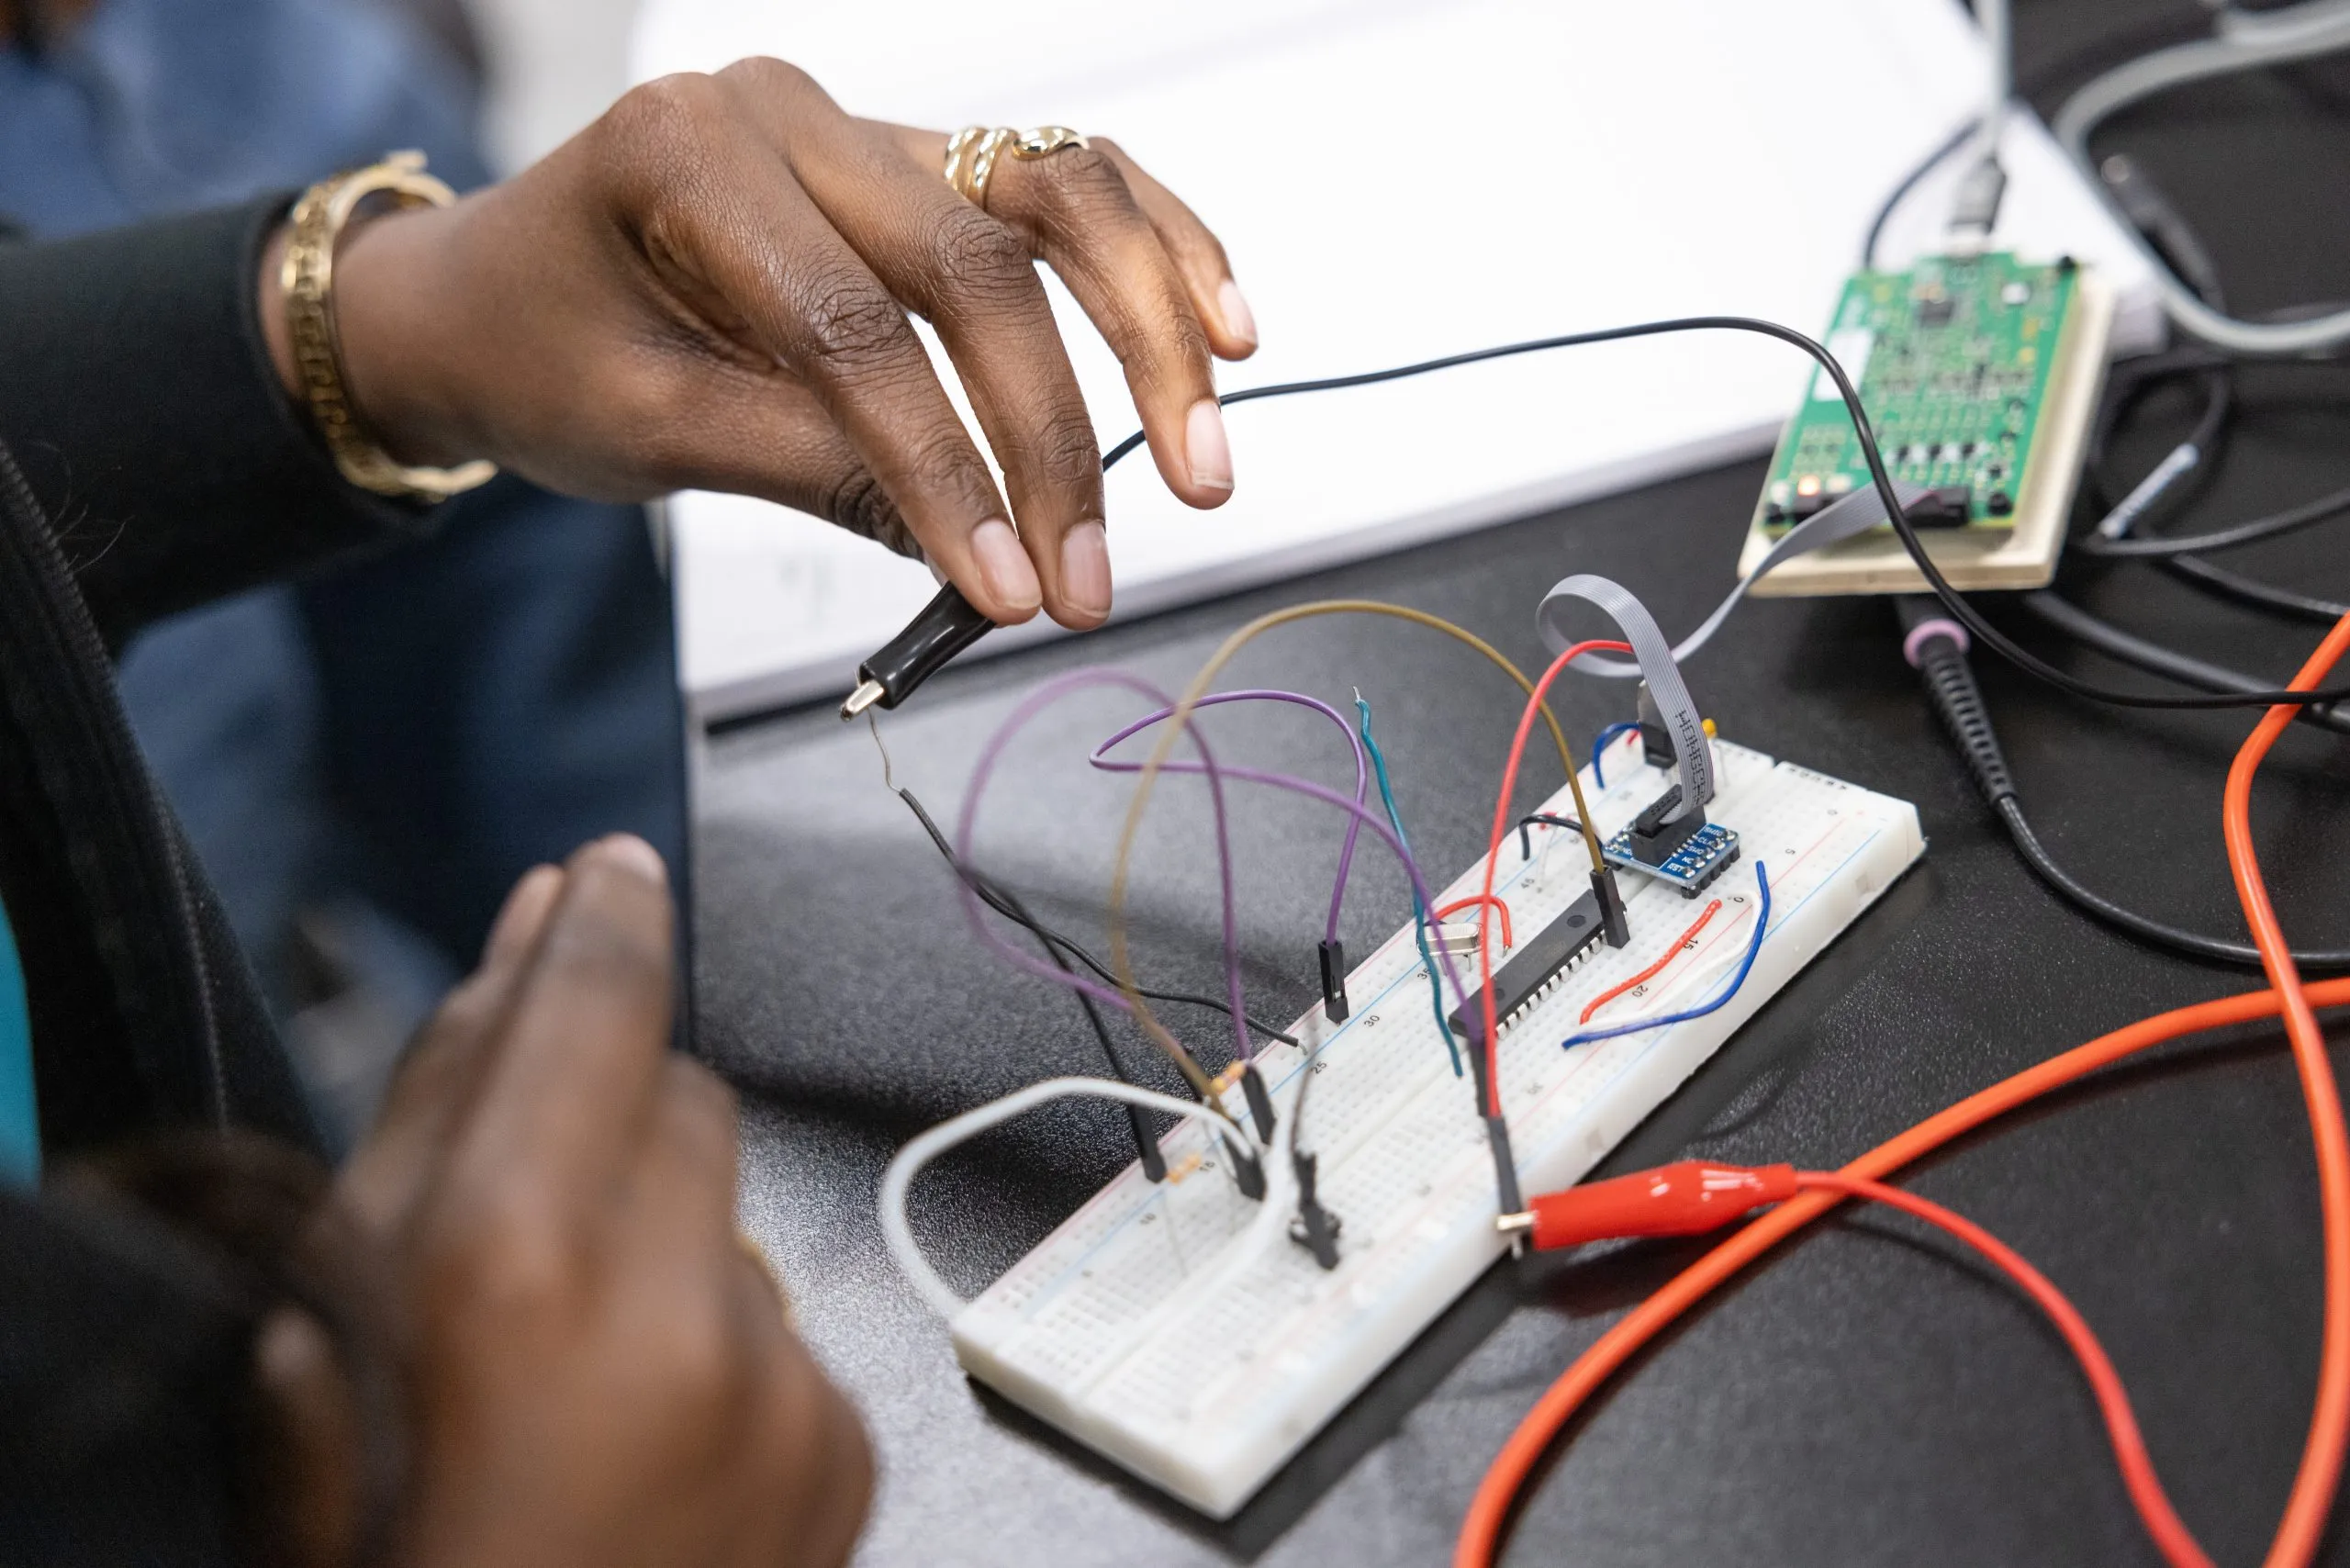
Such was the case for me when I was hired for a legal internship as a freshman in college. I thoroughly enjoyed my internship, as it gave me both professional and social opportunities. But it was an extremely difficult time for me both mentally and financially.
I was taking 16 credit hours, regularly writing for a student publication and working another part-time job to save money for law school. The stress of going into the office every day to handle casework — often ranging from domestic violence to sexual assault cases — was mentally taxing when combined with schoolwork and extracurricular responsibilities.
While the experience that the internship provided was incredible, monetary compensation would have made it much less stressful, as I would not have needed the other job.
Unpaid internships can also hurt graduates’ prospects in the job market. Those who have had unpaid internships receive fewer job offers on average than those who completed paid internships, statistics from the National Association of Colleges and Employers (NACE) show.
The average student who completed an unpaid internship also saw $22,500 less in their starting salaries than those who completed paid internships. According to the DeltaInstitute, “employers offering compensation tend to invest more in mentoring, performance feedback, and skill-building”; that added investment provides students with more preparation for the job market and helps them look more impressive to an employer.
Unpaid interns have been fighting for compensation for decades. A lawsuit filed by twointernsagainst Fox Searchlight over their lack of compensation when working on the movie “Black Swan” resulted in a legal battle that lasted five years. The two interns werefinally compensateda total of $13,500 for their work — despite the film grossing more than $300 million.
The Fox Searchlight lawsuit sparked a wave of other impassioned interns to plead their cases as well, including a class-action lawsuit against NBCUniversal back in July 2013. That resulted in a$6.4 million settlementsplit among thousands of interns.
In both cases, the employers made millions of dollars in profits but still refused to pay their interns until they were legally forced to do so.
According to Shawn VanDerziel, the president and chief executive officer of NACE, paid internships are a “game changer” to employers and employees alike. The dilemma is this: Employers want labor, and students want internships. The most obvious solution would be to pay students for the work that they do.
Students do not work for fun. They work because they want to create better futures for themselves; their success will be less likely if they don’t receive monetary compensation. The government needs to make it illegal for employers to exploit students by having them work without pay.
College students should not be expected to work for free.
Savannah Celeste Scott is a senior at the University of Georgia in Athens, studying journalism, Spanish and law, jurisprudence and the state on a pre-law track.
This <a target=”_blank” href=”https://hechingerreport.org/student-voice-college-students-are-tired-of-being-told-that-we-should-be-grateful-for-our-internships-we-also-want-to-get-paid/”>article</a> first appeared on <a target=”_blank” href=”https://hechingerreport.org”>The Hechinger Report</a> and is republished here under a <a target=”_blank” href=”https://creativecommons.org/licenses/by-nc-nd/4.0/”>Creative Commons Attribution-NonCommercial-NoDerivatives 4.0 International License</a>.<img src=”https://i0.wp.com/hechingerreport.org/wp-content/uploads/2018/06/cropped-favicon.jpg?fit=150%2C150&ssl=1″ style=”width:1em;height:1em;margin-left:10px;”>
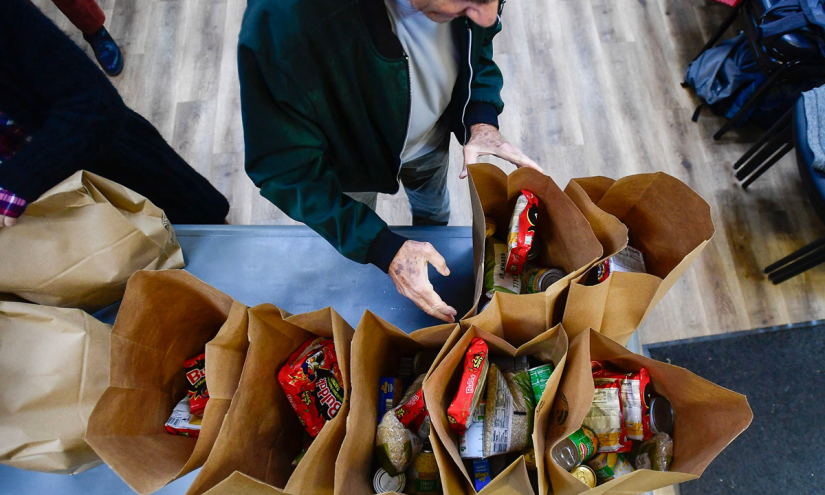
Maia Jackson should have been cranking out a research paper for her communications class. Instead, she found herself queuing up at a food pantry to secure groceries for her household amid the nation’s longest government shutdown.
“I walked out with a shopping cart full of food,” the 25-year-old college senior said. “I could barely carry it all. I got cereal. I got some frozen meat, hamburger buns. I got a bag of black beans, and then I got a bag of rice.”
Finding a package of chicken strips, a dish she knew her picky 2-year-old daughter would actually eat, almost made her cry, Jackson said. She expects the combination of perishable, bagged and canned foods to last them a month. By then, she hopes her Supplemental Nutrition Assistance Program (SNAP) payments — widely known as food stamps — will have resumed.
On November 1, SNAP benefits ground to a halt during the federal budget impasse that began a month earlier, with President Donald Trump’s administration refusing to fully fund these payments, a matter now tied up in court. Even as the Senate has reached a framework deal that leaves lawmakers and the White House a step closer to ending the shutdown, the disruption in benefits has revealed how fragile the social safety net is for vulnerable Americans. That includes single parents and young adults experiencing food insecurity, a problem that occurs when people lack regular access to the nourishment needed to sustain their health.
An estimated 1.1 million college students rely on SNAP, including parents like Jackson, who attends North Dakota State University (NDSU) in Fargo. For such students, a delayed SNAP payment isn’t a mere hiccup, but a serious setback that can imperil their education, their health and stability for their children, experts contend.
“It’s such a distraction for me as a single mom in school,” Jackson said. “I don’t have any bandwidth to give to trying to find food at pantries.”
She tried to minimize the time she spent at the food pantry last week by making an appointment first, but she was still one of a couple of dozen people in line. The visit prevented her from completing her research paper by its due date, which will likely result in her grade being docked. Jackson, who has so far maintained a 4.0 grade point average, isn’t happy about that prospect, but with her family members an hour away and her child’s father mostly out of the picture, she had to prioritize food over her education.
No college student should have to choose between a basic need and school, said Deborah Martin, a senior policy associate for The Institute for College Access & Success, a nonprofit that advocates for college access and affordability.
“A lot of students have to make these daily tough decisions where they’re wondering, ‘Where am I going to get my next meal from?’ instead of focusing on homework, on classwork,” Martin said. “We know that when students have these unmet basic needs such as food insecurity, they’re more likely to struggle academically, less likely to persist from semester to semester, and in some cases, may even drop out of college altogether.”
Roughly 60 percent of college students are women. For the most marginalized students, the risk of quitting school due to food insecurity may be even greater. The Government Accountability Office (GAO), a nonpartisan federal agency that provides fact-based information to Congress, reported last year that about 80 percent of food-insecure students are nontraditional — meaning their parents don’t financially support them, they didn’t begin college immediately after high school or they are caring for dependents. Moreover, the 2023-2024 Student Basic Needs Survey Report from the Hope Center, a research center at Temple University focused on the food, housing and health of college students, found that around three-quarters of parenting, Black and Indigenous students experience insecurity related to a basic need.
Most of these students, the GAO discovered, do not sign up for services like SNAP, and those who do may hesitate to discuss their food insecurity. As a mom and a slightly older student who works part-time, Jackson has felt largely alone on campus as SNAP benefits have paused. Her classmates don’t appear to share her anxiety over the shutdown, if they know about it at all.
A woman shops at the Feeding South Florida food pantry on October 27, 2025 in Pembroke Park, Florida. (Joe Raedle/Getty Images)
“A lot of the kids that I’m in class with, they’re not in the same circumstance,” Jackson said. “It’s weird to see a lot of people just carrying on as usual.”
Since most of her classmates — about an even percentage of NDSU students are women and men — are childfree and on the school meal plan, she doesn’t want to be a “downer” by bringing up her difficulties. For the same reason, she didn’t explain to her professor why her paper was late. “I didn’t want to tell him, ‘Oh, I couldn’t write it because I was standing in the food pantry line’ because it just sounds so sad,” she said. “What’s he supposed to say? I don’t want him to feel bad for me. I don’t want to be pitied.”
But faking normal could come at a high cost for college students who don’t reach out for help. Martin fears these young adults will resort to using high-interest payment plans or acquire credit card debt just to afford groceries.
“The longer that students and other SNAP participants don’t receive their funds, this is just more days that students are going to have to make these difficult decisions,” she said.
Some college administrators are taking action. When the shutdown began, Compton College President and CEO Keith Curry contacted Everytable, a food company that offers inexpensive made-from-scratch meals via carryout storefronts and a delivery service. The college, about 18 miles southeast of downtown Los Angeles, has partnered with Everytable for seven years to provide all students — approximately 6,000 of whom attend full time — with one nutritious free meal on weekdays.
The federal government crisis prompted Curry and Everytable CEO Sam Polk to scale up that program so SNAP-recipient and economically disadvantaged students didn’t suffer during the shutdown.
“We need to do something. Can we split the cost?” Curry recalled asking Polk. “I think if we double the meals, at least they get another meal for the day.”
On November 5, Compton College’s most underprivileged students began getting two free meals per day, or 10 per week. The need for such an intervention there is substantial: A 2025 basic needs survey of students found that 81 percent of them experience at least one form of insecurity related to a basic need. That includes signs of food insecurity such as skipping meals, reducing meal sizes or fearing they will run out of food. Most Compton College students are moderately food insecure, the survey revealed, indicating persistent hardship. Women make up 61 percent of the student body.
“Right now, students have other stress, and what we’re doing to them is adding more stress,” Curry said of the shutdown. “They still want to do well in classes, but now they don’t have food.”
Together, Compton College and Everytable have the resources to supply students with 10 weekly meals for a month, Curry said. The students are deeply grateful for the additional provisions, according to Dee Garrett, who oversees Everytable’s operation at the college.
“What better way to start your studies than with a stomach that’s full?” Garrett asked. “You don’t have to think about, ‘Oh, my God, my stomach. I can’t concentrate or focus.’”
Asked what impact he hopes the scaled-up program makes, Curry said he’s more interested in letting students know they’re not alone.
“It’s not about the impact. It’s about our students knowing that we were there for them during this time,” he said. “In our community, when students need us most, we have to step up and be there for them, and they’re never going to forget that.”
Martin applauds the efforts of colleges and K-12 schools, which have connected students and their families to food banks, to curb food insecurity during the shutdown. But she also advocates for long-term policies to ensure students have enough food to eat. That includes the Enhance Access to SNAP Act, proposed legislation to remove the barriers that prevent economically disadvantaged college students from utilizing benefits generally — not just during the current crisis.
However, Martin continued, “the most important thing that we can do right now in this moment is for these SNAP benefits to be fully funded and for them to go out to students as soon as possible.”
Back in Fargo, Jackson has refocused her attention on her coursework now that she has a month’s worth of food. Still, she worries about the people who couldn’t make it to a pantry or that the government will cut other social services she needs. She currently earns $400 monthly working part time as an academic journal editor. The job, which she performs remotely, allows her to attend school and be her daughter’s primary caretaker when the toddler is not in day care.
“If they cut child care, if they cut these programs I rely on, I would have to drop out of school,” Jackson said. “But I’m trying to give my daughter a better life than that.”
Jackson is majoring in university studies with a pre-law emphasis, a dramatic shift from her life before motherhood when she dropped out of school and struggled with addiction. Getting pregnant inspired her to undergo a transformation, which she largely credits to the Jeremiah Program. The national nonprofit provides single mothers with support for college, child care and housing, and it recently started a campaign to raise $190,000 to cover essential needs for families who have lost SNAP and other benefits because of the shutdown. The organization estimates that single-parent families represent nearly a third of families in the United States, with 80 percent of those headed by mothers.
Jackson has been deeply disturbed to see the misperceptions that abound about mothers like herself. She’s encountered online commenters who have characterized SNAP recipients as “welfare queens.”
If she could confront such individuals in person, Jackson would emphasize how much value mothers add to society. “And on top of it… we are all in school and working, too,” she said. “The insinuation is that we’re just scammers, freeloaders, when, in reality, I’m working very hard every day to hopefully not need these supports.”
This audio is auto-generated. Please let us know if you have feedback.
Dive Brief:
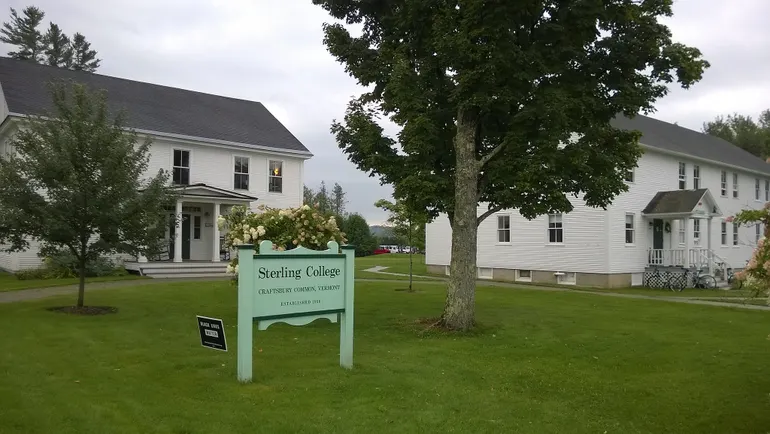
Sterling College, in Vermont, plans to close after its spring 2026 semester in response to enrollment declines and financial pressure, the private institution announced Wednesday.
The environmental studies-focused college will end its associate and bachelor’s programs following the spring semester,after which it plans to operate its summer internship program, depending on student need.
In its announcement, Sterling said that its governing board’s decision to close “reflects the College’s commitment to transparency, responsibility, and care in the face of persistent financial and enrollment challenges.”
Dive Insight:
Fewer than 40 students are at Sterling for the current semester, with about 30 faculty and staff members running the college, the institution’s president, Scott Thomas, told a local media outlet this week.
Closing now “allows us to responsibly support students through their continuing time at Sterling and assist with transitions to partner institutions,” the college said in a FAQ about its closing.
Sterling is finalizing several teach-out agreements with regional peers College of the Atlantic, Community College of Vermont and Champlain College, all of which will require the approval of its accreditor, the New England Commission of Higher Education. The college will hold its final commencement in May, it said.
Just between 2021 and 2023, the small college’s enrollment fell by just over 38% to 78 students, according to federal data.
Sterling’s tuition revenue declined with the shrinking student body. Between fiscal years 2021 and 2024, net tuition and fee revenue dipped 10.3% to about $835,700.
The college was also heavily dependent on private grants to sustain it. In 2024, for example, it logged $4.9 million in grant revenue, most of it restricted.However, the college’s endowment was relatively paltry. Its total investment assets amounted to $1.2 million in 2024.
Founded over 65 years ago,Sterling offers bachelor’s and associate degrees only in environmental studies.Bachelor’s students have the option to pursue self-directed concentrations in topics under the environmental umbrella, such as ecology, natural resource management and social justice.
The college touts outdoor learning and its experiential approach. Along with NECHE, it is accredited by the Association for Experiential Education, and it is one of a handful of federally recognized work colleges, which require students have work at least 80 hours per semester as part of their educational program.
Based in Craftsbury, Vermont, Sterling owns forest, wetlands, a farm, a yurt, a climbing wall and 307 acres in nearby Bear Swamp.The college encourages students to camp for short periods on campus property and allows them to hunt, fish and trap during designated seasons outside the campus center.
The college’s property was valued at $3.4 million in fiscal 2024. Sterling said the board will later decide “how to steward the College’s remaining resources in a manner consistent with its mission and all applicable legal requirements.”
Given the possibility of running its internship program through August “if needed,” the college noted that “it is, as yet, unknown if and when College operations will cease entirely.”
Since 2022, there’s been a surge in the number and types of applications using generative AI, but not all tools are the same. So how can faculty, staff and students learn to identify the differences and determine when it’s appropriate to leverage these tools?
Colby College developed a platform, called Mule Chat, that allows users to explore several large language models, including ChatGPT, Gemini, Claude and LLaMA. The platform provides a safe on-ramp into generative AI usage and relies on student tutors to disseminate information to peers.
In the latest episode of Voices of Student Success, host Ashley Mowreader speaks with David Watts, the director of Colby College’s Davis Institute for Artificial Intelligence, and Michael Yankoski, Davis AI research and teaching scientist, to learn about the college’s AI institute and how Mule Chat works.
An edited version of the podcast appears below.
Inside Higher Ed: Can we start the conversation by talking a bit about what AI at Colby College looks like? What is the landscape you’re working with and how are you thinking about AI when it comes to teaching and learning?
David Watts: I am new to Davis AI, as we call it at Colby, but the [Davis AI] Institute has actually been around since before ChatGPT, so Colby kind of had a pioneering approach.
David Watts, director of the Davis Institute for AI at Colby College
Colby is a small liberal arts college, and they had the vision that this was going to be around for a while. And rather than, as most institutions were doing, sort of keep it at bay or ban it from campus, Colby dove in and wanted to engage with it and understand how it is going to impact education.
I spent most of my career in industry, mostly in research and development, and so I when I wanted to make the jump over to academia, I wasn’t expecting to find that small liberal arts colleges had done this, and when I saw what Colby had done, I was really drawn to it and came over. So I’ve really loved what has been going on and what continues to go on at Colby with the Davis Institute for Artificial Intelligence.
Inside Higher Ed: Michael, your role puts you directly in connection with faculty when it comes to integrating AI into their classrooms or into their programs. Can you talk about what that looks like and how maybe that looks different at a liberal arts institution?
Michael Yankoski, research and teaching scientist, Davis Institute for AI at Colby College
Michael Yankoski: One of the most amazing aspects of the Davis Institute for Artificial Intelligence here at a place like Colby is the liberal arts approach that the institution as a whole is able to engage with.
That means that we’re able to facilitate conversations from a multiplicity of different disciplines and bring faculty together from different approaches across the divisions in the college—from the STEM fields to the humanities to the social sciences. And have really productive, very generative conversations around ways to engage with artificial intelligence and the shared learning and shared knowledge of people who have been really pioneering in the area. To able to say, “How can I integrate generative artificial intelligence with my pedagogy? How can I help think with students about how to engage these technologies in a way that is beneficial for their education, help empower students in their education and then on the research side?”
Many faculty with whom we work at the Davis Institute are exploring ways to integrate artificial intelligence in their research program, and to say, “Is there a way that artificial intelligence can help me accelerate my research or take my research in new directions?” The opportunity to bring people together to discuss that and to facilitate those conversations across the disciplines is one of the best aspects of the liberal arts approach to artificial intelligence.
Inside Higher Ed: Does Colby have an institutional policy for AI use, or what appropriate AI use looks like?
Watts: It’s a moving target. Anyone who tells you they have it all figured out is probably embellishing. It is a moving target, but one of the things we did was make sure we engage faculty, and in fact, we started with faculty, then we engaged administrators, we engaged students and we engaged general counsel, and evaluated what the challenges are, what the downsides are. And we made sure that we built what we call guidelines rather than policy.
The guidelines talk through the dos and don’ts but also leave enough flexibility for our faculty to think through how they want to engage with AI, especially since AI is a moving target, too. As we grow and learn with our faculty, we adapt and adjust our guidelines and so they’re out there for everyone to see, and we will continue to evolve them as we move forward.
Inside Higher Ed: Can you introduce our listeners to Mule Chat? What is it and how does it work on campus?
Watts: Michael has been here and was one of the originators of creating Mule Chat on campus. And so he can tell you a lot of the details and how it’s been working.
But what I loved about what Michael and the team did, and it was a collaborative effort, was to create, I’ll call it an on-ramp. We were working towards moving the needle from banning AI, as one extreme, to engaging with AI and creating a tool that allowed faculty, students and staff to all easily engage with multiple tools through Mule Chat.
It lowered the activation barrier to entry to AI and allowed us to have an on-ramp for people to come in and start seeing what the possibilities are, and it has worked brilliantly.
Yankoski: The idea behind Mule Chat originally was to provide a place for students, faculty and staff to begin to get experience with and understanding around generative AI. To provide a space where folks could come and understand a bit more about, what are these tools? How do they work? What are they capable of? What are some of the areas we need to be aware of, the risks and the best practices, and how can we provide this on-ramp, as David described, for people to be able to engage with generative artificial intelligence?
This is about student success, empowering students to understand what these technologies are, what they’re good at, what they’re not good at. And then also, one of the key principles here was equity of access. We wanted to ensure that anybody on Colby’s campus, regardless of whether they could afford one of the premium subscription services, was able to get access to these frontier models and to understand how to then do the prompt engineering work, and to then compare the kinds of outputs and capabilities of some of the frontier models. And so really, the core sort of genesis and driving desire for the creation of Mule Chat was to provide this on-ramp that would empower student success, allow equity of access, and also would provide a safe and secure place for people to be able to engage these technologies and to learn.
Inside Higher Ed: Can you describe the functionality of Mule Chat? For someone who has never experimented with LLMs, what does it look like or feel like to engage with Mule Chat?
Watts: You touched on something really great there, because that was part of the idea. We introduced multiple models into Mule Chat so that people could compare and get an idea of what it’s capable of and what it’s not capable of.
I’ll give an example of a faculty member who we are working with right now who started with Mule Chat, engaged with it in their preparation—this is a professor of East Asian studies—how they prepare their classes, realized what the capabilities were, started doing more with it, with their students. The students then brought interesting ideas about what else we can do and pushed beyond even the limits of Mule Chat. And then Davis AI can go help them bring in, for example, they were looking at—not only just looking at old archives and using that in their teaching of East Asian studies, but also bringing in video capability, for example, and in fact, even creating new videos or some of the research that they’re doing now, bringing in more capabilities above and beyond Mule Chat. So it is exactly what Michael was saying, an on-ramp that then opens up the possibilities of what we can do with AI in higher education.
Yankoski: I think the real value of the Mule Chat interface is that it allows people to compare the different models.
Folks can use prompt engineering to compare the outputs of one model and then put that alongside the outputs of another model and be able to observe the way that different models might reason or might do their inference in different kinds of ways.
That side-by-side comparison is a really powerful opportunity for people to engage with the different models and to experience the different kinds of outputs that they create. To build on what David was saying, the ability to then put other tools [like videos] inside of the Mule Chat platform, that allows for deeper research into particular areas. For example, we have a tool that we built, which is called Echo Bot.
The Colby student newspaper is called the Colby Echo, so we’ve been able to bring all the archives of the Echo into a tool that allows students and faculty researchers to engage with those archives and chat with the entire archive of the Colby Echo. We’ve been working closely—and this goes back to the liberal arts approach—with different faculty across campus, as well as the college libraries, to bring this tool online and make it available within the Mule Chat system.
Inside Higher Ed: Let me know if you can build me an IHE bot, because I can never find anything in our archives. I could really benefit from something.
Watts: We can brainstorm on that.
Inside Higher Ed: Great, we’ll talk about licensing later.
I wanted to ask, it seems there’s a new AI tool that pops every other day. So when you’re talking about comparing different tools and thinking about what might be most relevant for students, how often are you scouting out the landscape to understand what’s out there and relevant?
Watts: That’s a great question, and actually extremely important that we do that.
Not only are we reaching out and finding, reading, learning, attending conferences, helping to create conferences ourselves that bring in people and experts who are different perspectives, but we also then have lots of people on campus who have their own ideas. People come to us regularly with, “Oh, look at this cool tool. We should use it for this thing on campus.”
And that’s when we use that for educating people about some of the potential pitfalls that we have to watch out for, talking about guardrails and when you’re bringing in new capability, just like you had to think about when you’re bringing in new software. But I think it’s even more imperative that we’re very careful about what AI tools we bring into campus. You’re absolutely right that there are tons of them that all have different capabilities. But one of the things we try to teach is that there’s a full spectrum: the great, the good, the bad and the ugly. You have to think about that entire spectrum. And that’s one of the beauties of what I loved about coming to a liberal arts college was that you have multiple perspectives, and coming from all forms of disciplines in the humanities, the arts, the natural sciences, the social sciences, and all are engaged and can be engaged across AI.
Yankoski: I think that’s what’s so unique and really powerful about the Davis Institute for Artificial Intelligence approach. When we work with faculty and students and really, if some faculty member or student has an idea that they want to explore, we have structures that allow for technology grants, for faculty to be able to come and to propose the use of a new tool, or to advance their teaching or to advance their research.
Then that’s a great opportunity to engage with that faculty member and perhaps their research assistants, and work with those students and that faculty member to explore the possibility of using that tool. Each faculty member knows their domain so much better than we do. As the core Davis AI team, we’re able to work with that faculty and those students to better understand the use case, better understand the tools that they want to engage, and then work with them to consult and to create a pathway forward. That’s an incredible opportunity as well for the students to understand, how do we think about the security of the data? How do we think about the processing pipeline? How do we think about the best practices with regards to utilizing artificial intelligence in this particular domain?
Really that’s about student empowerment and student success as they get ready to transition out of college into an economy where increasingly expectations around knowledge and the ability to utilize and to vet artificial intelligence are only going to increase.
Inside Higher Ed: How are students engaged in this work?
Yankoski: One the most intriguing aspects of Mule Chat has been that students have been really leading in teaching and empowering other students to utilize the tool and to understand the quantum engineering aspects and to understand the different models.
The student leaders have been working with Mule Chat and then actually teaching other students, teaching faculty and helping lead the sessions, as well as working on their own projects within Google Chat. So it’s been a really strong and quite incredible platform for student engagement and student empowerment as students learn from one another and then are able to learn how to teach about these tools to their peers.
Watts: That’s absolutely a huge part of what we did, and I mentioned that, even though students come first, we started working to move the needle with faculty first on purpose, with students in mind. And then we branched out into, now we can engage the students. Once you have enough buy-in from faculty, start engaging the students, and we’ve been doing a lot of that.
Then what’s beautiful, the magic happens when the students start coming up with thoughts and ideas that grow in ways that faculty haven’t thought of. Because remember that a lot of this is new to faculty as well.
So we actually then will identify key students that we have been working with and actually hire them on board as Davis AI research associates that then help us continue to move the needle, because there’s nothing better for students than to hear from other students about what’s possible. And the same goes for faculty, by the way. So, you know, Michael was mentioning a little bit about our strategy with faculty and how we engage them. But a part of what we do is faculty sessions. We give them creative names like “Bagels and bots,” and we include food and then we have those sessions where faculty talk to faculty. We do the same with the students, so students can talk to students. And it’s just wonderful to see the magic that happens when that begins to grow organically.
Inside Higher Ed: What has the reception been to Mule Chat?
Watts: Most people were skeptical [of AI] early on; most were in the mode of “push it away.” I think that drove some interesting behaviors in faculty and students.
So a big part of what we’ve been trying to do is essentially drive towards AI literacy for all. And when I say all, it’s an interdisciplinary approach. We’re looking across the entire campus, and so all students in all departments are what we’re driving towards. Now, you correctly point out that there will always be skeptics. I will strive for 100 percent, but if we asymptotically approach that into the future, I’ll live with that.
The goal is to prepare students, and that’s who we need to make sure that we’re preparing for the life they’re going to go into that’s been transformed by AI, that touches everybody. One of the cool things is we’re giving out grants to faculty to engage with AI and come up with ideas, and we’re doing that on multiple levels, and those faculty are now coming from all. We have art professors. We have writing professors. We have East Asian studies. We have professors from government, we have all of them engaging and so we’ve been able to, therefore, move the needle quite a bit so that a lot more people are a lot more receptive and open to it on campus, which is great.
Inside Higher Ed: You mentioned that Colby has a faculty-led approach, but sometimes that means that students from specific majors or disciplines might be less exposed to AI than others, depending on who their faculty are. It seems like you all are taking a balanced approach, not only encouraging enthusiastic AI entrepreneurs but also working with the skeptics.
Watts: It’s absolutely critical that we work on both ends of that spectrum, if that makes sense. We’re driving great innovation, and there’s great examples of research right here on campus that are doing wonderful things in an interdisciplinary way.
We just won an NSF grant for ARIA, an NSF institute looking at AI assistance in mental health, because that’s one of the most challenging spaces for how the models interact with people with mental and behavioral health challenges. It’s a perfect example of our interdisciplinary approach, with a professor from psychology working with a professor from computer science to go tackle these challenging areas. And I think that’s one of the things that Colby has done well, is to take that broader, interdisciplinary approach. Many people say that word now, but I think the liberal arts are primed for leading the charge on what that’s going to look like, because AI, by its nature, is interdisciplinary.
Inside Higher Ed: What’s next on campus? Is there any area that you’re all exploring or looking to do some more research in, or new tools and initiatives that our listeners should know about for the future?
Watts: We’re consistently evaluating that and bringing them in. What we’re trying to do is let it grow based on need as people explore and come up with ideas.
I mentioned the video; we’re now enabling video capability so we can do some of that research. It also opens up more multimodal approaches.
One of the approaches to the ARIA research, for example, is we want to be able to detect and therefore build context-aware assistance to have better results for everyone. So if we can solve the mental and behavioral health challenges, it’s probably one of the most difficult ones. It can also solve some of the other areas of underrepresented people who are left out or underrepresented groups who are left out of training, for example, which can lead to challenging behaviors.
I’m really excited about all of those possibilities and the areas that allow us to enable. We talked about access, we can also talk about accessibility.
We have on campus the Colby College Museum of Art; one of the faculty in computer science is exploring accessibility options using AI with a robotic seeing-eye dog. If someone wanted to visit the museum who was blind or visually impaired, they could interact with a seeing-eye dog that they’re used to, but this seeing-eye dog now might have more capability to communicate with people about what they’re seeing and in a museum setting, for example.
So really excited about that type of research: how do we really benefit humanity with these types of tools.
Inside Higher Ed: One thing I wanted to ask about is resources allocated from the university to be able to access all these tools. What investment is the college making to ensure that students are able to stay on the cutting edge of AI initiatives?
Watts: That’s absolutely critical. We want to make it no cost to our students and accessible to our students, but it still costs. So [it’s vital to] make sure that we have funding.
We were very lucky that we got a Davis endowment that enabled us to build the Davis Institute. That was huge because, and you can think about some of the challenges with federal funding and all of that stuff, but to have an endowment that allowed us to draw on that and really build strong capabilities at Colby College was critical. But you’re touching on the fact that we’re going to need to continue to do that. And that’s where, for example, the NSF grant and other grants that we will continue to explore will help us with how we continue to grow our impact and grow our value as we head into the future.
Sterling College will close at the end of the spring semester, officials announced Wednesday.
The small college in Craftsbury Common, Vt., will cease operations in May due to “persistent financial and enrollment challenges,” according to a statement posted on its website.
“We understand that this news is difficult and deeply personal for every member of our community. Sterling College has always been more than a place of learning; it has been a home where curiosity, creativity, and compassion thrived,” officials wrote in the closure announcement.
Sterling, which offered “transdisciplinary, experiential, competency-assessed educational programs,” according to its website, historically capped enrollment at 125 students. Founded in 1958, Sterling is one of a few U.S. work colleges, a model that allows students to keep tuition down via campus labor. Residential students at Sterling work five hours per week in different roles.
Federal data shows that Sterling only had a head count of 78 students in fall 2023.
While the college managed to eke out modest surpluses in recent years, it had a meager endowment of just over $1.1 million, much of that restricted, according to financial documents.
Sterling is now the second institution to announce a closure this month, following Trinity Christian College in Illinois, which is shutting down next year due to similar challenges.
Since 2022, there’s been a surge in the number and types of applications using generative AI, but not all tools are the same. So how can faculty, staff and students learn to identify the differences and determine when it’s appropriate to leverage these tools?
Colby College developed a platform, called Mule Chat, that allows users to explore several large language models, including ChatGPT, Gemini, Claude and LLaMA. The platform provides a safe on-ramp into generative AI usage and relies on student tutors to disseminate information to peers.
In the latest episode of Voices of Student Success, host Ashley Mowreader speaks with David Watts, the director of Colby College’s Davis Institute for Artificial Intelligence, and Michael Yankoski, Davis AI research and teaching scientist, to learn about the college’s AI institute and how Mule Chat works.
An edited version of the podcast appears below.
Inside Higher Ed: Can we start the conversation by talking a bit about what AI at Colby College looks like? What is the landscape you’re working with and how are you thinking about AI when it comes to teaching and learning?
David Watts: I am new to Davis AI, as we call it at Colby, but the [Davis AI] Institute has actually been around since before ChatGPT, so Colby kind of had a pioneering approach.
David Watts, director of the Davis Institute for AI at Colby College
Colby is a small liberal arts college, and they had the vision that this was going to be around for a while. And rather than, as most institutions were doing, sort of keep it at bay or ban it from campus, Colby dove in and wanted to engage with it and understand how it is going to impact education.
I spent most of my career in industry, mostly in research and development, and so I when I wanted to make the jump over to academia, I wasn’t expecting to find that small liberal arts colleges had done this, and when I saw what Colby had done, I was really drawn to it and came over. So I’ve really loved what has been going on and what continues to go on at Colby with the Davis Institute for Artificial Intelligence.
Inside Higher Ed: Michael, your role puts you directly in connection with faculty when it comes to integrating AI into their classrooms or into their programs. Can you talk about what that looks like and how maybe that looks different at a liberal arts institution?
Michael Yankoski, research and teaching scientist, Davis Institute for AI at Colby College
Michael Yankoski: One of the most amazing aspects of the Davis Institute for Artificial Intelligence here at a place like Colby is the liberal arts approach that the institution as a whole is able to engage with.
That means that we’re able to facilitate conversations from a multiplicity of different disciplines and bring faculty together from different approaches across the divisions in the college—from the STEM fields to the humanities to the social sciences. And have really productive, very generative conversations around ways to engage with artificial intelligence and the shared learning and shared knowledge of people who have been really pioneering in the area. To able to say, “How can I integrate generative artificial intelligence with my pedagogy? How can I help think with students about how to engage these technologies in a way that is beneficial for their education, help empower students in their education and then on the research side?”
Many faculty with whom we work at the Davis Institute are exploring ways to integrate artificial intelligence in their research program, and to say, “Is there a way that artificial intelligence can help me accelerate my research or take my research in new directions?” The opportunity to bring people together to discuss that and to facilitate those conversations across the disciplines is one of the best aspects of the liberal arts approach to artificial intelligence.
Inside Higher Ed: Does Colby have an institutional policy for AI use, or what appropriate AI use looks like?
Watts: It’s a moving target. Anyone who tells you they have it all figured out is probably embellishing. It is a moving target, but one of the things we did was make sure we engage faculty, and in fact, we started with faculty, then we engaged administrators, we engaged students and we engaged general counsel, and evaluated what the challenges are, what the downsides are. And we made sure that we built what we call guidelines rather than policy.
The guidelines talk through the dos and don’ts but also leave enough flexibility for our faculty to think through how they want to engage with AI, especially since AI is a moving target, too. As we grow and learn with our faculty, we adapt and adjust our guidelines and so they’re out there for everyone to see, and we will continue to evolve them as we move forward.
Inside Higher Ed: Can you introduce our listeners to Mule Chat? What is it and how does it work on campus?
Watts: Michael has been here and was one of the originators of creating Mule Chat on campus. And so he can tell you a lot of the details and how it’s been working.
But what I loved about what Michael and the team did, and it was a collaborative effort, was to create, I’ll call it an on-ramp. We were working towards moving the needle from banning AI, as one extreme, to engaging with AI and creating a tool that allowed faculty, students and staff to all easily engage with multiple tools through Mule Chat.
It lowered the activation barrier to entry to AI and allowed us to have an on-ramp for people to come in and start seeing what the possibilities are, and it has worked brilliantly.
Yankoski: The idea behind Mule Chat originally was to provide a place for students, faculty and staff to begin to get experience with and understanding around generative AI. To provide a space where folks could come and understand a bit more about, what are these tools? How do they work? What are they capable of? What are some of the areas we need to be aware of, the risks and the best practices, and how can we provide this on-ramp, as David described, for people to be able to engage with generative artificial intelligence?
This is about student success, empowering students to understand what these technologies are, what they’re good at, what they’re not good at. And then also, one of the key principles here was equity of access. We wanted to ensure that anybody on Colby’s campus, regardless of whether they could afford one of the premium subscription services, was able to get access to these frontier models and to understand how to then do the prompt engineering work, and to then compare the kinds of outputs and capabilities of some of the frontier models. And so really, the core sort of genesis and driving desire for the creation of Mule Chat was to provide this on-ramp that would empower student success, allow equity of access, and also would provide a safe and secure place for people to be able to engage these technologies and to learn.
Inside Higher Ed: Can you describe the functionality of Mule Chat? For someone who has never experimented with LLMs, what does it look like or feel like to engage with Mule Chat?
Watts: You touched on something really great there, because that was part of the idea. We introduced multiple models into Mule Chat so that people could compare and get an idea of what it’s capable of and what it’s not capable of.
I’ll give an example of a faculty member who we are working with right now who started with Mule Chat, engaged with it in their preparation—this is a professor of East Asian studies—how they prepare their classes, realized what the capabilities were, started doing more with it, with their students. The students then brought interesting ideas about what else we can do and pushed beyond even the limits of Mule Chat. And then Davis AI can go help them bring in, for example, they were looking at—not only just looking at old archives and using that in their teaching of East Asian studies, but also bringing in video capability, for example, and in fact, even creating new videos or some of the research that they’re doing now, bringing in more capabilities above and beyond Mule Chat. So it is exactly what Michael was saying, an on-ramp that then opens up the possibilities of what we can do with AI in higher education.
Yankoski: I think the real value of the Mule Chat interface is that it allows people to compare the different models.
Folks can use prompt engineering to compare the outputs of one model and then put that alongside the outputs of another model and be able to observe the way that different models might reason or might do their inference in different kinds of ways.
That side-by-side comparison is a really powerful opportunity for people to engage with the different models and to experience the different kinds of outputs that they create. To build on what David was saying, the ability to then put other tools [like videos] inside of the Mule Chat platform, that allows for deeper research into particular areas. For example, we have a tool that we built, which is called Echo Bot.
The Colby student newspaper is called the Colby Echo, so we’ve been able to bring all the archives of the Echo into a tool that allows students and faculty researchers to engage with those archives and chat with the entire archive of the Colby Echo. We’ve been working closely—and this goes back to the liberal arts approach—with different faculty across campus, as well as the college libraries, to bring this tool online and make it available within the Mule Chat system.
Inside Higher Ed: Let me know if you can build me an IHE bot, because I can never find anything in our archives. I could really benefit from something.
Watts: We can brainstorm on that.
Inside Higher Ed: Great, we’ll talk about licensing later.
I wanted to ask, it seems there’s a new AI tool that pops every other day. So when you’re talking about comparing different tools and thinking about what might be most relevant for students, how often are you scouting out the landscape to understand what’s out there and relevant?
Watts: That’s a great question, and actually extremely important that we do that.
Not only are we reaching out and finding, reading, learning, attending conferences, helping to create conferences ourselves that bring in people and experts who are different perspectives, but we also then have lots of people on campus who have their own ideas. People come to us regularly with, “Oh, look at this cool tool. We should use it for this thing on campus.”
And that’s when we use that for educating people about some of the potential pitfalls that we have to watch out for, talking about guardrails and when you’re bringing in new capability, just like you had to think about when you’re bringing in new software. But I think it’s even more imperative that we’re very careful about what AI tools we bring into campus. You’re absolutely right that there are tons of them that all have different capabilities. But one of the things we try to teach is that there’s a full spectrum: the great, the good, the bad and the ugly. You have to think about that entire spectrum. And that’s one of the beauties of what I loved about coming to a liberal arts college was that you have multiple perspectives, and coming from all forms of disciplines in the humanities, the arts, the natural sciences, the social sciences, and all are engaged and can be engaged across AI.
Yankoski: I think that’s what’s so unique and really powerful about the Davis Institute for Artificial Intelligence approach. When we work with faculty and students and really, if some faculty member or student has an idea that they want to explore, we have structures that allow for technology grants, for faculty to be able to come and to propose the use of a new tool, or to advance their teaching or to advance their research.
Then that’s a great opportunity to engage with that faculty member and perhaps their research assistants, and work with those students and that faculty member to explore the possibility of using that tool. Each faculty member knows their domain so much better than we do. As the core Davis AI team, we’re able to work with that faculty and those students to better understand the use case, better understand the tools that they want to engage, and then work with them to consult and to create a pathway forward. That’s an incredible opportunity as well for the students to understand, how do we think about the security of the data? How do we think about the processing pipeline? How do we think about the best practices with regards to utilizing artificial intelligence in this particular domain?
Really that’s about student empowerment and student success as they get ready to transition out of college into an economy where increasingly expectations around knowledge and the ability to utilize and to vet artificial intelligence are only going to increase.
Inside Higher Ed: How are students engaged in this work?
Yankoski: One the most intriguing aspects of Mule Chat has been that students have been really leading in teaching and empowering other students to utilize the tool and to understand the quantum engineering aspects and to understand the different models.
The student leaders have been working with Mule Chat and then actually teaching other students, teaching faculty and helping lead the sessions, as well as working on their own projects within Google Chat. So it’s been a really strong and quite incredible platform for student engagement and student empowerment as students learn from one another and then are able to learn how to teach about these tools to their peers.
Watts: That’s absolutely a huge part of what we did, and I mentioned that, even though students come first, we started working to move the needle with faculty first on purpose, with students in mind. And then we branched out into, now we can engage the students. Once you have enough buy-in from faculty, start engaging the students, and we’ve been doing a lot of that.
Then what’s beautiful, the magic happens when the students start coming up with thoughts and ideas that grow in ways that faculty haven’t thought of. Because remember that a lot of this is new to faculty as well.
So we actually then will identify key students that we have been working with and actually hire them on board as Davis AI research associates that then help us continue to move the needle, because there’s nothing better for students than to hear from other students about what’s possible. And the same goes for faculty, by the way. So, you know, Michael was mentioning a little bit about our strategy with faculty and how we engage them. But a part of what we do is faculty sessions. We give them creative names like “Bagels and bots,” and we include food and then we have those sessions where faculty talk to faculty. We do the same with the students, so students can talk to students. And it’s just wonderful to see the magic that happens when that begins to grow organically.
Inside Higher Ed: What has the reception been to Mule Chat?
Watts: Most people were skeptical [of AI] early on; most were in the mode of “push it away.” I think that drove some interesting behaviors in faculty and students.
So a big part of what we’ve been trying to do is essentially drive towards AI literacy for all. And when I say all, it’s an interdisciplinary approach. We’re looking across the entire campus, and so all students in all departments are what we’re driving towards. Now, you correctly point out that there will always be skeptics. I will strive for 100 percent, but if we asymptotically approach that into the future, I’ll live with that.
The goal is to prepare students, and that’s who we need to make sure that we’re preparing for the life they’re going to go into that’s been transformed by AI, that touches everybody. One of the cool things is we’re giving out grants to faculty to engage with AI and come up with ideas, and we’re doing that on multiple levels, and those faculty are now coming from all. We have art professors. We have writing professors. We have East Asian studies. We have professors from government, we have all of them engaging and so we’ve been able to, therefore, move the needle quite a bit so that a lot more people are a lot more receptive and open to it on campus, which is great.
Inside Higher Ed: You mentioned that Colby has a faculty-led approach, but sometimes that means that students from specific majors or disciplines might be less exposed to AI than others, depending on who their faculty are. It seems like you all are taking a balanced approach, not only encouraging enthusiastic AI entrepreneurs but also working with the skeptics.
Watts: It’s absolutely critical that we work on both ends of that spectrum, if that makes sense. We’re driving great innovation, and there’s great examples of research right here on campus that are doing wonderful things in an interdisciplinary way.
We just won an NSF grant for ARIA, an NSF institute looking at AI assistance in mental health, because that’s one of the most challenging spaces for how the models interact with people with mental and behavioral health challenges. It’s a perfect example of our interdisciplinary approach, with a professor from psychology working with a professor from computer science to go tackle these challenging areas. And I think that’s one of the things that Colby has done well, is to take that broader, interdisciplinary approach. Many people say that word now, but I think the liberal arts are primed for leading the charge on what that’s going to look like, because AI, by its nature, is interdisciplinary.
Inside Higher Ed: What’s next on campus? Is there any area that you’re all exploring or looking to do some more research in, or new tools and initiatives that our listeners should know about for the future?
Watts: We’re consistently evaluating that and bringing them in. What we’re trying to do is let it grow based on need as people explore and come up with ideas.
I mentioned the video; we’re now enabling video capability so we can do some of that research. It also opens up more multimodal approaches.
One of the approaches to the ARIA research, for example, is we want to be able to detect and therefore build context-aware assistance to have better results for everyone. So if we can solve the mental and behavioral health challenges, it’s probably one of the most difficult ones. It can also solve some of the other areas of underrepresented people who are left out or underrepresented groups who are left out of training, for example, which can lead to challenging behaviors.
I’m really excited about all of those possibilities and the areas that allow us to enable. We talked about access, we can also talk about accessibility.
We have on campus the Colby College Museum of Art; one of the faculty in computer science is exploring accessibility options using AI with a robotic seeing-eye dog. If someone wanted to visit the museum who was blind or visually impaired, they could interact with a seeing-eye dog that they’re used to, but this seeing-eye dog now might have more capability to communicate with people about what they’re seeing and in a museum setting, for example.
So really excited about that type of research: how do we really benefit humanity with these types of tools.
Inside Higher Ed: One thing I wanted to ask about is resources allocated from the university to be able to access all these tools. What investment is the college making to ensure that students are able to stay on the cutting edge of AI initiatives?
Watts: That’s absolutely critical. We want to make it no cost to our students and accessible to our students, but it still costs. So [it’s vital to] make sure that we have funding.
We were very lucky that we got a Davis endowment that enabled us to build the Davis Institute. That was huge because, and you can think about some of the challenges with federal funding and all of that stuff, but to have an endowment that allowed us to draw on that and really build strong capabilities at Colby College was critical. But you’re touching on the fact that we’re going to need to continue to do that. And that’s where, for example, the NSF grant and other grants that we will continue to explore will help us with how we continue to grow our impact and grow our value as we head into the future.
College affordability conversations tend to focus on tuition. But it’s the total cost of attendance (COA) that can catch many students off guard and derail their progress toward a degree. A new deep dive report from Inside Higher Ed—“Beyond Tuition: The Hidden Costs of College and Their Disproportionate Impact”—reveals how inaccurate COA disclosures and unexpected costs, from mandatory meal plans to technology fees to rising rents, can blindside students and threaten their success.
Join the Discussion
On Wednesday, Dec. 17, at 2 p.m. Eastern, Inside Higher Ed will host a live webcast discussion based on the report. Register for that here. Download “Beyond Tuition: The Hidden Costs of College and Their Disproportionate Impact” here.
Drawing on data from Inside Higher Ed’s Student Voice surveys and other research, plus interviews with dozens of experts, student advocates and students themselves, the report notes that just 27 percent of undergraduates fully understand their institution’s cost of attendance—and that, for some, even an unexpected $100 expense could threaten their enrollment. Hidden costs hit lower-income, first-generation, parenting, international and other student groups especially hard, the report also finds.
Examining efforts to improve COA accuracy and transparency, and zooming in on students and change-makers in California, New York and Texas, the report calls for colleges to provide more accurate COA data, expanded emergency aid and clearer communication to help students plan for the full cost of college, not just the tuition bill.
“The public doesn’t think about living costs, although you have to cover them when you go to school. They also think tuition is skyrocketing when it really hasn’t,” said Robert Kelchen, professor and department head of educational leadership and policy studies at the University of Tennessee at Knoxville. “To some extent we’re focused on the wrong problem.”
This independent editorial report is written by Melissa Ezarik, with support from the Gates Foundation. The findings and conclusions contained in the report are those of the author and do not necessarily reflect positions or policies of the Gates Foundation.
Iowa City, Iowa and Dallas, Texas (November 12, 2025) – ACT, a leader in college and career readiness assessment, and Texas Instruments Education Technology (TI), a division of the global semiconductor company, today announced a comprehensive partnership aimed at empowering students to achieve their best performance on the ACT mathematics test.
This initiative brings together two education leaders to provide innovative resources and tools that maximize student potential. The partnership will start by providing:
A new dedicated online resource center featuring co-branded instructional videos demonstrating optimal use of TI calculators during the ACT mathematics test.
Additional study materials featuring TI calculators to help students build upon and apply their mathematical knowledge while maximizing their time on the ACT test.
“This partnership represents our commitment to providing students with the tools and resources they need to demonstrate their mathematical knowledge effectively,” said Andrew Taylor, Senior Vice President of Educational Solutions and International, ACT, “By working with Texas Instruments, we’re ensuring students have access to familiar, powerful technology tools during this important assessment.”
“Texas Instruments is proud to partner with ACT to support student success,” said Laura Chambers, President at Texas Instruments Education Technology. “Our calculator technology, combined with targeted instructional resources, will help students showcase their true mathematical abilities during the ACT test.”
ACT is transforming college and career readiness pathways so that everyone can discover and fulfill their potential. Grounded in more than 65 years of research, ACT’s learning resources, assessments, research, and work-ready credentials are trusted by students, job seekers, educators, schools, government agencies, and employers in the U.S. and around the world to help people achieve their education and career goals at every stage of life. Visit us at https://www.act.org/.
About Texas Instruments
Texas Instruments Education Technology (TI) — the gold standard for excellence in math — provides exam-approved graphing calculators and interactive STEM technology. TI calculators and accessories drive student understanding and engagement without adding to online distractions. We are committed to empowering teachers, inspiring students and supporting real learning in classrooms everywhere. For more information, visit education.ti.com.
Texas Instruments Incorporated (Nasdaq: TXN) is a global semiconductor company that designs, manufactures and sells analog and embedded processing chips for markets such as industrial, automotive, personal electronics, enterprise systems and communications equipment. At our core, we have a passion to create a better world by making electronics more affordable through semiconductors. This passion is alive today as each generation of innovation builds upon the last to make our technology more reliable, more affordable and lower power, making it possible for semiconductors to go into electronics everywhere. Learn more at TI.com.
eSchool Media staff cover education technology in all its aspects–from legislation and litigation, to best practices, to lessons learned and new products. First published in March of 1998 as a monthly print and digital newspaper, eSchool Media provides the news and information necessary to help K-20 decision-makers successfully use technology and innovation to transform schools and colleges and achieve their educational goals.
Amy Reid spent more than 30 years at New College of Florida, where she served as a professor of French and the founder and director of the gender studies program. Her relatively secure employment as a tenured professor emboldened her to become one of the most outspoken critics of the conservative effort to transform NCF into a “Hillsdale College of the South,” led by then-interim president Richard Corcoran, who was hired by a swath of conservative trustees installed by Gov. Ron DeSantis in 2023.
That same year, Reid was elected to serve as faculty representative on the Board of Trustees; she voted against Corcoran’s appointment to be the college’s permanent president and pushed back against numerous policies, including an effort by the administration to use the faculty to help enforce gendered bathroom laws.
Last month, Corcoran denied a recommendation from the New College provost that Reid be granted emerita status at the college, citing Reid’s advocacy for faculty and academic freedom, which he described as “hyperbolic alarmism and needless obstruction.” In response, the New College Alumni Association Board of Directors made Reid an honorary alum.
Since taking unpaid leave in August 2024 and then retiring a year later, Reid has brought her talents and penchant for advocacy to PEN America, a nonprofit focused on fighting education censorship and protecting press freedom.
Inside Higher Ed spoke with Reid over Zoom about her experience as the faculty representative on the New College Board of Trustees, the transformation of the public liberal arts college and expanding efforts by Florida conservatives to censor faculty speech.
The interview has been edited for length and clarity.
Q: Before you became faculty representative on the Board of Trustees at New College, the previous representative quit in protest. What motivated you to pursue the role and what were you hoping to do with it?
A: Things had been contentious on campus. Frankly, that’s an understatement. When the new board members were appointed that January [2023], they described their arrival on campus as a “siege”—using military language. So I began organizing with other faculty members and providing support to students so that they could respond to the rapid changes on campus, changes that included the immediate firing of our president [Patricia Okker], and then, over the coming weeks, a number of key leaders; the censoring of student speech and chalking on campus; the denial of tenure to a number of very qualified faculty.
I started holding weekly teas for students, providing them a place to ask questions and to be heard and also to have cookies. So working with my colleagues and providing support for students were the two things that I really wanted to do.
As a senior member of the faculty and as the leader of the gender studies program, I felt like I had a particular responsibility to speak up on campus. I knew that colleagues of mine who were not tenured couldn’t necessarily do that, so I tried to speak up for my community. And after Matt Lipinski resigned from the Board of Trustees and from his faculty position [after the board denied tenure to five professors], he actually reached out and asked me to stand for election as chair of the faculty, because I’d been both working in collaboration with others through the union and also because of my outspokenness as director of the gender studies program. So after talking with other colleagues, I agreed to stand for election in collaboration with two other colleagues.
Q: What was the initial reception from the board when you joined?
A: What I really remember, actually, was the real support that I had from colleagues and students and alums. So yes, there was a certain amount of tension with certain members of the Board of Trustees. There were people on the board who did reach out in friendly and professional ways—greeting me at meetings, things like that—but really I had strong support from faculty, alums and students, and that’s what mattered.
Q: Do you think you were successful in the faculty representative role?
A: That’s really a challenging question, and it depends on what metrics you want to use. I think I did a good job of raising serious questions and concerns in the trustee meetings, even if my votes were not often on the winning side. I always brought my integrity with me, and as an educator, that was really important to me. I think I was able to help rally faculty around various policy proposals that we put forth, because my job wasn’t just in the Board of Trustees, it was also in the management of the faculty, which meant multiple meetings every week about budgets and other administrative issues.
There was a lot of work there behind the scenes to support faculty, to support the curriculum and also to advocate for students in a number of ways. I know that students and faculty and alums felt that they could reach out to me about their concerns, that they knew I would listen and respond. When people spoke at Board of Trustees meetings, I paid attention and took notes on all of the people who came to speak. In that way, I think I was effective, but frankly, the votes on the board were stacked.
Q: When you resigned, you said that the “New College where you once taught no longer existed.” Was there a specific moment that tanked your faith in New College leadership?
A: It’s really not about a loss of faith in the new leadership. Richard Corcoran came in with a set of ideas about how he wanted to change the campus, to change what one trustee called the “hormonal and political balance on campus.” And Corcoran followed through on that. I can point first to the firing of valuable and dedicated campus leaders, including President Patricia Okker, the dean of diversity, the campus research librarian. [I can also point to] the denial of tenure to six very qualified and effective faculty, the chasing away of over 30 percent of the faculty and about 100 students—and that’s a real record for the first eight months of this administration.
Then you have the painting over of student art on campus, the replacement of grass with Astroturf and the plowing down of hundreds of trees along the bay front. You have the wasting of millions of dollars of state funds on bloated administrative salaries and portable dorms that were uninhabitable within three months due to mold. You have the abolishing of the gender studies program in the summer of 2023, the erasure of our budget, our eviction from our campus office in December of 2023. The imposition of a rigid and limited core curriculum in spring of 2024. The withholding of diplomas from a cohort of students in May 2024, the wholesale destruction of the student-led gender and diversity center in August 2024. That was a student-led space with a collection of books that had been curated by students for over 30 years, all thrown in the dumpster.
So not one moment, but a lot. But what I still have faith in, even today, is the determination of students and alums to pursue an education that embodies academic freedom, which I understand is the right of students to pursue an education free from government censorship. And also, I have great faith in those faculty who are remaining, who support the New College academic mission and who are doing their best day in and day out to support our students.
Q: Were you surprised when Corcoran denied the dean’s recommendation to grant you emerita status?
A: Not really. I’d say it’s par for the course, but I was surprised that he was so up front about his reasons. In his statement, he noted that despite my record of achievement as a teacher and a researcher, it was my advocacy for the college—my opposition to him—that was the problem. So now he’s on the record explicitly as punishing speech, and that is stunning.
What happened to me is just one small thing, but it reflects a pattern of censorship on the campus that needs to be called out. But more importantly at this moment, I really want to thank my colleagues who nominated me for emeritus status and the New College alums who adopted me as one of their own. That’s meaningful, and I am very grateful.
Q: As a reporter, I spend a lot of time reading and writing bad news, but I’m seeing the same types of attacks on faculty speech and academic freedom that happened at New College occur at other institutions, in Florida and elsewhere. Would you say these current attacks on faculty speech are unprecedented?
A: A lot of people have talked about this as unprecedented, but what I see is the culmination of a pattern of censorship we’ve seen playing out at state levels across the country. In Florida, in 2022, they passed House Bill 233, which allows or encourages students to surreptitiously record faculty if they intend to file a complaint against them.
Since then, really, the state has been tightening a gag around faculty speech in myriad ways. Just in the past couple of months, we’ve seen a number of faculty sanctioned—even one emeritus professor at [University of Florida] lost his status based on complaints about his social media posts. So what’s happening now could be cast as unprecedented, but yet, it’s part of this pattern we see playing out now, not just in Florida, but across the country, where some 50 faculty members have been sanctioned or fired because of their speech or social media posts since the start of September.
Since 2021, PEN America has been actively tracking efforts to censor speech in college and university classrooms across the country, and we’ve seen a real rise in the number of bills introduced to censor speech … and in the numbers that are being passed; 2025 was really a banner year for censorship in higher education in this country. There were a record number of gag orders passed across the country—10 of them, 10 bills that explicitly limit what can be said in college and university classrooms.
And then there are other restrictions designed to chill faculty speech—restrictions on tenure or curricular control bills, and let’s also remember the bills that were introduced or passed to limit student protests on campus. All of those things are designed to make people afraid to speak up and to question things on campus. That’s not healthy for our education system, and it’s not healthy for our democracy. Currently, about 40 percent of the U.S. population lives in a state that has at least one state-level law restricting classroom speech at the college and university level. Is that something we’re OK with as a country? Do we really think that our First Amendment rights are that fungible?
Is it possible for someone you’ve never met to be a mentor?
I don’t know how else to describe Ken Bain, author of What the Best College Teachers Do, a book that transformed not just my teaching, but my entire life.
Ken Bain passed away on Oct. 10. I first learned this news on LinkedIn from Jim Lang, who did know and was directly mentored by Ken Bain and, like the several dozen folks who offered comments on his passing—and also me—whose life and work were profoundly affected by Ken Bain’s work.
I read an advance copy of What The Best College Teachers Do sometime in early 2004 in a period where I was starting to question the folklore of teaching I had absorbed as a student and graduate assistant, and it immediately changed how I thought about my own work, kicking off a process of consideration and experimentation around teaching writing that continues to this day.
What the Best College Teachers Do reflects more than a decade of study and is entirely based in observations of teaching, teaching materials, student responses and reflections, interviews and other sources, filtered through various lenses (history, literary analysis, sociology, ethnography, investigative journalism) to draw both big conclusions about not just what teachers do, but how they think, how they relate to students, how they view their work and how they evolve their approaches.
The method is relentlessly qualitative rather than quantitative, and it can be straightforwardly adapted to one’s own work.
At least that’s how I used the book. Looking through some of the text for the first time in years, I can see significant strands of What the Best College Teachers Do DNA in my writing about the writer’s practice. The lens of “doing” as the central feature of any work has been part of my personal framework for so long that I almost lost its origin, but there it is.
The book is more than 20 years old, but its framing questions are evergreen and even more relevant in this AI age. The book asks and answers the following questions:
What do the best teachers know and understand?
How do they prepare to teach?
What do they expect of their students?
What do they do when they teach?
How do they treat students?
How do they check their progress and evaluate their efforts?
The book helpfully encapsulates the study’s findings under these categories, and as bullet points of good teaching practice they are spot-on. But I am also here to testify that they are not a substitute for the full experience of reading What the Best College Teachers Do, because the act of reading the specific illustrations and examples that gave rise to these findings allows for the individual to reflect on their own practices relative to others.
The first thing I did after reading and absorbing What the Best College Teachers Do was change my attendance policy to no longer punish students based on a maximum number of absences. I’d engaged in this practice because it had been handed down as conventional wisdom: If you don’t police student attendance, they won’t show up. Bain’s best teachers challenged this conventional wisdom.
The positive effects were immediate. I stepped up my game in terms of making sure class was viewed by students as productive and necessary. My mood improved, as I no longer stewed over students who were pushing their luck in terms of absences, daring me to dock their overall semester grade.
Attendance went up! I asked students about this, and they said that when a class says you “get four absences” they were treating that as a kind of permission (or even encouragement) to go ahead and miss four classes. Student agency and self-responsibility increased. If they missed a class, they knew what they had to do, and it didn’t involve me.
The experiments continued, leading ultimately to the writer’s practice and my embrace of alternative assessment, developments that made me a much more effective instructor and now, improbably, someone invited to colleges and universities to share his expertise on these subjects.
It would not have happened without the work and mentorship of Ken Bain, mentorship I experienced entirely through reading his book.
I worry that mentorship is going to be further eroded by AI, particularly if entry-level jobs with their apprenticeship tasks are now completed through automation, rather than by working with other, more experienced humans. The enthusiasm for letting large language models compress texts into summaries rather than reading the full work of another unique intelligence is also a threat.
My conviction that our way forward through the challenge of AI is rooted in deeply examining the experiences of learning and fostering those experiences for students only grows stronger by the day. What the Best College Teachers Do is experiences all the way down, a book of observations conveyed in such a way that allows us to make use of them, literally, in what we do.
A great man. A great mentor. Ken Bain’s work will live on through the many pedagogues he’s inspired.