The Association of Public and Land-grant Universities named Montana State University president Waded Cruzado as its next president, according to a Thursday news release.
Cruzado, who has served as chair of APLU’s Board of Directors since 2021, will formally step into the top job at APLU on July 1. Cruzado has led Montana State University since 2010, and last August that she would retire in June 2025.
She replaces outgoing president Mark Becker, who has led APLU since 2022.
“Throughout my life, the history and the impact of land-grant universities and public higher education have provided me, and countless students and families, with inspiration and a call to action. I’ve seen firsthand the life-changing opportunity our public universities provide to their students, their communities, the country, and the world,” Cruzado said in the news release.
Cruzado, who was a first-generation college student, is a native of Puerto Rico.
Gary May, chancellor of the University of California, Davis, who led the search committee that hired Cruzado, described her as “an exceptional leader who brings deep experience in successfully leading a public and land-grant university to impressive new heights.” May also noted her familiarity with the organization given her time as chair of APLU’s Board of Directors.
(The headline was corrected to reflect that Cruzado is retiring before going to APLU.)
Students who graduated from an Illinois high school, no matter where they’re currently enrolled, will soon be guaranteed transfer admission to any University of Illinois system institution—including the University of Illinois at Urbana-Champaign, which has a regular acceptance rate below 50 percent.
Illinois’s new policy, set to take effect this fall, builds on its previous transfer guarantee, which applied only to current Illinois community college students. Typical state transfer guarantee programs apply only to those currently enrolled in another state institution; Illinois’s more expansive approach may help bring back former residents who left the state for college.
To be eligible, students must have graduated from an Illinois high school, earned at least 36 transferable credit hours toward their transfer institution and maintained a minimum 3.0 GPA in all transferable courses. Students will still have to apply, but if they meet the requirements, they’ll be automatically accepted. Admission to specific programs and majors, however, is not guaranteed.
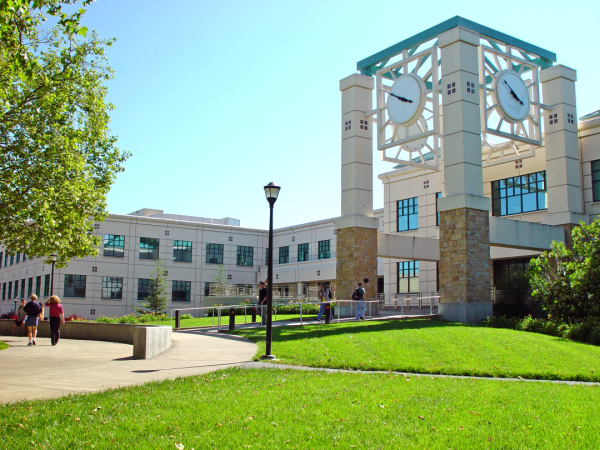
As a first-year college student, Sarah Ellison never imagined working in higher education or earning a doctorate, but her experiences have developed her passion for helping students identify their strengths and build strong foundations for their futures beyond graduation.
Sarah Ellison, Sonoma State University’s associate vice president of student affairs
Sarah Ellison, Sonoma State University
Since Jan. 8, 2024, Ellison has served as associate vice president for student affairs at Sonoma State University, part of the California State University system, overseeing the university’s student access and success team. Ellison spoke with Inside Higher Ed about her work in and outside higher education, her portfolio at Sonoma State, and her goals for the future.
Q: What led you to a career in higher education?
A: I’ll have to say, it wasn’t something I was looking for.
I, right out of high school, went to the University of Hawaii and was planning to do a business degree. I failed my entire freshman year and went to community college. In community college, I thought I would do a focus still in business, so I did do my associate’s, and then continued on to my bachelor’s at the University of La Verne in business.
My whole entire plan was to go into sales. That’s what I thought I would do. I was really fascinated with companies like Coach and Michael Kors, Macy’s.
But throughout that time, life just happens while you’re in college, right? You’re learning about yourself, you’re learning about your goals, defining them, more and more.
During that time, I was very fortunate to meet my husband, and life started to happen during that time as well when I was finishing my undergrad. I actually went to work for a nonprofit organization, Goodwill, in California and got to work at Fort Irwin, which is a military base, serving as a career adviser for transitioning veterans. And I really loved it.
Career services was a new field to me, and I really thought that’s what I wanted to do. And so I ended up doing my master’s in career services, and was trying to think about how I would advance my career from that role into career services in higher education. I really couldn’t find a direct path, but I got into academic advising, and fell in love with academic advising. I met a recruiter at one of our fairs for military folks, and she really introduced me to the whole field of higher education. I had been exposed through going to college and meeting with different mentors. I did my internship in career services at the University of La Verne, and the director there was phenomenal, and that’s what kind of started that piece.
But that’s how I found myself working directly in higher education. I started at a small private university, then went into the Cal State system, then went to University of Kentucky, and then now I found myself back in the Cal State system. It’s been a bit of a wild ride, but it’s been a lot of fun.
Q: Would you say that you’ve brought any of your career services experiences into the work that you do now?
A: I felt that my experience working with transitioning veterans and working in career services really helped my advising platform and role working with students from the advising standpoint, because I was able to better connect with students, with their plans for their degree, and then all of the opportunities that come from different knowing different career fields and aspects, and then helping them leverage all of their experience.
I worked with nontraditional students, first-generation students [and] traditional students, and it’s just amazing how much students can learn from the career aspect that helps with their finishing of their degree, so working towards retention and degree completion.
While I don’t directly find myself in career services in higher education in my current role as associate vice president, I have a pretty large portfolio, and one of those areas being career services now. Now I get to oversee both academic advising [and] career services, as well as many other parts of my portfolio that include advising for equity and access program, disability services, and then also precollegiate programs. It is cool to find myself now directly overseeing those aspects.
Q: Who are your learners at Sonoma State and what are some of the challenges and opportunities at the university based on your student population?
A: Sonoma State has a very diverse student population. We are an HSI, so we do serve a large proportion of Hispanic students. We do have a large proportion of first-generation students, but our makeup is really, really diverse.
I think with anything, like most institutions are facing right now in terms of serving our students, it’s really about showing that pathway, so really working within the community, so that our [high school] students see a path directly into a four-year institution.
[Through] a lot of my precollegiate programs, which serve our K-12 setting, we’re really trying to strengthen and build pathways for those students who typically come from low income, and also our will-be first-generation college students, really helping them to define that pathway and see a clear vision for going into a four-year institution.
I also think it’s the life after, it’s the career trajectory, it’s the employability plans for students that they see the value in their degree. That’s what we’re really working with here, with our students, is really helping them see the value of their degree, retaining them and helping them move them into careers that are both fruitful, exciting and in line with how they saw themselves, with their goals and what they wanted to do.
Q: One of the cool things about working at a public institution is you get to serve your region and the state as a whole. How is that incorporated into your vision for student success?
A: That is one thing I’ve always enjoyed about the Cal State system is that regional perspective and focus that we have.
My first Cal State experience was at Cal State San Bernardino, and then now being here at Sonoma State, it’s amazing how different the Northern California and Southern California regions are—even the issues that we face with those students—but coming together in the system is always really exciting, because we do get to collaborate and think about how we serve the state, but then also, again, focus in on initiatives specific to the regions that all of the Cal State [institutions] are in.
In the work that I do now, I find myself in the community a lot more: serving on different boards, working with different local employers, local community agencies. I will say that Sonoma State has had a pretty good grounding in that prior to my time here.
Before coming to Sonoma State, I worked at the University of Kentucky, which is a land-grant–serving institution, and [that] also gave me a lot of experience to what it is to serve the community in the region and meet the needs of the state as well, too. I spent about three years there learning a lot about extension work.
I strongly believe that it’s amazing to have those ties to the community, because it helps us keep a pulse on what the needs are of the community, helping to prepare our students to go into different career fields, but also have a civic tie as well to what they’re doing.
Q: “Access” is a key word in your list of responsibilities, managing the student access and success team. How is access central to your role?
A: When it comes to access, I think it’s critical for students, because when we think about the different student populations we serve, there’s also these technology pieces. In higher ed—at least at all of the institutions I’ve worked at—we love new technology. We love starting new programs and new platforms.
I think it’s always really critical that we ensure our students understand and have a knowledge base as well, and that the technology works for them. So how they schedule appointments, the flexibility to do Zoom, and then also thinking about some of our students who are native in other languages. Do we have opportunities and space for students to be able to speak with advisers and faculty and have support in their native language? That’s always been really critical, because the meaning is different.
When I was at Cal State San Bernardino, we had some really great faculty from our Spanish department who would come in and help in group advising sessions and do it in Spanish, which is really helpful for our students.
When we think about the technology pieces, that’s critical, how they apply to come to any university. And then when they get to campus, and that consistent communication from the time that they’re interested to … actually enrolling, and then when they’re here, can I get ahold of and work with folks in all of the offices that I need to? That’s critical for us in higher ed to always consider and be mindful of, because that is another part of the student experience.
Q: What are some of your short- and long-term goals at Sonoma State?
A: I’m a year in, so I still consider myself very new in my role.
In terms of some short-term goals … we’re really looking at making sure students have an adviser, someone they can connect with. That we’re breaking down silos within the institution, so that way, advisers, faculty, staff [and] directors feel comfortable working with each other and communicating and supporting each other.
In terms of long term, it’s really strengthening that career side. We have a lot coming down from the governor here in California related to workforce development and those things. I’m partnering with our vice president for student affairs and our provost and associate provost, building out and strengthening our career services programming. So that’s another focus, and some long-term planning that we really need to think about for the future here at Sonoma State, while still continuing to focus on improving equity gaps, retention rates, graduation rates and enrollment as well.
Q: Career services is a growing focus nationally within higher education. What are some of those barriers that you’re facing, or where do you need those resources to really strengthen that arm of the institution?
A: I would say, throughout my time in higher ed for all the institutions I’ve worked at, I think staffing is a huge piece of career services, being able to have enough career staff to meet the needs of the campus.
I also think there’s a training and development piece, and that, to me, ties in to the connection with the faculty and academic departments to make sure that the career advising aligns with the major and department and career pathways.
Leveraging the network as well, I think that’s another thing with career services, is really building strong portfolios for professional networks, and that can be an issue depending on the institution, what their access, their leadership, being embedded in the community and those things, as well as embedded nationally to see new trends, new careers.
That’s another exciting piece about careers, that there are jobs that we don’t even know of that are going to be created here soon. How do we think about skill sets and plans and helping students see their strengths in everything that they’ve accomplished throughout their time, in their academics and at the institution, to prepare for [future] fields? And then we have emerging fields, in AI, green technology, agriculture, health services and all of that.
That’s what’s kind of the fun side of career services, but also creates the challenges, because you’re thinking about current trends, emerging trends and then the trends that you don’t even know are going to exist yet. Helping students define and understand the skill sets that they have, and making sure they’re building and aligning those to those professional fields.
Do you have a career preparation program that impacts student success? Tell us about it.
Attainment has always been an interesting topic for me, every since I first got stunned into disbelief when I looked at the data over time. Even looking at shorter periods can lead to some revelations that many don’t make sense at first.
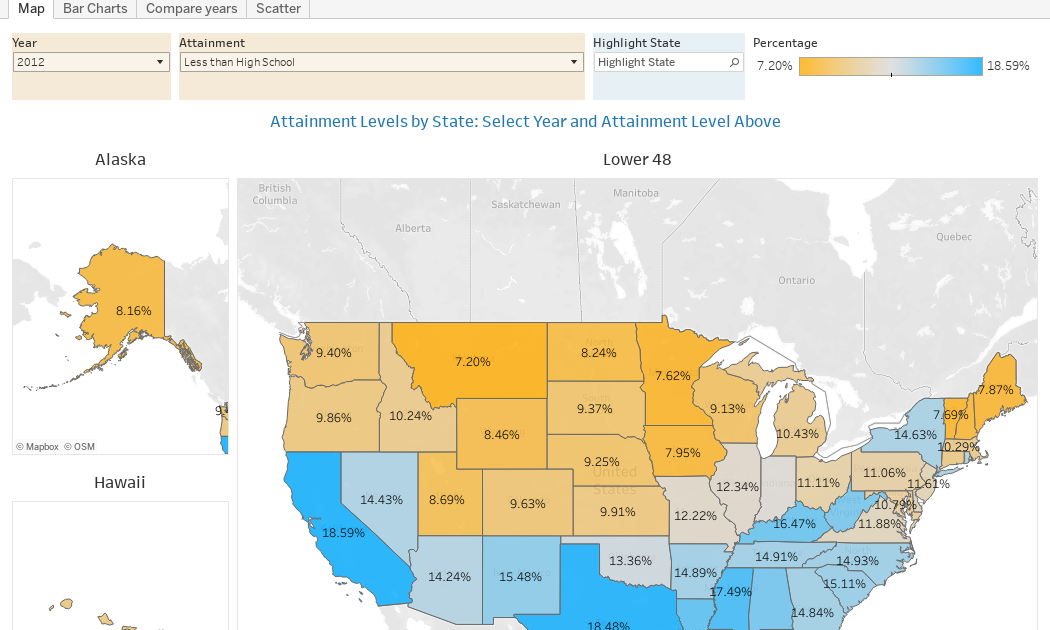
Here is the latest data from NCES, published in the Digest of Education Statistics. Please note that this is for informational purposes only, and I’ve not even attempted to visualize the standard errors in this data, which vary from state-to-state.
There are four views year, all looking at educational attainment by state in 2012 and 2022.
The first shows data on a map: Choose the year, and choose the level of attainment. Note that the top three categories can be confusing: BA means a Bachelor’s degree only; Grad degree means at least a Master’s (or higher, of course); and BA or more presumably combines those two. Again, standard errors might mean the numbers don’t always add up perfectly.
The second shows the data on a bar chart, in three views: 2012 data, 2022 data, and the change, in percentage points. You can choose the attainment level, and then use the control to decide which column to sort the data by.
The third view is a slope chart, where you can see the two years for any state. Choose the attainment level, and then highlight the state you’re interested in. Hover over the points for details.
And finally, the scatter shows the same data, with the same controls; the bubbles are sized by percentage-point change. Additionally, you can use the filter to see which states have changed the most or the least.
If anything surprises you here, drop a comment below, or send me an email.
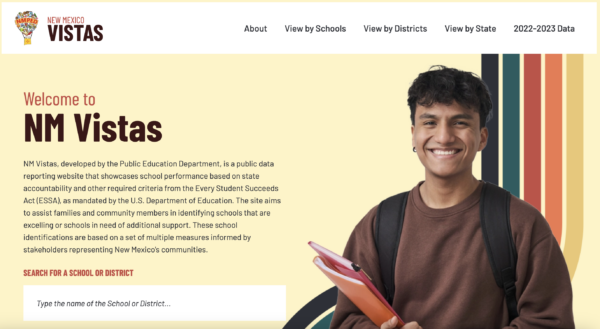
The New Mexico Public Education Department has updated its student achievement data reporting website — NM Vistas — with a renovated layout and school performance data from the 2023-2024 academic year, with expectations for additional information to be released in January 2025.
NM Vistas is crucial to informing New Mexicans about school performance and progress at the school, district and state levels through yearly report cards. The site displays student reading, math and science proficiency rates taken from state assessments, as required by the federal Every Student Succeeds Act. Districts and schools receive scores between 0 and 100 based on performance, and schools also receive designations indicating the level of support the school requires to improve.
Other information on the site includes graduation rates, attendance and student achievement growth. Data also shows rates among specific student demographics, including race, gender, disability, economic indicators and more.
PED Deputy Secretary of Teaching, Learning and Innovation, Amanda DeBell told NM Education in an interview that this year’s recreation of the NM Vistas site came from a desire to go beyond the state’s requirements for school performance data.
“We knew that New Mexico VISTAs had a ton of potential to be a tool that our communities could use,” DeBell said.
One new data point added to NM Vistas this year is early literacy rates, which measures the percentage of students in grades K-2 who are reading proficiently at their grade level. Currently, federal law only requires proficiency rates for grades 3-8 to be published, and New Mexico also publishes 11th grade SAT scores. In the 2023-2024 school year, 34.6% of students grades K-2 were proficient in reading, the data says.
DeBell said several advisory groups encouraged the PED to report early literacy data through NM Vistas.
“We were missing some key data-telling opportunities by not publishing the early literacy [rates] on our website, so we made a real effort to get those early literacy teachers the kudos that they deserve by demonstrating the scores,” DeBell said.
The PED also added data on individual schools through badges indicating specific programs and resources the school offers. For example, Ace Leadership High School in Albuquerque has two badges: one for being a community school offering wraparound services to students and families, and another for qualifying for the career and technical education-focused Innovation Zone program.
“What we are really trying to do is provide a sort of one-stop shopping for families and community members to highlight all of the work that schools are doing,” DeBell said.
The updated NM Vistas website has removed a few things as well, most notably the entire 2021-2022 NM Vistas data set. DeBell said this was because the PED changed the way it measured student growth data, which resulted in the 2021-2022 school year’s data being incomparable to the most recent two years.
“You could not say that the schools in 2021-2022 were doing the same as 2022-2023 or 2023-2024, because the mechanism for calculating their scores was different,” DeBell said.
However, this does leave NM Vistas with less data overall, only allowing viewers to compare scores from the latest data set to last year’s.
In January 2025, several new indicators are expected to be uploaded to the site, including:
Student performance levels: Reports the percentage of students who are novices, nearing proficiency, proficient and advanced in reading, math and science at each school, rather than only separating between proficient and not proficient.
Results for The Nation’s Report Card (also known as NAEP): Compares student proficiencies between US states.
Educator qualifications: DeBell said this would include information on individual schools’ numbers of newer teachers, substitute teachers covering vacancies and more.
College enrollment rates: only to be statewide numbers indicating the percentage of New Mexico students attending college after graduating, but DeBell said she later hopes the PED can narrow down by each K-12 school.
Per-pupil spending: How much money each school, district and the state spends per-student on average.
School climate: Links the viewer to results of school climate surveys asking students, parents and teachers how they feel about their school experience.
Alternate assessment participation: Percentage of students who take a different assessment in place of the NM-MSSA or SAT.
“We want VISTAs to be super, super responsive, and we want families to be able to use this and get good information,” DeBell said. “We will continue to evolve this until it’s at its 100th iteration, if it takes that much.”
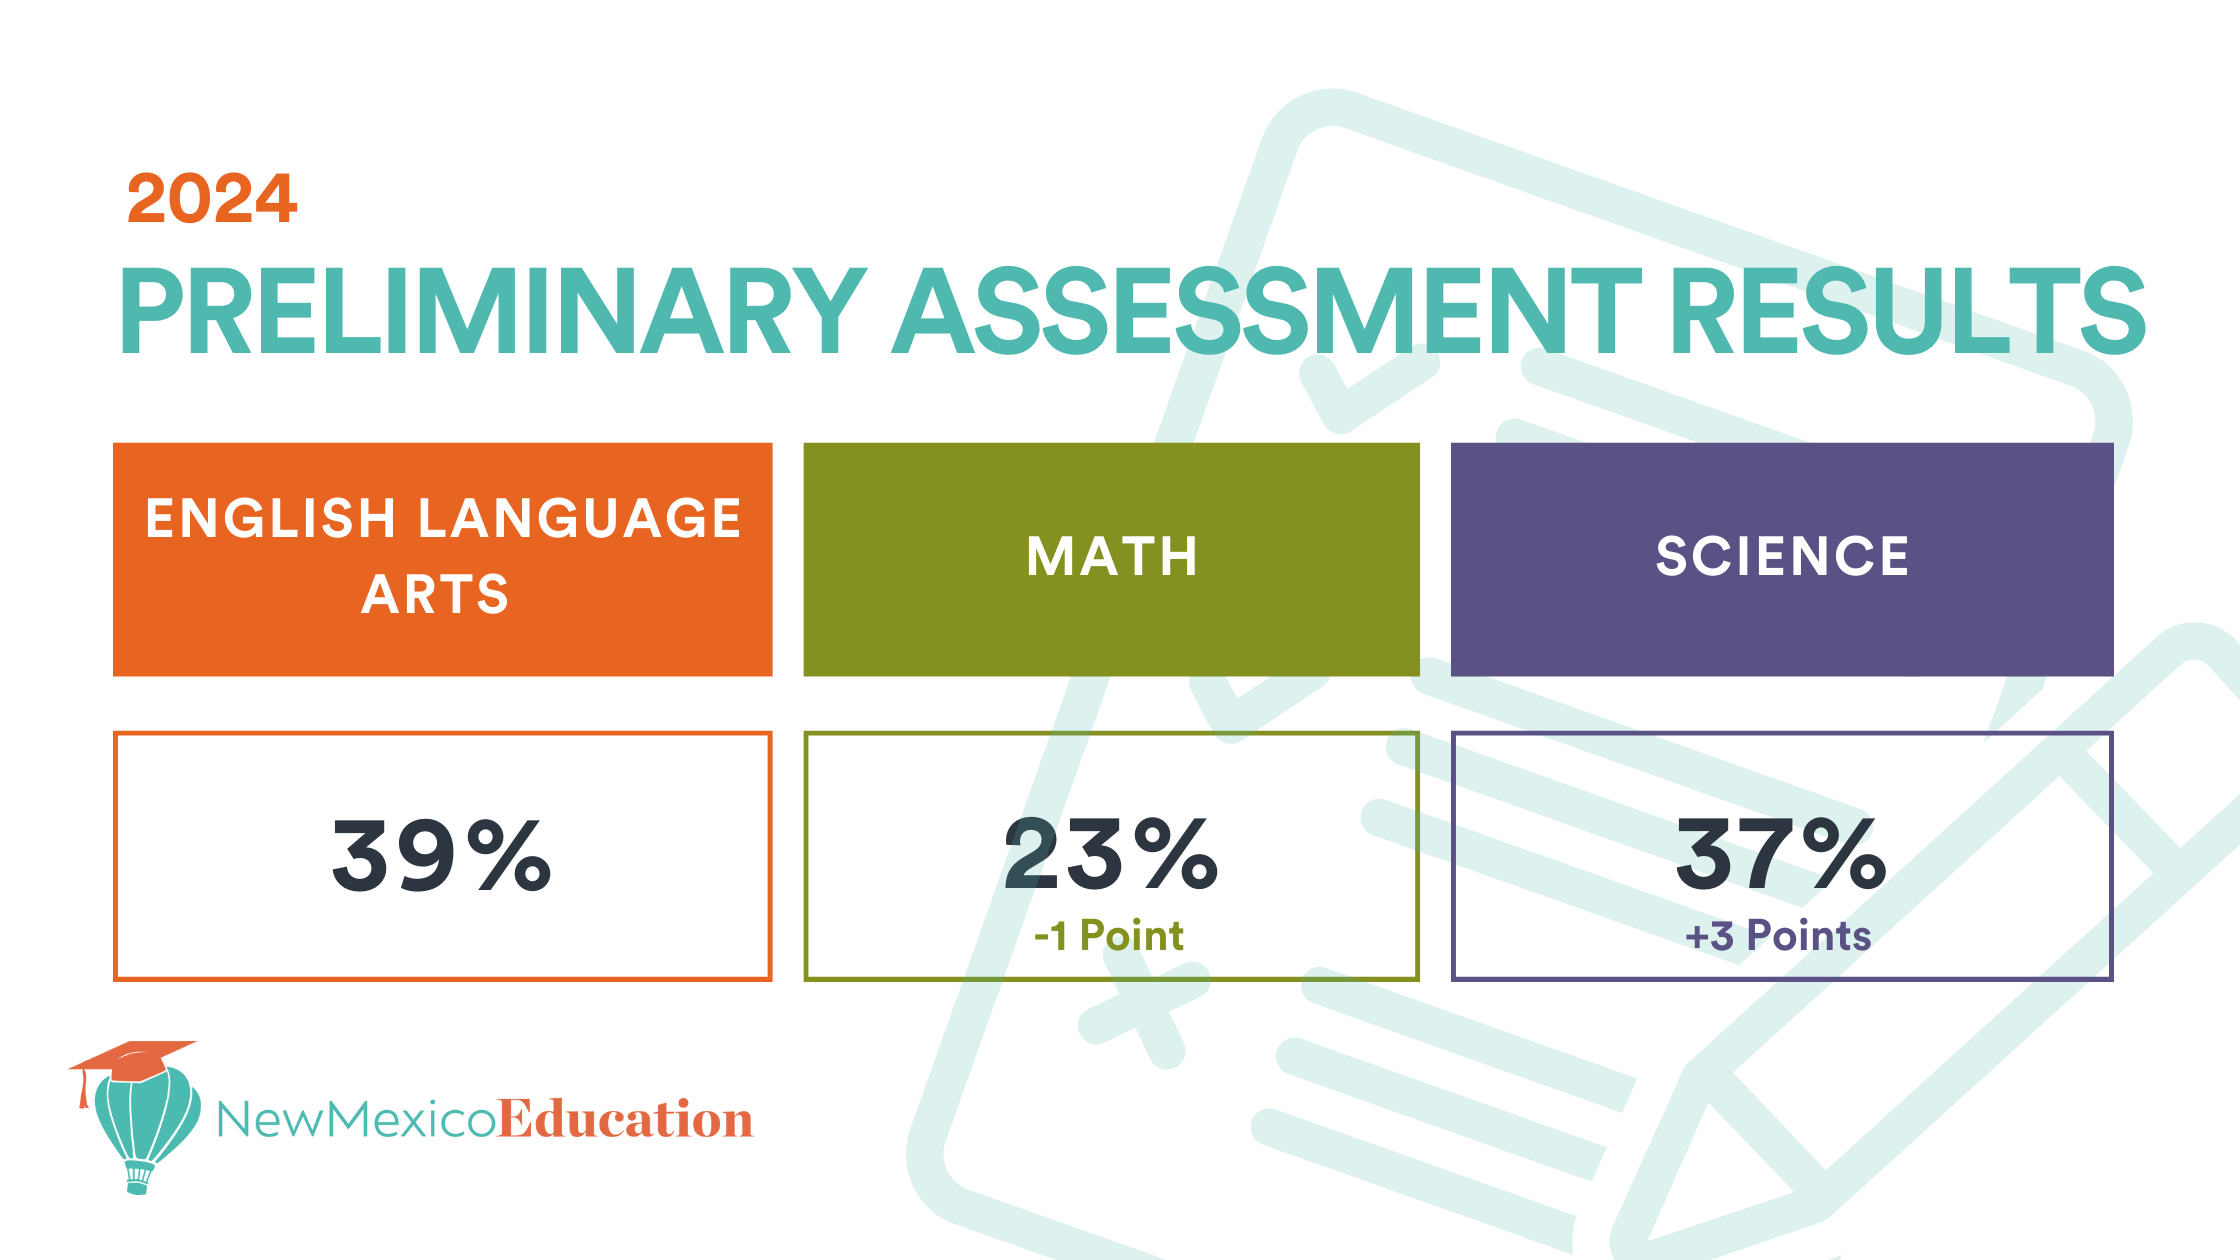
This year, the PED released statewide assessment results for the 2023-2024 school year to NM Vistas on Nov. 15. Results show 39% of New Mexico students are proficient in reading, 23% are proficient in math and 38% are proficient in science. Compared to last year’s scores, reading proficiency increased by 1%, math proficiency decreased by 1% and science proficiency increased by 4%.
Let’s set the stage. You’re a sharp, focused higher education leader staring down the realities of expanding your online and hybrid learning programs. You’ve got big goals: running your online operations in-house, owning the process, and driving growth on your terms.
This is where Online Growth Enablement comes in. This isn’t a fancy buzzword. It’s the real work behind sustainable change. It’s the boots-on-the-ground understanding of exactly where you are today so you can figure out how to move forward tomorrow.
At Archer, we do this every day — rolling up our sleeves and digging deep to map out the real picture of an institution’s online learning infrastructure. Because, let’s be honest. The only way to grow is to start with the truth about your current state and your place within the landscape of the communities you serve with your programs.
Why Your Current State Matters
Success doesn’t happen in a vacuum — especially not in online learning. Enabling the growth of your online learning infrastructure takes coordination, collaboration, and a whole lot of buy-in from every corner of your university. Marketing, tech, enrollment, financial aid, the registrar, faculty, leadership — if they’re not on the same page as you, you can’t successfully move forward. Period.
Driving real growth starts with taking an unflinching look at where you stand today. Questions you should be asking about your online operations include:
Where are you strong?
Where are you struggling?
Where are the untapped opportunities you can scale?
This isn’t about a vague, feel-good assessment from 50,000 feet up. It’s about getting into the weeds. Because, until you understand the inner workings of your current infrastructure, you’re not going to build anything sustainable. You’ll just be putting a fresh coat of paint on a crumbling foundation. And that’s not going to cut it in the long run.
The Power of Deep Insights
Let’s take a look at a real-world example of why a close examination of your current online learning infrastructure matters. One of our partner universities was taking 14 days to review and process the transcripts of students applying to their online programs. This might work fine for a traditional on-campus program with two or three big start dates a year, but for an online program, the game changes. To stay competitive, you need five or six start dates annually. And that 14-day turnaround? For our partner, it meant missing out on dozens of potential enrollments.
Fixing this issue wasn’t about throwing money at the problem. It was about setting a clear benchmark and making it happen. We worked with the institution to rethink its processes, reassign its teams’ responsibilities, and streamline every single step of its transcript review.
The effectiveness of every touchpoint you have with a potential student and every handoff between your admissions, financial aid, and academic advising teams affects your ability to deliver an overall positive student experience. Deep operational insights aren’t just nice to have; they’re the key to uncovering bottlenecks so you can clear the way for real, measurable growth.
How We Help: The Growth Enablement Assessment
At Archer, we don’t do guesswork. We help our partners make sense of the current state of their online learning infrastructure through our Growth Enablement Assessment — a no-stone-left-unturned look at every department and operational variable. From enrollment workflows to marketing execution, we get into the details that others overlook to help you figure out where you are and make a plan for where you want to be.
Our approach is anchored in our Good, Better, Best methodology:
Good: Your processes are functional. They get the job done, but let’s be honest — they need improvement to keep pace in a competitive online marketplace.
Better: There’s progress. Your processes are showing alignment, but they’re not quite optimized yet.
Best: This is where you want to be. Your processes are efficient, scalable, and fully aligned with your strategic goals.
This isn’t just an audit. It’s a road map. By pinpointing exactly where you stand and where you need to go, we equip you with the insights and strategies to move your online learning operations from functional to thriving.
Why It’s All Worth It
Yes, this takes time. Yes, it’s hard work. But the payoff is undeniable.
Fully understanding the current state of your online learning infrastructure isn’t just a box to check — it’s the foundation for every initiative that follows. It gives you the clarity to enhance not only your online learning programs but also the overall health and effectiveness of your institution.
When you commit to this process, you’re building something bigger than just operational efficiency. You’re creating alignment across departments, fostering innovation, and embedding collaboration and continuous improvement into your institution’s culture. When every team is in sync, bottlenecks disappear, every touchpoint matters, and your processes deliver on the promise of a strong student experience.
It’s not just worth it. It’s transformative. If you’re ready to take the first step toward long-term success and scalability, contact Archer Education. Let’s build the online learning infrastructure your institution deserves, together.
John Goodwin is Archer Education’s EVP of Online Growth Enablement. Archer revolutionizes the student experience by supporting partners through change, helping institutions achieve sustainable growth while fostering self-sufficiency.
Title: A 2024 Update of State Investments in Short-Term Credential Pathways
Author: Stephanie M. Murphy
Source: HCM Strategists
The higher education landscape continues to evolve rapidly as more and more students prioritize short-term credentials, also known as micro-credentials and non-degree credentials. There is increased demand for these valuable credentials, which can improve individuals’ career prospects and meet the changing needs of the modern economy and job market.
Despite a massive proliferation in funding for short-term credentials, there has been a lack of systematic cataloging or analysis of state investments in short-term credentials. HCM Strategists, through funding from the Lumina Foundation, conducted an in-depth examination of all 50 states to establish the first comprehensive classification system of state funding for short-term credential programs. The October 2024 report is an update of HCM Strategists’ 2023 typology and policy landscape analysis of short-term credentials.
Key findings are summarized below:
Total state investments in short-term credentials exceed $5.6 billion across 69 initiatives in 31 states.
This represents an increase from 2023, when there were 59 state-led programs with nearly $4 billion in funding.
Across programs, a majority of state funding for short-term credentials has gone toward students, for financial aid, and institutions, for capacity building and student supports and aid).
Since 2023, 10 new short-term credential initiatives have launched in eight states, increasing total investments by roughly $1.8 billion.
As an example, Alabama established its Short-Term Credential Scholarship Program during the 2025 fiscal year with a $1 million appropriation. This initiative reimburses Alabama residents for up to $4,500 in for expenses such as tuition, fees, and materials as they seek short-term credentials aligned with workforce demands.
In Colorado, HB24-1340, signed into law in May 2024, created a tax credit for low- and middle-income residents enrolled at public colleges and universities. This initiative provides full reimbursement of tuition and fees for eligible recent high school graduates, improving access to short-term credentials.
West Virginia’s Credential WV micro-credential initiative was created in October 2024 to help workers and students gain targeted credentials to meet new labor market demands in the state. This program will roll out over three years, with institutions identifying resources to create workforce-aligned micro-credentials and standardizing the process for awarding credit for prior learning.
Short-term and non-degree credentials are becoming an increasingly central piece of the education landscape in the United States. And while 31 states have invested more than $5.6 billion across 69 initiatives to make workforce training more accessible, research remains limited on the outcomes and long-term labor market value of these credentials. The large financial investments that states and institutions of higher education are making into short-term credential pathways reflect the growing recognition of the value of immediate upskilling in today’s labor market.
To read the full report from HCM Strategists, click here.
—Austin Freeman
If you have any questions or comments about this blog post, please contact us.
New Mexico students made tiny gains in literacy and dipped slightly in math proficiency last school year, according to preliminary results released Sept. 19 by the Public Education Department.
Regardless, the results show that a large majority of the state’s public education students continue to fall short of grade-level proficiency. This suggests that New Mexico will remain close to the bottom nationally in student achievement.
The PED results do not include detailed demographic or grade-level breakdowns. Those results will be released on Oct. 4.
According to the PED, 39 percent of K-8 and 11th-grade students scored proficient or better on state literacy assessments, compared to 38 percent in 2023, and up from 34 percent in 2022. The LESC results showed that the literacy proficiency rate was flat at 38 percent.
In math, PED data show 23 percent of students in grades 3-8 and 11 proficient. That’s down one percentage point from 2023 and two points down from 2022. LESC numbers showed 22 percent proficient in 2024.
In grades 5, 8 and 11 science, scores were up three percentage points, from 34 percent proficient last year to 37 percent proficient in 2024.