Florida governor Ron DeSantis is launching a state initiative to cut spending and optimize efficiency modeled after the Elon Musk’s federal Department of Government Efficiency, which has cut billions in contracts at federal agencies, The Orlando Sentinel reported.
Over the course of a year, Florida’s version of DOGE intends to sunset dozens of state boards and commissions, cut hundreds of jobs, and probe university finances and managerial practices.
“This is the DOGE-ing of our state university system, and I think it’s going to be good for taxpayers, and it’s ultimately going to be good for students as well,” DeSantis said Monday.
He added that the state would leverage artificial intelligence to help with the initiative.
The Republican governor also indicated that the state-level initiative would target what he referred to as “ideological study stuff” in an effort to “make sure that these universities are really serving the classical mission of what a university should be, and that’s not to impose ideology. It’s really to teach students how to think and to prepare them to be citizens of our republic.”
The move comes as the state has already targeted curriculum in recent months, stripping hundreds of courses from the general education offerings of state universities earlier this year. Many of the classes touched on topics such as race, gender, sexuality, and non-Christian religions.
Florida has also hired multiple GOP officials—some sitting, others who previously served—to lead state universities, including several who have no higher education management experience.
In a response to DeSantis, who pressed for the need to eliminate inefficiencies, the Florida Democratic Party noted that Republicans have controlled state politics for nearly 30 years and questioned the outgoing governor’s motivations in launching the state equivalent of DOGE.
Higher Education Inquirer : “Will Universities Surrender or Resist?” Scholar Slams Trump’s Threat to Defund Universities (Democracy Now!)
“Will Universities Surrender or Resist?” Scholar Slams Trump’s Threat to Defund Universities (Democracy Now!)
The Trump administration has issued a two-week ultimatum for schools and universities across the United States to end all programs related to diversity, equity and inclusion — DEI — or risk losing federal funding. The Department of Education has already canceled some $600 million in grants for teacher training on race, social justice and other topics as part of its crusade against “woke” policies. This comes as President Donald Trump has said he wants to abolish the agency and tapped major Trump donor and former professional wrestling executive Linda McMahon to carry out that goal; she is expected to be confirmed by the Senate with little or no Republican opposition. Education scholar Julian Vasquez Heilig, who teaches at Western Michigan University, says Trump’s moves are part of “an attempt to privatize education” in the United States, with DEI used as a wedge to accomplish a larger restructuring of social structures. “Higher education hasn’t faced a crisis like this since potentially McCarthyism.”
For many students and faculty, it’s an exhausting time to be on campus. The long–polarizedclimate has been supercharged by everything from the flurry of executive orders to lingering tensions over the Israeli-Palestinian conflict to proposed cuts to government spending on higher ed. All while administrators come under intense pressure from groups on all sides to issue public statements, invest or divest, and cancel speakers — as federal and state government actors stoke the flames.
Some have argued universities have a duty to cast aside neutrality and, for example, declare certain politicians fascists. But this kind of political grandstanding undermines the central purpose of the university: the pursuit of truth, a process that requires debate and discussion. This process can’t happen when a university’s leaders put a proverbial thumb on the scale. Instead, it’s in the most fraught times that university leaders most need to draw a line in the sand against censorship and intimidation.
While the current climate feels unprecedented, history tells a different story. In the late 1960s, America was on fire — literally and figuratively. Protests erupted, generational divides widened, and a divisive president presided over a deeply unpopular war in Vietnam that claimed tens of thousands of lives. Amidst the chaos, the president of the University of Chicago convened a faculty committee to determine how the institution should respond to burning political and social upheaval.
Their answer was simple yet compelling: the university, as an institution, must remain neutral.
Enshrined in the committee’s Report on the University’s Role in Political and Social Action (commonly called the Kalven Report, after its lead author, First Amendment scholar Harry Kalven, Jr.), the report warned that universities “cannot take collective action on the issues of the day without endangering the conditions for its existence and effectiveness. There is no mechanism by which it can reach a collective position without inhibiting that full freedom of dissent on which it thrives.”
In other words, the mere act of taking an official position on an issue stifles dissent — and, again, undermines the primary reason for the university’s existence.
Critics have argued that neutrality is impossible because everything is political, from school calendars to core curricula. By that logic, even declining to make political statements is a political act. But this merely serves as a rhetorical trap designed to justify disposing of neutrality altogether.
America already has plenty of division and distrust. Institutional neutrality is a critical tool for fostering academia’s only peaceful path through the storm: honest debate.
The Kalven Report’s authors made clear that the university must take a position when its mission is at stake. For example, they must defend academic freedom when governments attempt to silence professors. But that’s entirely different from taking a stand on which side was “right” in Vietnam, or is “right” in the Israeli-Palestinian conflict. There may be close cases in which people will disagree on where that line should be drawn. But denying that intelligent distinctions can be made is like arguing that one cannot differentiate red from blue because they are both on a visual spectrum that lacks clear demarcations.
Neutrality does not mean that universities will play no part in grappling with social and political questions. The Kalven Report affirms that “[t]he university is the home and sponsor of critics; it is not itself the critic,” and notes that universities play a vital role “in fostering the development of social and political values in a society.” This is a long-term role “defined by the distinctive mission of the university and defined too by the distinctive characteristics of the university as a community.” But rather than acting as an advocacy organization, the university is a community of learned advocates with the freedom to agree or disagree with one another. Administrators must intentionally avoid becoming the former so they can function as the latter.
The Kalven Report recognized taking sides in the day’s debates would kneecap the university’s ability to serve as a forum for the pursuit of truth among individual scholars. “There is no mechanism by which it can reach a collective position,” the committee explained, “without inhibiting that full freedom of dissent on which it thrives.”
Most faculty understand this. Two-thirds of faculty members agree that colleges and universities should remain neutral on political and social issues, according to FIRE’s 2024 Faculty Survey Report. The issue of neutrality is especially salient for adjunct instructors, who lack the tenure protections of their full-time peers. As FIRE notes in its Scholars Under Fire report of attempts to sanction professors for speaking their minds, adjuncts — who account for 70 percent of all faculty — are particularly prone to speech-related terminations. An astounding 54 percent of attempts to sanction adjuncts result in termination, compared to 21 percent for all scholars. The most vulnerable faculty have the most to lose when universities take sides.
FIRE has taken a proactive stance on institutional neutrality, discouraging universities from taking up ill-advised “collective positions” on divisive issues. The University of North Carolina System, Vanderbilt, Harvard, Yale, and Dartmouth — and, of course, the University of Chicago — have all adopted official positions on institutional neutrality, and we’re leading the fight to get more colleges on board.
Institutional neutrality is key, but it is not the be-all and end-all. It’s an important slice of a well-diversified portfolio of pro-free speech policies — but just one slice. Universities must also refrain from punishing students and faculty for dissenting views amid sky-high tensions and changing political winds. Sometimes this is an uphill battle against political and social pressure. It’s vital nevertheless.
America already has plenty of division and distrust. Institutional neutrality is a critical tool for fostering academia’s only peaceful path through the storm: honest debate. All sides must have a fair chance to speak and be heard. If universities cannot deliver an environment that cultivates such discussion, they risk becoming just another partisan casualty in the culture war.
The peak body representing universities, Universities Australia (UA), has said the federal government should offer more money and less bureaucracy to the higher education sector ahead of the election due by April.
Please login below to view content or subscribe now.
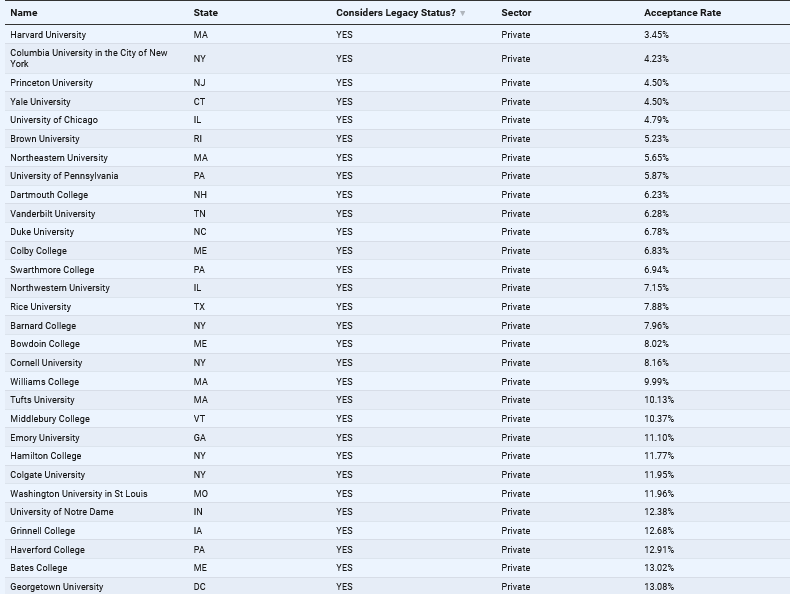
Here is a short list of US universities with legacy admissions. These elite and highly selective schools give preferential treatment to applicants who are related to alumni, which rewards parents, grandparents, and relatives of students rather than rewarding deserving students for their skills and efforts.
While it may not be just or fair, the process is not illegal in the
United States, nor is there much public outcry about this elitist tradition.
Without insider information, it’s also difficult to know how individual schools use legacy admissions and
how the murky process operates.
February 10–16 is the Trades Union Congress ‘“HeartUnions” week, a week dedicated to celebrating the good work that trade unions do.
I love trade unions and higher education. Given that unions primarily receive media coverage when their members take industrial action, it’s easy to forget that, at their heart, they are solidarity movements, whose campaigns have driven social change.
Trade unions fought for and won a minimum wage, maternity and paternity rights, pension provision, and holiday and sickness entitlements. These victories have benefited every British person. Equally, those external to the sector may overlook the social impact higher education has due to the question of whether university still represents value for money for students.
The current picture
Higher education staff knowledge of how trade unions democratically work and the positive impact that a collective movement can have varies. Anti-union legislation over the past 50 years, such as the Trade Union and Labour Relations (Consolidation) Act (1992) and the Trade Union Act (2016), has led to fewer people being members of trade unions or understanding their purpose, compared to previous generations.
My personal experience as a trade union representative has shown me that it has become increasingly important to explain what a trade union is to new staff entering careers in higher education, as there is a likelihood that they, or their parents, may not have been members of a union. Indeed, in 2021, only 14.1 per cent of trade union members in the UK were aged between 20 and 29 years. Furthermore, in a more interconnected and mobile world, assumptions about trade unions can be very different from stereotypes and experiences in other countries. Overall, there are a range of misconceptions about unions’ purpose and value.
Despite legislative challenges, trade unions in UK higher education have reasons to be optimistic. Some UCU branches have seen membership numbers grow and an increased level of member activism. A core reason for this appears to be that staff are increasingly viewing unions as part of the solution to overcoming problems faced in the sector. This seems to be driven by the successes branches are having locally, and by the number of universities currently undertaking or preparing to implement cuts.
Trade union branches and university management will never see eye to eye on every issue. Trade unions are there to protect their members, whereas university management is there to protect the organisation. As many reading this will know, differing objectives undoubtedly lead to disputes and industrial unrest. Withholding labour can sometimes be the best and/or only strategy unions have to win disputes. It should never be forgotten that many of the successes trade unions have had which we now often take for granted, such as the two day weekend, came through intense campaigning and struggle, including strike action.
I love trade unions and higher education, and see both for their flaws, including missed opportunities to collaborate. University management and trade unions often have shared purposes. Unfortunately, these are not always understood, limiting the impact trade union branches have.
New legislation
The Employment Rights Bill, which is currently going through Parliament, promises greater protection for workers, including repealing much of the Trade Union Act (2016). As written, it would significantly empower workers to act collectively, though it’s worth noting that parts of the bill are currently out to consultation and the legislation is not expected to receive Royal Assent until next year.
In essence, the bill encourages employers to work more closely with trade unions. It strengthens the rights of trade unions to access workplaces, simplifies trade union recognition processes, introduces new protections for trade union representatives (including equality representatives), and introduces a duty for employers to inform employees that they have a right to join a trade union.
Drilling down into the details of the bill as it stands, it can be seen how it will be easier for trade unions to successfully gain industrial action mandates. This makes it more vital than ever for university stakeholders, such as UCEA, as well as individual university management teams, to collaborate with trade union colleagues, enhancing how a diverse range of staff voices influence university decisions. This is important as staff working in various capacities across higher education may be well-placed to propose innovative ways of overcoming significant challenges faced by the sector.
Working in partnership
Trade unions and university leaders ultimately want the sector to be successful, with excellent teaching, research, and student support, as well as financial stability.
Personal experiences from working at various institutions have shown that trade unions are typically consultative mechanisms. While consultation must occur, in line with recognition agreements, in many cases it may have been more effective for trade union representatives to have worked in partnership with the university prior to reaching a consultative or approval stage. For example, policies relating to health and safety or sustainability.
A starting point to building any partnership is understanding how objectives align. Awareness of how trade union representative positions correlate with university structures and committees is a good way of identifying when objectives are shared. Trade union branches often have a range of different representatives who can actively contribute to committees and task-and-finish groups. Trade union health and safety representatives are very capable of assisting in evaluating workload, inspecting environments, drafting new policies, and many other tasks in partnership with the university.
Although partnership working between trade union branches and universities can be improved, there are good examples of it occurring in the sector. Universities such as Glasgow Caledonian have a “learning agreement” with their recognised trade unions. This agreement specifies how the trade unions will work in partnership on staff development activities.
Stories from Northampton
At the time of composing this article, the University of Northampton (UON) is completing a consultation process that has placed many staff at risk of redundancy.
Although the consultation process has been challenging for the UON UCU branch and the UON leadership team – as can be expected in these situations – UON UCU has continued to improve partnership working across the university, while simultaneously fighting hard to protect the jobs of all members at risk of redundancy.
The branch has been involved in interview selection processes, work relating to building an improved sense of staff belonging, and a new Race Equality Charter. The branch’s approach of being able to traverse between challenging management on some issues, while simultaneously working in partnership with them on others, has advanced the interests of our members and saved jobs.
It is also evident that UON UCU will come out of the consultation with enhanced credibility from UON management. Management has expressed willingness to work with recognised trade unions on issues such as workload stress risk assessments and its new learning development policy. It is also highly pleasing to note that membership and activism in the branch have increased. As part of HeartUnions week, activists are completing a live brief with fine art students. The students will be learning about trade unions while using skills developed in their programme to create a large UCU banner.
HeartUnions
If you like me love trade unions and higher education, and want them to be their best version going forward, now seems the perfect time to consider how we make their relationship work at every university.
Yes, like most relationships, there will be times when disagreement occurs. However, equally, there will be opportunities to work together, which will benefit the sector.
If this article or other activities that occurred as part of HeartUnions week have inspired you to join a trade union, a good starting point is to visit the TUC website. It’s worth checking out staff intranet pages too to learn what trade union agreements are in place at your university.
TUCSON, Ariz. — Olivia Howe was hesitant at first to add French to her major in finance at the University of Arizona, fearing that it wouldn’t be very useful in the labor market.
Then her language skills helped her land a job at the multinational technology company Siemens, which will be waiting for her when she graduates this spring.
“The reason I got the job is because of my French. I didn’t see it as a practical choice, but now I do,” said Howe, who, to communicate with colleagues and clients, also plans to take up German. “The humanities taught me I could do it.”
The simple message that majoring in the humanities pays off is being pushed aggressively by this university and a handful of others; they hope to reverse decades of plummeting enrollment in subjects that teach skills employers say they need from graduates but aren’t getting.
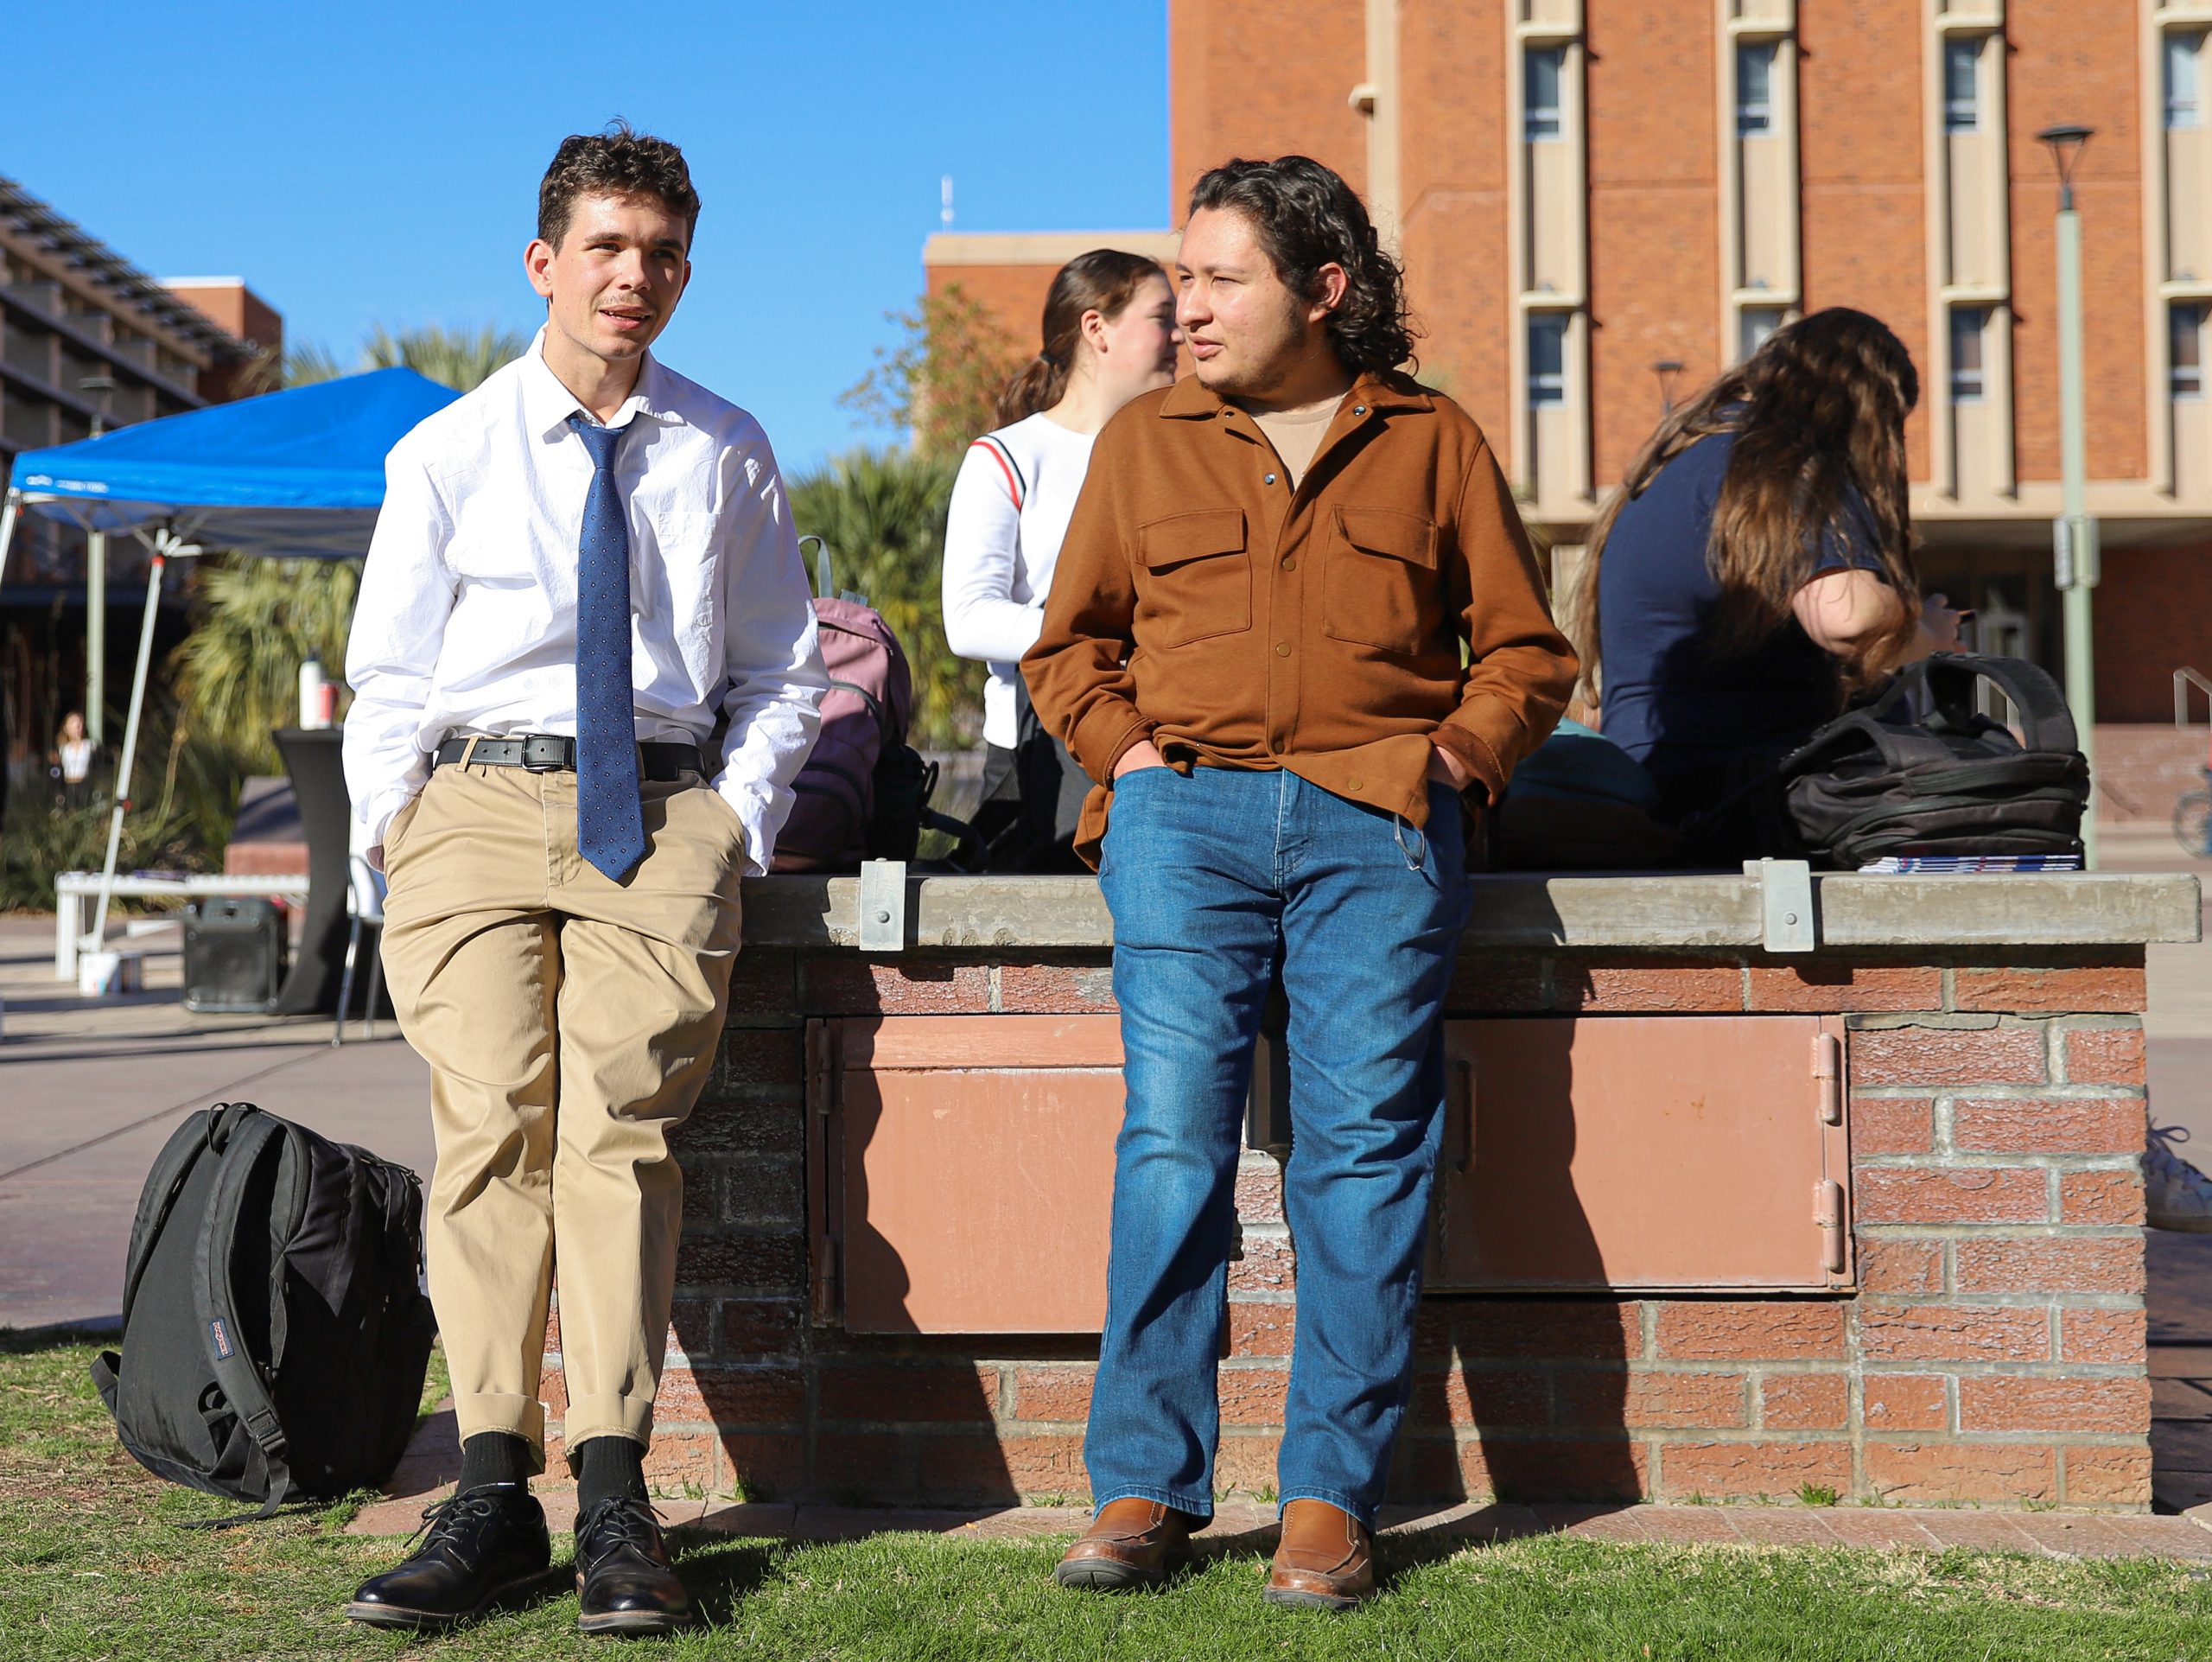
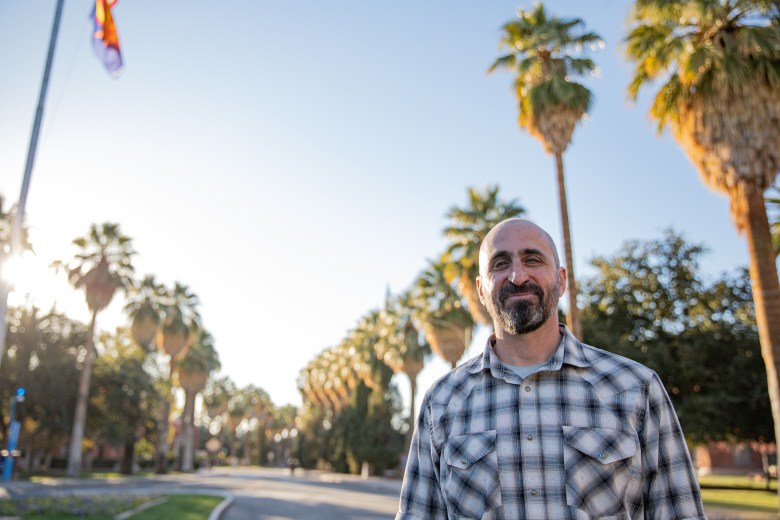
The University of Arizona campus. The university is among a handful of higher education institutions taking steps to revive humanities enrollments. Credit: Mason Kumet for The Hechinger Report
The number of undergraduates majoring in the humanities at the University of Arizona has increased 76 percent since 2018, when it introduced a bachelor’s degree in applied humanities that connects the humanities with programs in business, engineering, medicine and other fields. It also hired a humanities recruitment director and marketing team and started training faculty members to enlist students in the major with the promise that an education in the humanities leads to jobs.
That’s an uncharacteristic role for humanities professors, who have tended to resist suggestions that it’s their role to ready students for the workforce.
But it’s become an existential one.
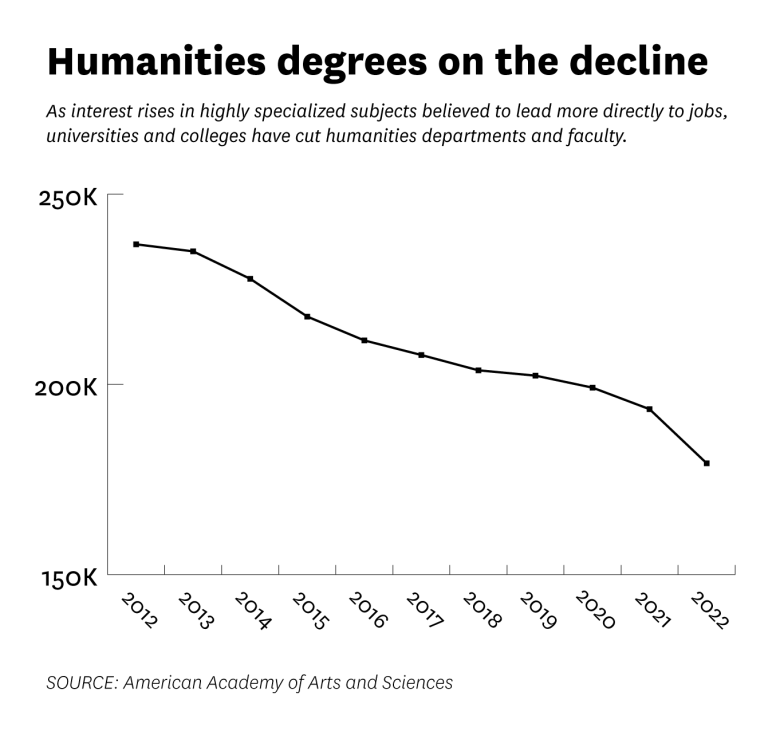
Nationwide, between 2012 and 2022 the number of undergraduate degrees awarded in the humanities — English, history, languages, literature, philosophy and related subjects — fell 24 percent, according to the American Academy of Arts and Sciences. It’s now below 200,000 for the first time in more than two decades.
Related: Interested in more news about colleges and universities? Subscribe to our free biweekly higher education newsletter.
In response, universities and colleges nationwide have started eliminating humanities departments and laying off humanities faculty as policymakers, parents and administrators put a premium on highly specialized subjects they believe lead more directly to jobs.
Efforts to revitalize humanities enrollment are widely scattered, however, with surprisingly few examples like Arizona’s, and no guarantee of widespread success.
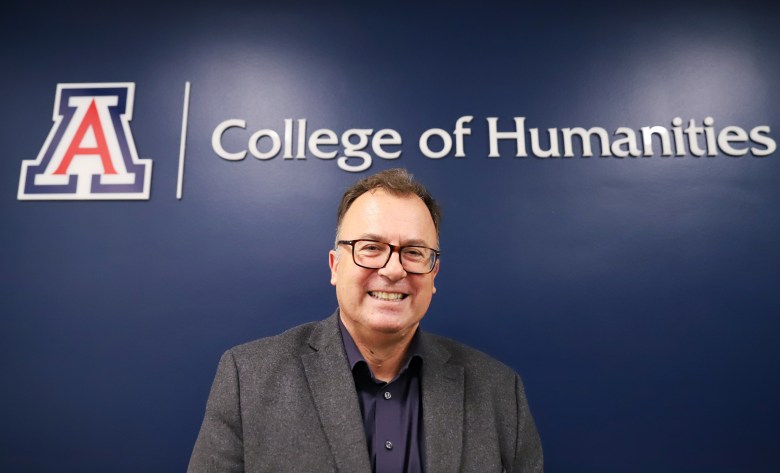
“What we are up against is the constant negative storytelling about how the humanities are useless,” said Alain-Philippe Durand, dean of the University of Arizona’s College of Humanities and a professor of French.
Higher education has largely struggled to counteract this. Presidents and deans use vague arguments that the humanities impart knowledge and create citizens of the world, when what tuition-paying consumers want to know is what they’ll get for their money and how they’ll repay their student loan debt.
Alain-Philippe Durand is dean of humanities at the University of Arizona, where the number of undergraduates majoring in the humanities is up 76 percent since 2018. “What we are up against is the constant negative storytelling about how the humanities are useless,” he says. Credit: Mason Kumet for The Hechinger Report
“When you tell them we are teaching the life of the mind, they laugh at you,” Durand said over lunch at the student center.
“You have people saying, ‘Do we really need this?’ ” he said. “It should be the opposite: ‘Hey, did you know that in the College of Humanities we teach some of the most in-demand skills in the job market?’ ”
Durand’s department went so far as to put that declaration on a billboard on Interstate 10 in Phoenix, conveniently near the campus of rival Arizona State University. “Humanities=Jobs,” it said, with the college’s web address. Durand keeps a model of it on a shelf in his office.
The skills he’s talking about include how to communicate effectively, think critically, work in teams and be able to figure out a way to solve complex problems outside of a particular area of expertise. Employers say they want all of those but aren’t getting them from graduates who major in narrower fields.
Eight out of 10 executives and hiring managers say it’s very or somewhat important that students emerge from college with these kinds of skills, according to a survey by the American Association of Colleges and Universities. Yet half said, in a separate survey by the Business-Higher Education Forum, that graduates are showing up without them, and that the problem is getting worse.
Along with Arizona, Virginia Tech is among a small group of universities taking steps to change the conversation about the humanities. A surprising number are technology-focused.
These include the Georgia Institute of Technology, which has also started drawing a connection between the humanities and good jobs at high pay. That has helped boost undergraduate and graduate enrollment in Georgia Tech’s Ivan Allen College of Liberal Arts by 58 percent since 2019, to 1,884 students in 2023 — the most recent period for which the figure is available.
Before then, “we were doing almost nothing to explain the value of the humanities,” said Richard Utz, interim dean. That’s important at a technological institute, he said. “So we started to connect each and every thing we do with the values that these kinds of skills have for [students’] career preparation.”
A medievalist, Utz uses the example of assigning his students 15th-century Robin Hood ballads. “They read something that is entirely alien to them, that is in late medieval English, so they’re completely out of their comfort zone,” he said. Then they split into groups and consider the material from various perspectives. It makes them the kind of future workers “who are versatile enough to look at a situation from different points of view.”
To him, Utz said, “the future of the humanities is not being hermetically sealed off, as in, ‘You’re over there and we’re over here.’ It’s making clear that the skills of engineers and computer scientists increase if you include the arts, the humanities, the social sciences.”
That’s also the idea behind a program in French for medical professionals at Washington University in St. Louis, which recruits students who took French in high school but may not have continued. For some, it leads to studying in Nice and interning at a hospital there, an unusual opportunity for undergraduates.
“These students, when they come back to the United States, they are accepted in the best medical schools because their dossiers are at the top of the pile,” said Lionel Cuillé, a professor of French who spearheads the initiative. “Those pre-meds take French because it is a clear added value to their first major.”
The participants in the humanities-focused executive education program at Virginia Tech — in the first two years, they’ve come from Amazon, Microsoft, Boeing, Zillow and other companies — study history, philosophy, religion, classics, literature and the arts. They use these to consider questions about and qualities of leadership and see how what they learn can be applied to technology trends including data privacy and artificial intelligence.
University of Arizona humanities dean Alain-Philippe Durand keeps a model of a billboard in his office that the department put up on Interstate 10 in Phoenix, near the campus of rival Arizona State, to promote the practical benefits of the humanities.
“What I was observing around me in Silicon Valley and more generally was a world that was missing that story,” said Virginia Tech’s Jaitly, a former technology entrepreneur and founder of a venture capital firm whose own undergraduate degree was in history. “The superpowers of the future emanate from the humanities: introspection and imagination, storytelling and story-listening, critical thinking.”
He purposely picked “leadership” instead of “humanities” for the name of the program, he said. “To me, ‘leadership’ is a high-impact word to show and not tell the power of the humanities.”
With a $1.25 million grant from the Mellon Foundation, Emory University is helping faculty members redesign humanities courses to emphasize their relevance, said Barbara Krauthamer, dean of its College of Arts and Sciences. “We’re not denying the reality of career readiness, of real-world application and of the context of the world we live in now, which is increasingly technological and changing rapidly,” Krauthamer said.
Central Michigan University in the fall began to offer a bachelor’s degree modeled on the University of Arizona’s, in “public and applied liberal arts.” It was added after the number of incoming students there who listed their intended majors as English, humanities and foreign languages fell from 179 in 2019 to zero in 2022 and 2023, according to university figures.
That trend “has a lot to do with the fact that even at a regional public [university], you need to know how you’re going to pay the bills after you’re done,” said Christi Brookes, assistant dean of the College of Liberal Arts and Social Sciences. “It’s a question we’ve ignored.”
The new degree connects humanities courses with the “applied fields” of entrepreneurship and environmental studies. Future combinations are planned with fashion and game design.
The traditional argument for the humanities, Brookes said, has been, “ ‘Well, it will make you a better citizen and person.’ But what was left out was, ‘What does that look like on a day-to-day basis?’ What we’re trying to do is say, ‘Here’s the connection.’ ”
Another way some universities are doing that is by showcasing the successes of former humanities students.
The liberal arts college at Georgia Tech serves up a litany of alumni success stories on its website. Arizona’s College of Humanities has produced a video of graduate testimonials; it features a senior counsel at Netflix, a principal investigator for the first NASA mission to return rock samples from an asteroid, the head of corporate strategy at the meal-delivery service Blue Apron, a diplomat, a Broadway actor and Golden State Warriors head coach Steve Kerr.
Judd Ruggill, head of the Department of Public and Applied Humanities at the University of Arizona. When parents see examples of humanities graduates in high-profile jobs, “you can see [them] visibly relaxing,” Ruggill says. Credit: Mason Kumet for The Hechinger Report
When they see examples like these, “You can see the parents visibly relaxing,” said Judd Ruggill, head of Arizona’s Department of Public and Applied Humanities.
The video is part of a relentless recruiting effort here, which ranges from a pop-up “humanities cafe” on the campus mall where faculty and advisers mingle with prospective majors to a mandatory two-day recruitment workshop training graduate teaching assistants to pick out humanities prospects among the students in required general-education courses. “Talent-spotting,” the college calls it.
“I think they know we need that push,” said senior Liliana Quiroz, who added Italian to her anthropology major after being prodded by a faculty member. Even then, she said, “My parents didn’t quite understand the benefits. There wasn’t that understanding of the skill sets that represented.”
But when she got an internship in a marketing department, she realized her humanities experience made her “confident enough to figure it out as I went.” She used self-reliance she learned taking on the challenge of a new language, Quiroz said, and analytical skills she developed reading literature in the original Italian.
Howe, the University of Arizona French and business double major, may not have initially thought French would help her get a job. She simply liked it and wanted to improve her skills — something else that advocates of the humanities say is being lost as colleges keep dropping these programs.
“I definitely discovered ways that it helped me in my finance career later on, but at the outset it was my passion that drove me to French,” she said.
Fellow senior Peyton Broskoff combined business administration with applied humanities. She also took a humanities course for which she teamed up with other students to revitalize a community library. That taught her “intercultural competence — just being able to understand and work with people.” It will help her in a future job, she said. “If you can market to different people, that means you can sell more products.”
Arturo Padilla signed up for a joint program in religious studies for health professionals. The son of indigenous Mexican parents, he plans to use what he is learning to combine traditional wellness and healing with modern medical practices.
Maxwell Eller has gotten something simpler from his major in classics. “It helped my attention span in a world of YouTube and Instagram,” said the University of Arizona senior. “I felt my knowledge was pretty shallow. I wanted to wrestle with ambiguities.” And learning the grammatical structures of Latin and Greek helped him in his volunteer work teaching English to women in Afghanistan.
University of Arizona humanities dean Alain-Philippe Durand keeps a model of a billboard in his office that the department put up on Interstate 10 in Phoenix, near the campus of rival Arizona State, to promote the practical benefits of the humanities. Credit: Mason Kumet for The Hechinger Report
While their incomes in the 10 years after graduation are below the median of all college graduates, students who go to liberal arts colleges, over the long term, earn a total of about $200,000 more according to the Georgetown Center on Education and the Workforce.
With little overhead, the humanities are also comparatively cheap to teach. Producing a credit hour in English or philosophy costs only a little more than half of what it costs to produce a credit hour in engineering, a study for the University of North Carolina System by Deloitte and the Burning Glass Institute found.
Still, humanities departments at public universities including Arizona’s are funded based on the number of students they enroll, making their recovery a matter of survival.
“At some point, we had to do something,” said Matt Mars, a professor in Arizona’s Department of Public and Applied Humanities. “If we think innovation is important, then we need to be innovative.”
It may take more than that. Some legislators who control the budgets of public universities and colleges have been skeptical of the value of humanities departments, especially those that house such subjects as gender and ethnic studies.
Some humanities faculty also bristle at the idea that their work is relevant only when combined with more career-oriented disciplines, said Durand, at the University of Arizona. “But you have to be aligned with your students,” he said.
Younger humanities faculty “get it,” Durand said. “They are willing to do interdepartmental collaboration. They know we can’t do things the way we always have.”
The Hechinger Report provides in-depth, fact-based, unbiased reporting on education that is free to all readers. But that doesn’t mean it’s free to produce. Our work keeps educators and the public informed about pressing issues at schools and on campuses throughout the country. We tell the whole story, even when the details are inconvenient. Help us keep doing that.
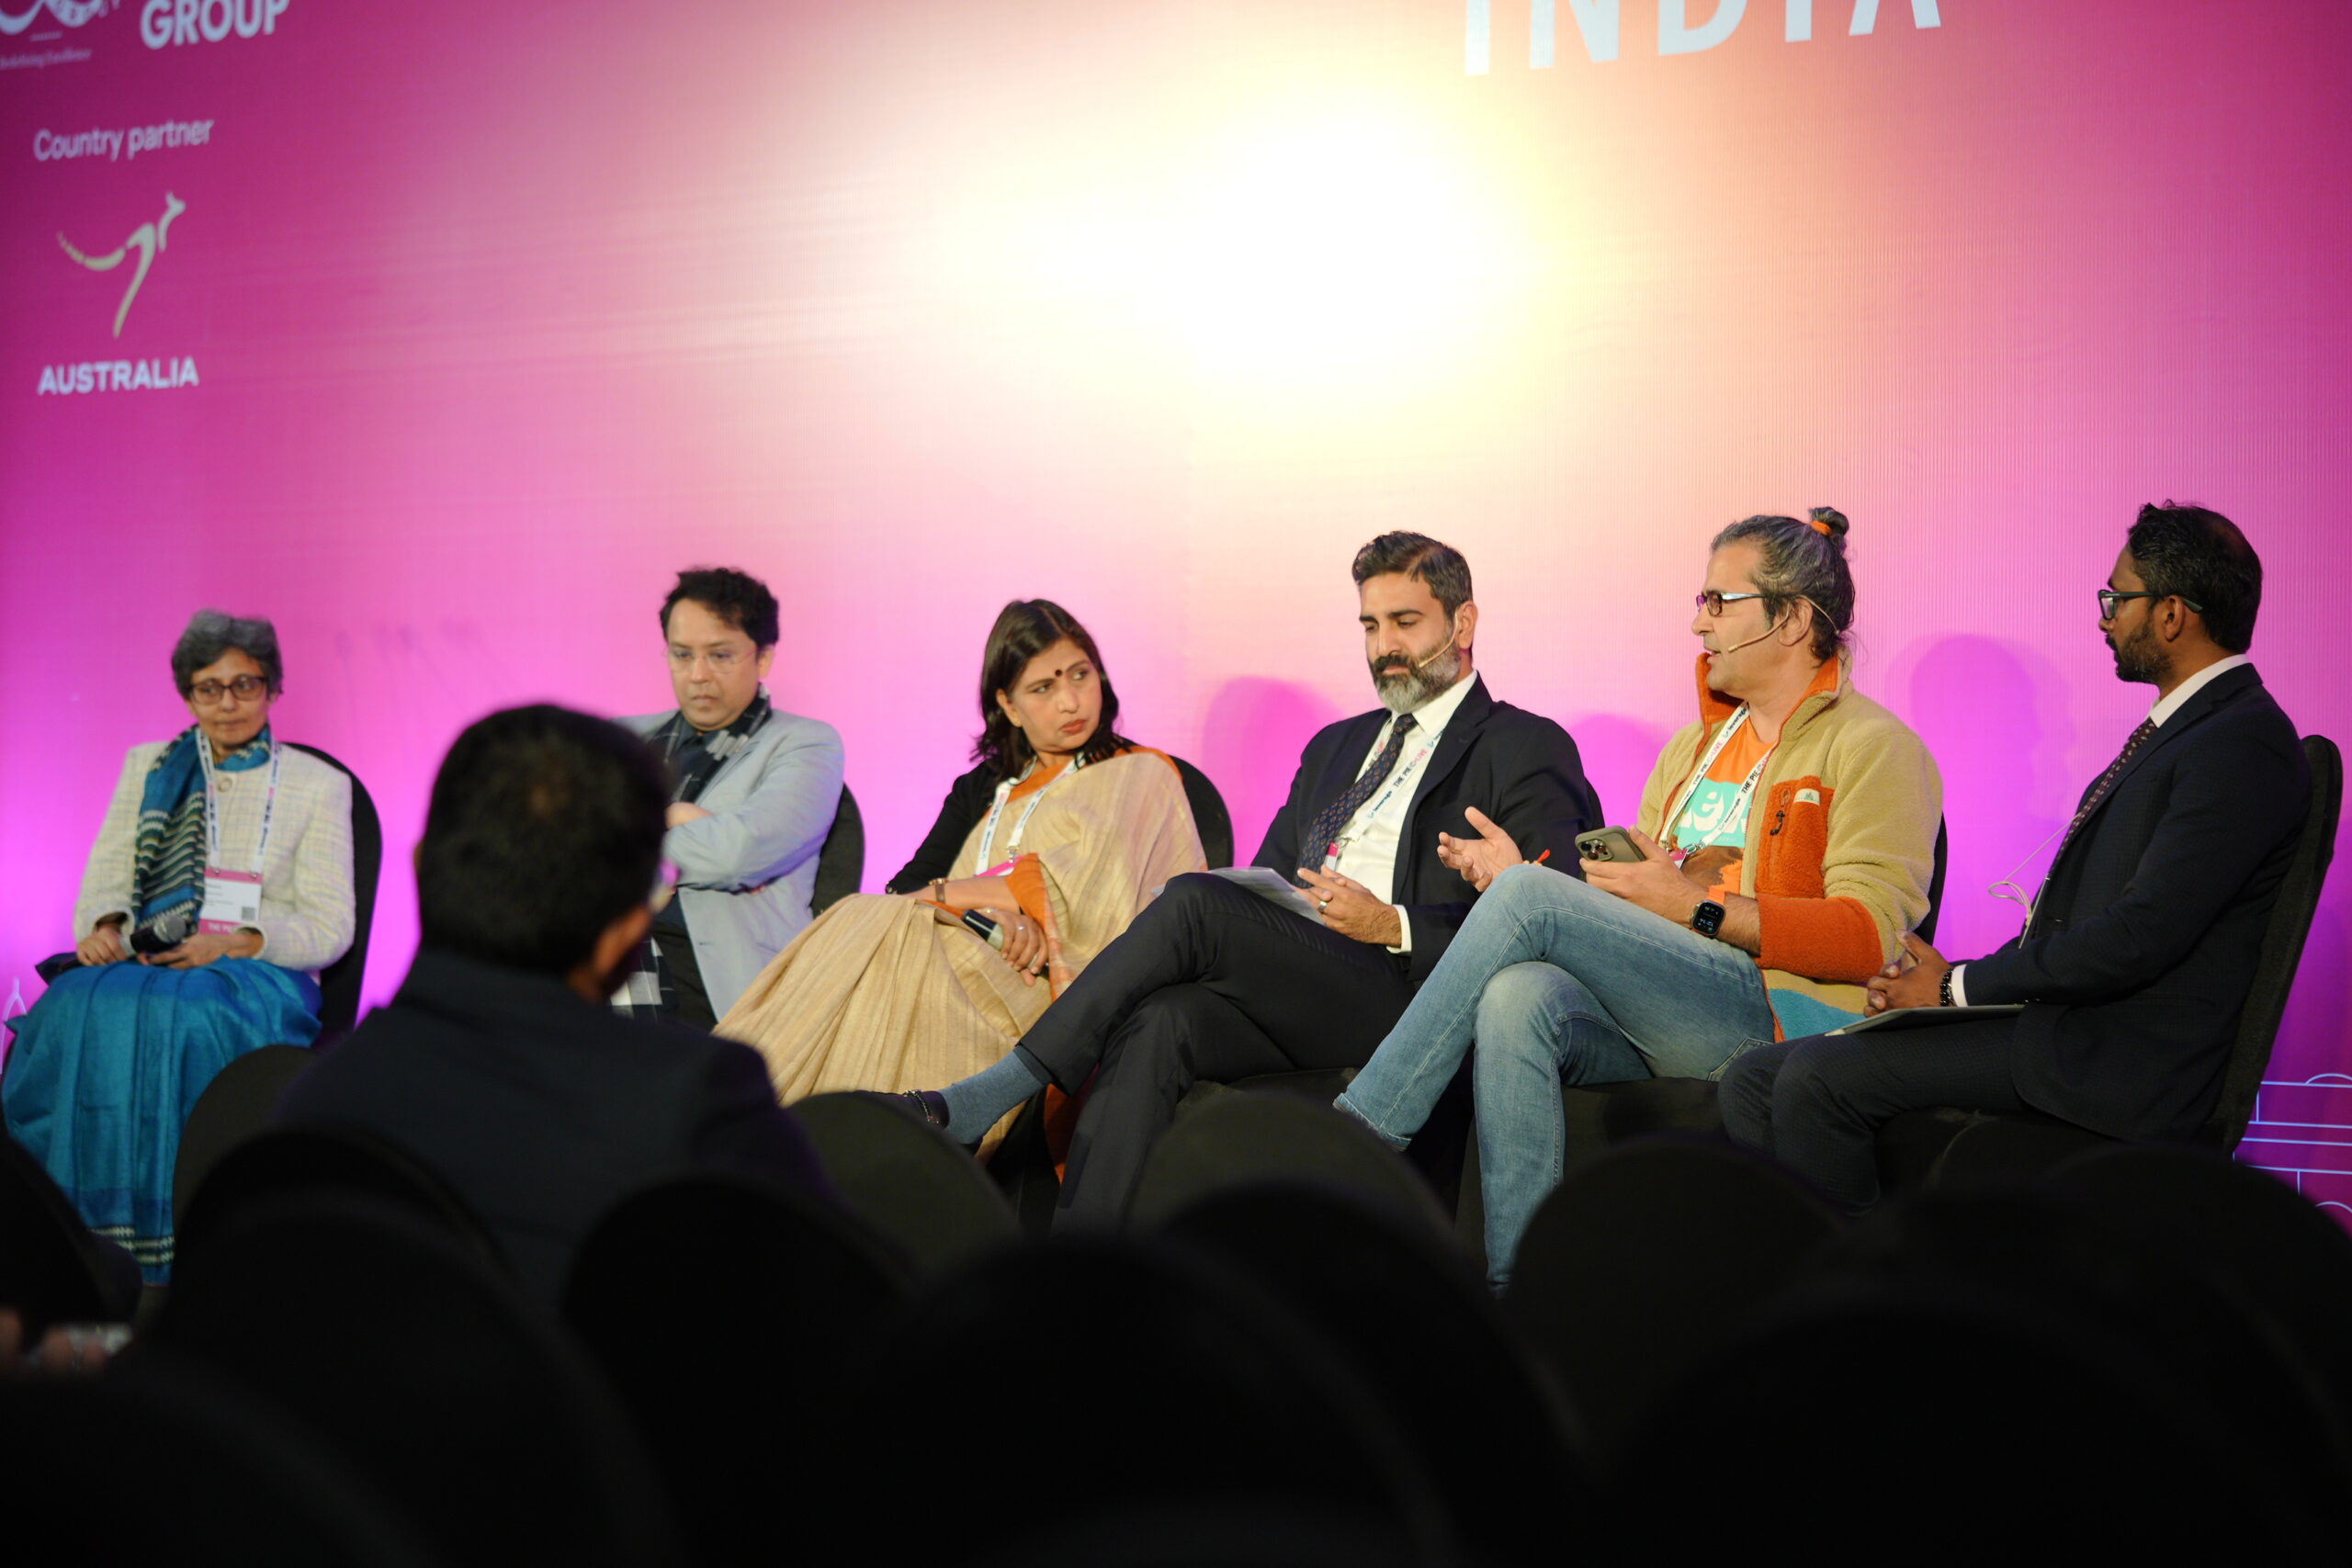
Discussions at the New Delhi event centered on India’s growing appeal as a destination for international students and a key partner for global institutions seeking to enhance their internationalisation strategies.
“In our recent visit to Sri Lanka, we saw over 3,000 students express interest to study in Indian universities due to them being affordable and providing high-quality education,” shared Pankaj Mittal, secretary general, Association of Indian Universities.
“Earlier, students from Sri Lanka were only looking at the US, UK, and Europe but that’s not affordable for them anymore, which is why they are focusing on India.”
Mittal stated that this phenomenon indicates a future where “India will prosper and become the destination where international students and educators will see potential.”
According to the Study in India portal, over 72,000 international students studied in India for the academic year 2024/25.
The rise in international students, especially from South Asia and Africa, has prompted the Ministry of Home Affairs to announce specialised visas dubbed the ‘e-student visa’ and ‘e-student-x visa.’
Additionally, a ‘G-20 talent visa’ has been announced for scientists, researchers, faculty members, and scholar academicians from G20 countries.
Elsewhere, reports suggest that IIT Madras is considering establishing a branch campus in Sri Lanka, joining other IITs in their plans for international expansion.
While international universities are making headlines concerning their expansion plans in India, Mittal highlighted that Indian universities are equally excited to collaborate with institutions abroad but need to find the right partners.
We are now handholding Indian universities to help them find the right partners and guide them on which areas they can collaborate in. Pankaj Mittal, AIU
“After the National Education Policy came into the picture, Indian universities are looking forward to more collaborations with international universities,” said Mittal.
“The only issue right now is that we need to help Indian universities, especially public ones, with capacity building. We are now handholding Indian universities to help them find the right partners and guide them on which areas they can collaborate in.”
Through its initiative ‘The Indian Network for Internationalisation of Higher Education’, which has 1,064 member Indian and international universities, AIU is helping Indian and international institutions advance their internationalisation strategies in India.
With a 17,000-strong student population, including over 210 international students, private institutions like UPES are partnering with top institutions across the world but want the benefits to be more ‘reciprocal’.
“Since the NEP, there have been a slew of regulations that are coming at a fast pace which are also overwhelming for us as Indian institutions,” said Ram Sharma, vice-chancellor, UPES.
“As an Indian institution we are pretty clear that we want the best for our students, which is why we have made it a policy to partner with the world’s top 100 universities, such as King’s College London, Edinburgh University, the University of Queensland, and more.”
Though joint and dual degrees are becoming major attractions in partnerships between Indian and international institutions, Sharma believes it’s not creating the same excitement among Indian students as expected.
“Except for our partnership with the University of Queensland, many of our partnerships have participation of less than ten students,” said Sharma.
“So now we are talking about a campus on campus model, wherein we can partner with a well-established existing institution and experiment with other models in light of increasing TNE interest.”
According to Rohit Kumar, director, international recruitment, partnerships, and mobility, University of York, a ‘culture of innovation’ that can benefit both Indian and international students can only be brought about by cross-disciplinary collaboration between the Indian education sector, international universities, and the Indian government.
“Dedicated funding streams are needed to strengthen research capabilities between institutions, while international universities entering India must actively engage with industry,” said Kumar.
Hi, everyone. This week I’m bringing you a dispatch from the Higher Education Climate Leadership Summit, hosted by the group Second Nature, where the Trump administration’s efforts to undo environmental action were very much top of mind. Thanks for reading. — Caroline Preston
WASHINGTON — Federal dollars for clean energy are disappearing. Environmental offices across the federal government are being dismantled. Universities are facing decisions about whether to scrub the words “climate change” from their projects in order to keep them funded.
Only a few weeks into Donald Trump’s second term, his attacks on climate action are already hindering universities’ efforts to curb their carbon emissions and minimize their harm to the planet, according to speakers at a conference I attended earlier this week hosted by the nonprofit group Second Nature.
Going forward, every higher ed institution needs “a Trump response plan,” said Gregory Washington, president of George Mason University, in Fairfax, Virginia.
Hundreds of college sustainability officers, university presidents, clean energy engineers, environmental researchers and others gathered for the event at a hotel blocks from the White House, where Trump has signed orders to “unleash” fossil fuels, sought to freeze clean energy funding, and overseen the removal of language on climate change from government websites.
Some takeaways from the conference:
Related: Want to read more about how climate change is shaping education? Subscribe to our free newsletter.
Universities need a plan to navigate the Trump administration. Colleges and universities should form rapid response teams to confront political threats, speakers said, and also find safety in numbers and advocate through coalitions. Institutions may also have to pick their battles and let some work go, said Washington. “They have a playbook,” said Shalanda Baker, the University of Michigan’s vice provost for sustainability and climate action, referring to the political actors trying to undo diversity, equity and inclusion, environmental justice and related work. “Let’s create a playbook — and let’s continue the work.”
Climate action is shifting. With a federal government hostile to climate action, higher ed can focus on making change alongside state and local governments instead. Universities can also partner with different types of organizations — health care systems, cultural institutions, businesses and others — to make progress. They might also consider forming alliances with institutions overseas.
Debates are raging about whether to avoid “trigger words” like “climate change.” Some speakers, including George Mason’s Washington, talked about how, with certain audiences, universities should avoid language that the administration objects to, including “climate change” and “zero carbon.” “It has to be about saying the right things to the right people so you can salvage and maintain the programs you have and continue to move forward on your mission,” he said. Others disagreed, arguing that changing the language in a proposal wouldn’t stop government staff from investigating the work programs actually do. “We have a clock over our heads. We need to stand in the work, and call it what it is, which is that we are trying to avert catastrophic climate change,” said Baker of the University of Michigan.
The threats are very real, not hypothetical. Dana R. Fisher, director of the Center for Environment, Community and Equity at American University, talked about how she was told in the last few days by people reviewing a government-funded project that unless she changed its focus from climate action to disaster recovery, it might not have a future. She noted that the American Climate Corps, a Biden-era program to deploy people into jobs related to fighting climate change, blinked out of existence after Trump took office. “We need to be realistic about what persistence and resistance looks like in channels like these if external forces will be shutting our work down,” said Fisher. She added, “The question I have for all of you is what are our universities going to do to protect us? Do I change the entirety of my website? What do I do about all the people funded for these grants who are now at risk of losing their jobs and their health care?”
Universities are complicit in climate change. Several speakers noted that universities have done far too little for too long on climate change, and their financial ties to fossil fuel companies are one reason. Jennie Stephens, professor of climate justice at the National University of Ireland Maynooth, said that universities’ complicity in climate change was one reason why she left U.S. academia for an institution overseas. “The fossil fuel industry and profit-seeking interests have captured academia,” she said, adding that as a result there aren’t research centers designed to help society move away from fossil fuels. She added, “We need to reclaim and restructure these institutions for bigger change.”
Students are tired of university inaction. “A lot of students are frustrated right now,” said Sydney Collins, a 2023 graduate of the University of Connecticut who is now a sustainability coordinator there. “A lot of students say it’s been bad and we’ve been terrified and you haven’t been listening. … And how dare you look at us now and say there’s nothing we can do. You haven’t been doing that work previously.” Fisher, of American University, said that anxiety, not anger, can motivate people to action, and that many people were outraged right now. To make change, she said, people need to think about “insider” and “outsider” strategies, and how students can sometimes be effective “outsider” voices pushing universities to change.
Still, campus climate action has accelerated, even in red states. The event celebrated higher education institutions that have had success in reducing their emissions and fighting climate change. Among those recognized was Central Community College in Hastings, Nebraska. One of its seven centers and campuses runs entirely on wind energy, another entirely on solar. In 2019, the college started a wind, solar and battery storage program to prepare students for jobs in those industries. The program has a 100 percent job placement rate, with students graduating into jobs that typically pay between $28 to $32 an hour, according to Taylor Schneider, the college’s energy technology instructor. Ben Newton, the college’s environmental sustainability director, said the college has had success in maintaining support for the program even in a state where opposition to wind energy is widespread because people see the financial and employment benefits. Newton said he’s accustomed to tailoring his messages for different audiences — for example, describing the specifics of climate science in a sustainability class he teaches and focusing more on resilience in the face of extreme weather events with administrators and others.
Higher ed needs new ways of measuring climate action. Second Nature, which encourages universities to make commitments to carbon neutrality, has been working to update those commitments to take into account different areas of work (like governance and education) and establish that neutrality is a milestone not an end point. That’s a step in the right direction, say some observers. “I don’t think it takes a lot of thought in the climate space to realize we can’t solve the climate crisis by paying everyone else to reduce their emissions,” said Alexander Barron, an associate professor of environmental science and policy at Smith College, who has argued that under the existing climate commitment model universities rely too heavily on purchasing offsets to meet their climate goals.
Going beyond neutrality requires all-in approaches. University officials talked about their strategies for moving beyond net neutrality and further reducing carbon emissions. Tavey Capps, executive director of climate and sustainability at Duke University, described the university’s efforts to ensure that all 10 of its schools — the divinity school, the law school, the business school and others — are engaged in and committed to climate action. Aaron Durnbaugh, director of sustainability with Loyola University of Chicago, talked about how climate action aligned with the Jesuit institution’s social justice mission. “We’re thinking about how we can ensure that more money goes back into communities,” he said, noting that the university had had some success by partnering on a solar project that provided unionized jobs for residents of nearby counties. “What does a Catholic heat pump look like? What does an equitable electric vehicle purchase look like?”
While many in attendance were reeling at the pace of the Trump administration’s anti-clean energy blitz, they also noted that there would be more to come. “They are just getting started,” said Fisher of American University.
“We have to stand in this moment,” said the University of Michigan’s Baker. “We have to be the tip of the spear and be courageous. I have a good job, but I’m willing to put myself out there.”
She added: “There are no safe harbors.”
Contact editor Caroline Preston at 212-870-8965 or [email protected]
The Hechinger Report provides in-depth, fact-based, unbiased reporting on education that is free to all readers. But that doesn’t mean it’s free to produce. Our work keeps educators and the public informed about pressing issues at schools and on campuses throughout the country. We tell the whole story, even when the details are inconvenient. Help us keep doing that.
The second term of Donald Trump has officially begun, but despite all the things he’s unveiled in the past several weeks, we don’t know fully what his policies are going to be over the next four years.
That is in part because Trump himself is a very erratic figure who says things that are nonsensical, even by his own standards. And also because while there are documents such as Project 2025 which were created by Trump’s ideological allies in the reactionary movement, that document itself is not particularly detailed in a number of ways.
But one thing we can be sure is going to happen in the second Trump administration is that he will conduct a full-scale assault on America’s colleges and universities. As a candidate, he did promise to create taxes on private university endowments. And he also talked about removing the funding for universities that don’t bow to his various censorship demands.
Unlike a number of other Trumpian boasts and threats, he is very likely to follow through on these ones because Republicans in a number of states and localities have enacted many of the policies that Trump has talked about doing on the campaign trail.


