

Securing steady enrollment growth and keeping students happily on board are top priorities in higher education. But how do you ensure you’re truly meeting student needs and demands? It’s all about measuring performance effectively. Gone are the days of navigating blindly through raw data; Key Performance Indicators (KPIs) are the laser-focused measures that cut through the noise, providing clear direction and a true sense of what’s working. It’s time to harness the power of data to steer your institution toward success.
Key Performance Areas
So, where do you start?
Determining your institution’s unique strategic goals is the first step. Once you know your target destination, KPIs become the navigation tools that guide you there. Look beyond generic metrics and choose a balanced set of KPIs across six performance areas:
AI Readiness
AI Readiness is the next-generation key area that proves you’re building a university that is smarter, more efficient and more responsive than anything the old systems could produce. If AI isn’t a core part of your institution’s DNA, you’re not just falling behind, you’re becoming obsolete. This isn’t about having a chatbot on your admissions page. It’s about a complete institutional transformation.
You can’t manage what you don’t measure. Here are the metrics that will expose whether your institution has truly embraced the future.
- AI density: Percentage of keywords that are ranking in AI overviews.
- Engagement metrics from AI chatbots such as engaged sessions and views.
- AI-Driven Workflow Automation Rate: Percentage of key administrative processes (e.g., admissions review, financial aid queries) that are fully or partially automated by AI.
- AI-Informed Decision-Making Rate: Percentage of high-level strategic decisions made based on predictive analytics and AI models.
- Student Support AI Integration: The percentage of student inquiries (e.g., in financial aid, advising or registrar services) handled by AI-powered tools.
- Personalized Learning Platform Adoption: The percentage of courses or students utilizing AI-powered platforms to tailor educational content and pace.
Enrollment and Student Retention Metrics
Strong enrollment and retention lead to higher graduation rates, reduced revenue loss and an improved institutional reputation. Driving college or university enrollment and retention involves pinpointing relevant Persistence, Progression, Retention and Completion (PPRC) metrics, gathering data from all angles (think systems, surveys, records) and using those insights to craft action plans.
These numbers aren’t just about growth. They are a measure of your institution’s ability to engage and keep students in a hyper-competitive market.
We delve deeper into this area by tracking:
- Enrollment rate: Percentage of applicants who accept and enroll in the program.
- Retention rate: Percentage of students who continue their studies from one semester/year to the next.
- Time-to-degree completion: Average time it takes students to graduate.
- Student satisfaction: Overall satisfaction with the educational experience, measured through surveys or feedback.
- Application start rate: Percentage of people who begin an application.
- Application completed rate: Percentage of people who finish and submit an application.
- New student start rates: Percentage of accepted students who actually begin their studies.
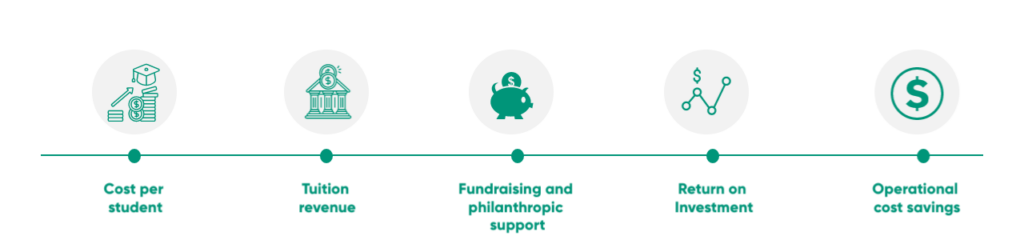
Financial and Operational Performance
A healthy financial and operational performance ensures sustainability, resource optimization, and the ability to reinvest in student success. We monitor:
- Cost per student: Average cost of educating each student.
- Tuition revenue: Income generated from student tuition fees.
- Fundraising and philanthropic support: Donations and grants received to support the institution.
- Return on investment: Measurable benefit in relation to resources invested.
- Operational cost savings: Reductions in operational expenses without compromising quality.
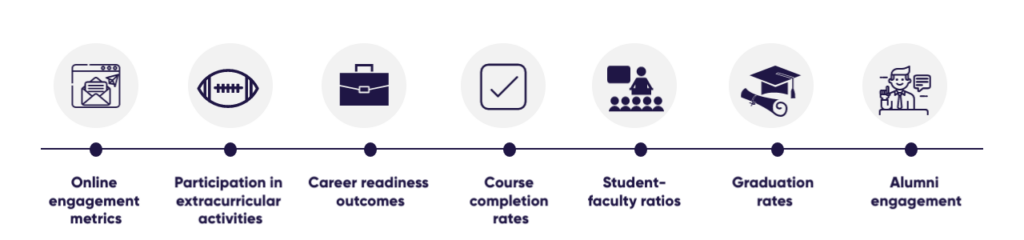
Student Engagement and Learning Outcomes
High student engagement and successful learning outcomes translate to greater student satisfaction, improved graduate employability and a boost to your institution’s reputation. Track the following key performance indicators:
- Online engagement metrics: Measures of student interaction and participation in online learning platforms.
- Participation in extracurricular activities: Level of student involvement in non-academic activities.
- Career readiness outcomes: Success of graduates in securing employment and achieving career goals.
- Course completion rates: Percentage of students who successfully complete each course.
- Student-faculty ratios: Number of students assigned to each faculty member.
- Graduation rates: Percentage of students graduating within the expected or predefined timeframe.
- Alumni Engagement: Level of engagement and involvement of graduates with the institution.
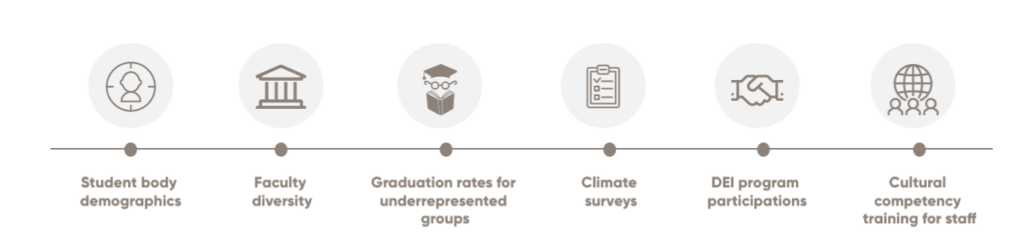
Diversity, Equity and Inclusion
Fostering a diverse and inclusive environment promotes equity in student success, attracts a wider talent pool, and strengthens your community. We assess:
- Student body demographics: Representation of different ethnicities, genders, socioeconomic backgrounds, etc. in the student population.
- Faculty diversity: Representation of different groups among faculty members.
- Graduation rates for underrepresented groups: Success rates of students from minority or disadvantaged backgrounds.
- Climate surveys: Assessments of the campus environment in terms of inclusivity and belonging.
- DEI program participations: Number of students, faculty, and staff engaging in diversity, equity, and inclusion initiatives.
- Cultural competency training for staff: Efforts to equip staff with knowledge and skills to support a diverse student body.
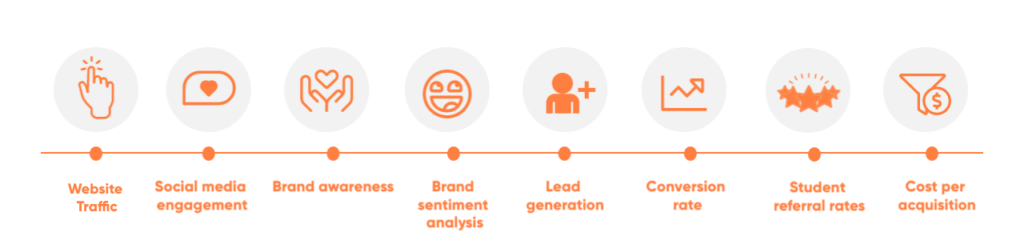
Brand Key Performance Indicators for Reputation and Marketing Effectiveness
Effective marketing strategies to increase student enrollment play a key role in establishing a strong brand reputation and contributing to a positive public image.
We monitor these key performance indicators:
- Website traffic: Number of visitors to the institution’s website.
- Social media engagement: Likes, shares, comments, and other interactions on social media platforms.
- Brand awareness: Recognition and familiarity with the institution by the target audience.
- Brand sentiment analysis: Understanding public perception and opinion of the institution.
- Lead generation: Number of potential students identified through marketing efforts.
- Conversion rate: Percentage of leads who actually enroll in the program.
- Student referral rates: Number of new students enrolled through recommendations from current or former students.
- Cost per acquisition: Average cost of acquiring a new student through marketing campaigns.
Implementing KPIs for Success
You’ve chosen your key performance indicators (KPIs). But hold up, don’t get lost in a sea of data just yet. We must translate those fancy metrics into real action.
First things first, let’s talk SMART goals. Ditch the vague aspirations and define clear, measurable objectives. Instead of “improve student satisfaction,” aim for “increase student satisfaction score by 5% within the next semester.” See how much more focused and actionable that is?
Data is your fuel, but dashboards are your engine. Imagine analyzing spreadsheets manually – cumbersome, right? Data visualization tools and dashboards are your secret weapons for making sense of all that information. They reveal trends, highlight areas for improvement and showcase your progress in a clear, digestible way.
Collaboration is key. Don’t work in silos! Involve different departments – admissions, finance, academics, marketing – everyone who plays a role in achieving your goals. Share your KPIs, gather their insights and work together to track progress and make informed decisions. Remember, a data-driven culture thrives on shared ownership and collective action.
Remember, adaptability is your superpower. The higher education landscape is dynamic, so your KPIs should be too. Review and update them based on new priorities, data-driven insights and feedback regularly. Be flexible, be responsive and embrace continuous improvement as your guiding principle.
The Future is Not an Improvement. It’s a Revolution.
Your competitors—the legacy players—are selling you on a slightly better version of the past. More data, a slightly cleaner CRM, a new consulting strategy. But what if the problem isn’t a lack of optimization but a fundamental design flaw?
The next generation of enrollment demands a completely new approach built on intelligence, not just data.
- From “Sticker Shock” to Financial Clarity
You can’t afford to lose students to sticker price anxiety. The future is about radical transparency. It’s about a clear, simple financial aid process that tells a student their true cost of attendance from day one. No surprises. No opaque spreadsheets. Just clarity.
- From Data Overload to Predictive Intelligence:
Stop drowning in data. The future is about leveraging AI and predictive analytics to identify the students most likely to enroll and graduate. It’s about understanding their unique needs before they even ask and delivering a hyper-personalized experience that feels like it was designed just for them.
- From Siloed Chaos to a Seamless Student Journey:
Overthrow the departmental silos. The future of enrollment is an all-in-one platform that connects every stage of the student journey—from initial search to application, financial aid and enrollment. It’s one portal, one point of contact, one seamless experience.
Stop Tinkering. Start Transforming.
You have a choice. You can keep doing what you’ve always done, hoping a better website or a new consulting firm will solve a systemic problem. Or you can admit the old way of doing things is broken and choose to fundamentally transform your approach.
Your KPIs aren’t just a measure of your progress; they are proof that the traditional system is failing. It’s time to stop measuring the problem and start building the solution.
Ready to dismantle the old way and build the next generation of enrollment? Partner with EDDY to identify crucial KPIs, develop effective strategies to increase student enrollment, and track progress toward sustainable growth. Together, we can turn your data into a powerful force for positive change and empower your institution to reach its full potential.
Take the first step today! Contact EDDY to learn how we can help you leverage the power of KPIs and achieve your strategic goals.